Mirae Asset NYSE FANG+ ETF - ICICI Direct

Page created by Leslie Higgins
 
CONTINUE READING
Mirae Asset NYSE FANG+ ETF - ICICI Direct
INVEST IN NEW AGE COMPATINES
         THAT MAY SOAR HIGH.

                                                                                                                                                                   *The above companies form part of the NYSE FANG+ Index

                                                  Mirae Asset NYSE FANG+ ETF
                                                  (An open-ended scheme replicating/tracking NYSE FANG+ Total Return Index)

                         Mirae Asset NYSE FANG+ ETF Fund of Fund
                                     (An open-ended fund of fund scheme predominantly investing in Mirae Asset NYSE FANG+ ETF)

NFO starts on: April 19, 2021 | NFO closes on: April 30 , 2021 (Mirae Asset NYSE FANG+ ETF)      NFO starts on: April 19, 2021 | NFO closes on: May 3, 2021 (Mirae Asset NYSE FANG+ ETF Fund of Fund)
Scheme re-opens for continuous Sale and Repurchase : May 07, 2021 (Mirae Asset NYSE FANG+ ETF)   Scheme re-opens for continuous Sale and Repurchase : May 11, 2021 (Mirae Asset NYSE FANG+ ETF Fund of Fund)
Mirae Asset NYSE FANG+ ETF - ICICI Direct
FANG+ : Opportunity to take focused exposure in global innovation leaders

           Social Media                                 E-Commerce                                   Products                                   Streaming                       Search Engine

                               Electric Vehicle                               Computer                                       Online                                 Search engine
                                                                               Graphics                                     Shopping                                  of China

                                            Single portfolio that potentially capture today’s global innovation leader

*The mentioned companies form part of the NYSE FANG+ Index. These logos are registered trademark ® of the respective companies. For Full disclaimer please refer Slide no. 34
Mirae Asset NYSE FANG+ ETF - ICICI Direct
FANG+ : Companies that capture the current mega-trends

           E-Commerce                                Internet Surfing                          Streaming         Gaming       Social Media

          Cybersecurity                             Cloud Computing                          Electric Vehicle    Industrial   Data Centre
                                                                                                                Automation

                        Megatrends are structural shifts that are long term in nature and are transformative force that
                                       has potential to change global economy, business and society.

Source: iShare, Pwc, Investing in Tomorrow: A Whitepaper on Thematic Investing by Global X
Mirae Asset NYSE FANG+ ETF - ICICI Direct
FANG+ : Geared for the future

                         List of Top 50 most innovative Companies for Year 2020                                                                        List of companies that have made
                                                                                                                                                       to top 50 list more than ten times
 Rank           Company                          HQ                     Rank            Company                           HQ                       ➢    Apple          ➢ Cisco
                                                                                                                                                   ➢    Alphabet       ➢ 3M
   01              Apple                 United States                    11                Tesla                 United States
                                                                                                                                                   ➢    Amazon         ➢ GE
   02           Alphabet                 United States                    12         Cisco Systems                United States                    ➢    Facebook       ➢ Intel
   03            Amazon                  United States                    13             Walmart                  United States                    ➢    HP             ➢ Nike
                                                                                                                                                   ➢    IBM            ➢ Procter & Gamble
   04           Microsoft                United States                    14              Tencent                       China
                                                                                                                                                   ➢    Microsoft      ➢ Daimler
   05           Samsung                   South Korea                     15              HP Inc.                 United States                    ➢    Samsung        ➢ Dell
                                                                                                                                                   ➢    Toyota         ➢ Siemens
   06            Huawei                        China                      16                Nike                  United States
                                                                                                                                                   ➢    BMW            ➢ Walmart
   07            Alibaba                       China                      17              Netflix                 United States
                                                                                                                                                         7 out of 10 companies forming part of
   08               IBM                  United States                    18         LG Electronics                South Korea                     NYSE FANG+ Index have made it to the list of top 50.

   09               Sony                       Japan                      19                Intel                 United States
                                                                                                                                                                4 of these companies are
   10           Facebook                 United States                    20                 Dell                 United States                          hailed as serial innovators ( > 10 times)

Source: The Most Innovative Companies 2020: The Serial Innovation Imperative study, Boston Consulting Group. Selected among over 2,500 companies
Mirae Asset NYSE FANG+ ETF - ICICI Direct
Focused to be a serial innovator and disruptor with an aim for excellence

                                          R&D Expense in 2018 (in USD Bn)

            Ranked among top 100 companies for R&D Within Top 250 rank

                                                                                                                                              Total revenue of some of largest
                                                                                                                                              Indian corporation (FY 2020).

                                                                                                                                              ○ Indian Oil Corporation: 69Bn
                                                                                                                                              ○ ONGC: USD 57Bn
                                                                                                                                              ○ SBI: USD51 Bn

                                Relentless focus on innovation may enable these companies to dominate in future too

Source: The Global Innovation 1000 study by Strategy, part of PwC network ; India's largest corporations the definitive ranking of India's top 500 companies.
Mirae Asset NYSE FANG+ ETF - ICICI Direct
Focused to keep an eye on external opportunity and threat

                Company                       Amount Spend
                   Nvidia                           $ 48 Bn
                 Facebook                           $ 26 Bn
                    Apple                           $ 26 Bn
                  Amazon                            $ 25 Bn
                 Alphabet                           $ 21 Bn
                  Alibaba                           $ 20 Bn
                    Baidu                            $ 6 Bn
                    Tesla                            $ 3 Bn
                   Twitter                           $ 1 Bn
                   Netflix                                -
                    Total                        USD 176Bn

                      Total market cap of Reliance is
                      USD 181Bn as on Feb 26, 2021

                                Along with Research & Development (R&D), FANG+ constituents are keeping an eye on
                                                 potential opportunity and threat to their business
Source: Tracxn: Technology and data for venture capital ; Data pertains to all the investment/acquisition made by the companies till Feb 26, 2021
Mirae Asset NYSE FANG+ ETF - ICICI Direct
Disruptions change but producer of the disruptions are constant:
NYSE FANG+ Index

                        Things that changed our lives in the past                                                   Things that are shaping our future

         In past, present or future, FANG+ companies were and are likely to be at the forefront of disruptive technologies

These logos are registered trademark ® of the respective companies. For Full disclaimer please refer Slide no. 34
Mirae Asset NYSE FANG+ ETF - ICICI Direct
NYSE FANG+ Index: At forefront of innovation then and now

                                     FANG+ companies caused disruption before and are geared to do it in future too

Source: Gartner Group, U.S. Department of Commerce. Data is for illustration purpose only.
Mirae Asset NYSE FANG+ ETF - ICICI Direct
FANG+ Stocks: Doing more than you think!

                                                                                                           How Does Twitter Make Money?

                        Alphabet                                                                                                                       Data
                                                                                                Promotionl           Promoted            Promoted   Licensing              Search
                                                                            Advertising           Tweets             Accounts             Trends                Firehose   Engine
                                                                                                                                                    revenue
➢ Google                      ➢ Google Venture

➢ Clouds                      ➢ Calico
                                                                                      TESLA BUSINESS MODEL - The TESLA Ecosystem
➢ Maps                        ➢ Waymo

➢ Android                     ➢ Fiber

➢ YouTube                     ➢ Sidewalk Labs

➢ Pixel                       ➢ Deep Mind

➢ Nest                        ➢ Verily

➢ Chromebook                  ➢ Project Wing

                              Companies like Alphabet are focusing on other bets to find its next big revenue stream.
Source: The Most Innovative Companies 2020: The Serial Innovation Imperative study, Boston Consulting Group. Selected among over 2,500 companies
Mirae Asset NYSE FANG+ ETF - ICICI Direct
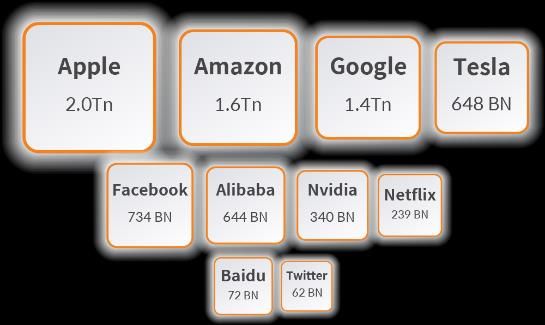
FANG+ Stocks : Doing more than you think !

                                                                                                                                   Streaming
                                                              MUSIC                             Cloud Storage
                                                                                                                                   Movie Review
                                                              Logistics                         Game Streaming
                                                                                                                                   E-Readers
                                                              Mobile Payment                    E-Commerce
                                                                                                                                   Smart Homes

                                                                    Small Business E-commerce                    Shopping Search Engine
                                                                    C2C Online Market Place                      Cloud Computing
                                                                    B2C Online Market Place                      Internet Portal
                                                                    B2B Online Market Place                      Online Payment

                 Amazon and Alibaba are global giants of e-commerce with steady focus on other revenue stream too.
Source: Finshots, Alibaba corporate structure , Data as on December 2020
FANG+ Stocks: Doing more than you think !

                        Facebook 5 & 10 Year Roadmap                                                                        Apple shifting from product to services

                                                                                                       10                                                      SERVICES                            PRODUCTS

                                                                                                                                                                              CHANNELS
                                                                                                                PRODUCTS
                                                                      Connectivity
                                                                                                                                                          Apple uses the devices as channels to distribute its services
                                                                                                                                                               e.g. Apple, Music, TV+ & Apple Arcade (gaming)
                                                                       Drones      Satellites     Lasers
                                          05
                                                   Terrestrial Solutions    Telco Infra     Free Basics

                                                                                          AI
                                                                                                                CHANNELS                                                        SERVICES

                                                                                   Vision       Language
           Video           Messenger
                                                                                Reasoning       Planning

                                                                                                                CUSTOMERS           Apple is rapidly investing in
           Search          WhatsApp                                             VR / AR                                            establishing a much broader                 SUBSCRIBERS

                                                                                                                                    ecosystem of services that                 EXPERIENCES

                                                                                                                                     build on the back of their
                                                                                   Mobile VR        Rift                               product user base.
           Groups          Instagram                                                                        OLD BUSINESS MODEL
                                                                    Touch       Social VR       AR Tech

                                    PRODUCTS                                          TECHNOLOGIES                                                                     NEW BUSINESS MODEL

                         Facebook and Apple both are diversifying at accelerated pace from their existing product line

Source: CBS insights, business model, Facebook press conference
Transgenerational companies across existing and emerging themes

                     Transgenerational companies across
                        existing and emerging themes
                                                                                                                                              Technology - 50%
                              Combined Market Cap of USD 7.7Tn

                                                                                                                                              Consumer - 30%

                                                                                                                                              Communication - 20%

Source: Bloomberg, Feb 26, 2021 , The combined market cap of BSE listed companies for 2020-21 stood at USD 2.8Bn based on BSE Exchange data
Power of 10: The combined power of NYSE FANG+ Index constituents

        Market Cap $7.7 Tn                                      Revenue $1.09 Tn                                       Cash $500 Bn                                      Net Income $179 Bn
         Could have been 03rd                                3x of Indian government                                 85% of total forex                                   Exceeds combined net
          largest country in                                        total receipt                                  reserve held by RBI in                                  income of all Indian
            terms of GDP                                          FY 2019 -2020                                            2020                                                 equities

                                         FANG+ stocks aims to capture growth and scale across multiple parameters

Source: Numbers are as of latest financial sourced from WSJ. GDP are nominal GDP data from world bank for 2019, department of economic affairs India, RBI Financial press release and Bloomberg. Data as on Feb 26, 2021
Part of your life today and geared to remain part of your life tomorrow

                              v
                            Baidu                                                     v
                                                                                   Alphabet

      Apple
                                                                    v
                                                                  Tesla

                                           WHY NOT
                                        MAKE ALL THESE
                v
              Netflix                     COMPANIES
                                         PART OF YOUR                       v
                                                                          Amazon
                                          PORTFOLIO?

     v
 Facebook

                                 v
                              Alibaba                            v
                                                               Nvidia
                                                                                     v
                                                                                   Twitter
Why Indian Investors
Need to Look Beyond India?
Winners keep on rotating across the geographies

      2011                 2012                  2013                  2014                  2015                  2016                 2017                  2018     2019     2020

      USA                  India                  USA                  India                 USA                   USA                  China                  USA      USA     China
      21%                   32%                   50%                   28%                  6%                    14%                   45%                   4%       34%      33%

     World                 China                World                   USA                 World                 World                  Asia                 World    World     Asia
     13%                    27%                 44%                     16%                  4%                   11%                    34%                   0%      31%       28%

    Europe                  Asia               Europe                 China                Europe                  Asia                 India                 India    Europe    USA
      6%                    26%                 42%                    11%                   2%                    8%                    30%                   0%       27%      24%

      Asia                Europe                 China                World                  India                China                Europe                  Asia    China    World
      -1%                  23%                    17%                  8%                     0%                   4%                   19%                    -6%      26%     19%

     China                World                   Asia                  Asia                China                Europe                 World                 Europe    Asia    India
      -3%                 20%                     17%                   8%                   -3%                   3%                   16%                    -6%      21%      11%

     India                  USA                  India               Europe                  Asia                  India                 USA                  China    India    Europe
     -20%                   19%                   15%                 -4%                    -5%                    -1%                  15%                  -11%      8%        9%

                                            India is not the only country that has performed better across the globe

Source: Bloomberg, based on MSCI country Indices (Large cap + Midcap) ; Asia excludes Japan, all the return are computed in INR based on FBIL INR/USD value
Depreciation of INR adds to the return

                                              Depreciation of INR

                                                                                                                                Dec-2019
      Dec-2008

                 Dec-2009

                            Dec-2010

                                       Dec-2011

                                                  Dec-2012

                                                             Dec-2013

                                                                        Dec-2014

                                                                                   Dec-2015

                                                                                              Dec-2016

                                                                                                         Dec-2017

                                                                                                                    Dec-2018

                                                                                                                                           Dec-2020
 80

 90

100
                                                                                                                               2.32%
110

120

130

140

150

160

170                                                                                                                 3.48%
                                                    INR/USD                        INR/EUR

           INR has historically depreciated against USD and EUR over long-term; adding to investors return. When INR
                                  depreciates the value of foreign asset increases and vice-versa
Source: Bloomberg, based on MSCI country Indices (Large cap + Midcap) ; Exchange rates as published by FBIL are used. Past performance may or may not sustain in future. The index return are in Total Return Variant.
The data shown above pertains to the Index and does not in manner indicate performance of any scheme of the Fund. IF INR appreciates against the currency in which investments are made then the value of foreign
asset declines as a result of which the fund investing in such foreign asset will also bear the impact of it.
Diversify your investment across the globe

                                                       Correlation of Indian equity return with other equity markets

                                                                                                                                                           China: 0.38

                                                                                                                                                  Europe: 0.32

                                                                                                                                      World: 0.25

                                                                                                                 USA: 0.16

                                                       Lower correlation can lead to diversification of country risk.
Source: Bloomberg, based on MSCI country Indices (Large cap + Midcap) ; Asia excludes Japan, all the return are computed in INR based on FBIL INR/USD value.
Data from 01st Jan 2009 to 31st Dec 2020 is considered for computing correlation between the returns
Potential Wealth Creation through international exposure

              Cost of two-year top US MBA program (in INR)                                                                           Value of Investment from 2011 to 2020

                                                                                                                           MSCI USA INDEX                                                3,13,76,358

                                                                                                                        MSCI WORLD INDEX                                   2,27,02,689

                                                                                                                               MSCI CHINA                      1,78,22,366
                         2010                                 2021
                       51,38,928                           1,65,75,900                                                  MSCI ASIA EX JAPAN                   1,61,74,011

                                                                                                                       MSCI EUROPE INDEX                   1,49,23,963

                                                                                                                         MSCI INDIA INDEX           1,23,25,506

                                                                                                                        DOLLAR CURRENCY        83,77,978

                                                          One needs to look beyond India for investment exposure

Source: Harvard MBA business school tuition cost is considered (Poets & Quants) ; Exchange rate used for conversion are based on FBIL average for 2010 and 2020
Mirae Asset NYSE FANG+ ETF
         offerings
About NYSE FANG+ Index

          The NYSE FANG+ Index is an equal weighted Index designed to represent a segment of the technology and consumer
                                   discretionary sectors consisting of highly-traded growth stocks.

                                                                                        ICE Data Indices Governance Committee will oversee a
                           All stocks classified as Consumer                            process to select FANG (Facebook, Amazon, Netflix and
                              Discretionary or Technology                               Google) and FANG-related stocks.

      Trailing daily traded                                     Listed on a major
      volume of USD                    Initial Universe:        U.S. stock exchange     Stocks selected for the Index should exhibit
      $ 50million                                                                       characteristics of high-growth technology and
                                                                                        internet/media stocks.

    Full market capitalization                             Representative of the
    of at least USD$ 5billion                              high-growth technology and
                                                           internet/media Industry      The Committee will focus on distinguishing between
                                                                                        traditional technology and service companies and
                                                                                        newer, innovative, technology-utilizing companies.

Source: NYSE FANG+ Index methodology
NYSE FANG+ Index has outperformed with lower correlation

                       9,000.00                                                                                                                                                                                                                                8257.54
                                                               NYSE FANG+ Index TRI (INR)
                       8,000.00                                Correlation (Since Inception)
                       7,000.00
                                                      NASDAQ - 100 Index TRI (INR)                                                      0.90
                       6,000.00
                                                      S&P 500 Index TRI (INR)                                                           0.78
                       5,000.00
                                                      Nifty50 TRI (INR)                                                                 0.15                                                                                                                   4060.21
                       4,000.00

                       3,000.00                                                                                                                                                                                                                                  2590.41

                       2,000.00
                                                                                                                                                                                                                                                               1933.04
                       1,000.00

                               -
                                    Nov-14

                                                                                                                                         Aug-17

                                                                                                                                                  Nov-17

                                                                                                                                                                             Aug-18

                                                                                                                                                                                      Nov-18

                                                                                                                                                                                                                          Nov-19

                                                                                                                                                                                                                                                      Aug-20

                                                                                                                                                                                                                                                               Nov-20
                                             Feb-15

                                                      May-15

                                                                Aug-15

                                                                         Nov-15

                                                                                  Feb-16

                                                                                           May-16

                                                                                                    Aug-16

                                                                                                             Nov-16

                                                                                                                      Feb-17

                                                                                                                               May-17

                                                                                                                                                           Feb-18

                                                                                                                                                                    May-18

                                                                                                                                                                                               Feb-19

                                                                                                                                                                                                        May-19

                                                                                                                                                                                                                 Aug-19

                                                                                                                                                                                                                                   Feb-20

                                                                                                                                                                                                                                             May-20

                                                                                                                                                                                                                                                                        Feb-21
                                   NYSE FANG+ Index TR (INR)                                           NASDAQ - 100 Index TR (INR)                                             S&P 500 Index TR (INR)
                                                                                                                                                                                                   n                                        Nifty50 TR (INR)

                                             NYSE FANG+ Index has historically outperformed S & P500 & NASDAQ-100.
                                                     Also it has exhibited lower correlation with Nifty50 Index
Source: Bloomberg data as on Feb 21st, 2021 ; Exchange rate of FBIL are used for conversion of index value from USD to INR. Past performance may or may not sustain in future. The index return are in Total Return
Variant. The data shown above pertains to the Index and does not in manner indicate performance of any scheme of the Fund.
NYSE FANG+ Index calendar year performance

         Particular                   Index                        SL              5 Years             3 Years                2 Years                1 Year              6 months               3 months
                               NYSE FANG+ Index                  38.8%               46.8%               42.8%                  65.9%                 105.3%                 18.4%                 17.3%

         Return in            NASDAQ - 100 Index                 24.3%               28.1%               29.6%                  38.0%                  55.6%                  6.2%                  4.3%
           INR                     Nifty50 Index                 10.8%               17.3%               12.9%                  17.4%                  31.3%                 28.2%                 12.3%
                                     INR/USD                      2.9%               1.3%                 3.9%                   1.3%                  1.2%                  -0.8%                  -1.0%
                               NYSE FANG+ Index                  31.7%               33.0%               39.9%                  43.5%                  55.8%                 63.4%                 76.6%

           Risk in             NASDAQ-100 Index                  23.6%               24.0%               29.0%                  31.5%                  40.8%                 36.8%                 41.6%

            INR                    Nifty50 Index                 19.7%               19.8%               23.9%                  27.8%                  36.2%                 29.7%                 36.4%

                                     INR/USD                      5.1%               5.2%                 5.8%                   5.4%                  5.7%                   5.0%                  5.0%

                               NYSE FANG+ Index                    1.2                1.4                  1.1                    1.5                   1.9                    0.3                   0.2

                               NASDAQ-100 Index                    1.0                1.2                  1.0                    1.2                   1.4                    0.2                   0.1
         Return to
         Risk Ratio                Nifty50 Index                   0.5                0.9                  0.5                    0.6                   0.9                    0.9                   0.3

                                     INR/USD                       0.6                0.2                  0.7                    0.2                   0.2                   -0.2                   -0.2

                                NYSE FANG+ Index on risk-adjusted basis has outperformed S&P500 and NASDAQ-100
Source: Bloomberg data as on Feb 26 2021 ; Exchange rate of FBIL are used for conversion of index value from USD to INR. Past performance may or may not sustain in future. The index return are in Total Return Variant.
The data shown above pertains to the Index and does not in manner indicate performance of any scheme of the Fund. Risk is nothing but computed as annualized standard deviation of daily return observation for specific
investment horizon for all the indices using their INR total return variant.
NYSE FANG+ Index calendar year performance

         Particular                    Index                      2014              2015               2016                  2017                  2018                 2019               2020               2021
                                 NYSE FANG+ Index                 -2.2%              36.2%              18.8%                49.3%                   9.5%               42.9%              108.2%              1.7%

          Return in             NASDAQ - 100 Index                 8.0%              14.9%              9.9%                 25.1%                   9.2%               42.4%               52.6%              0.2%
            INR                     Nifty50 Index                  2.1%              -3.0%              4.4%                 30.3%                   4.6%               13.5%               16.1%              -2.5%
                                       INR/USD                     4.2%              4.7%               2.5%                 -5.9%                  -5.9%                2.1%               2.5%               -0.1%
                                 NYSE FANG+ Index                 21.7%              21.8%              21.5%                16.3%                  40.7%               23.0%               39.8%             34.6%

            Risk in             NASDAQ-100 Index                  16.1%              17.8%              16.1%                10.2%                  36.7%               16.3%               36.3%             22.5%

             INR                    Nifty50 Index                 21.5%              21.3%              21.7%                16.9%                  40.6%               23.5%               39.6%             35.1%

                                       INR/USD                    16.6%              17.4%              16.2%                11.3%                  36.5%               16.7%               36.1%             23.2%

                                 NYSE FANG+ Index                  -0.1               1.7                0.9                   3.0                    2.3                 1.9                2.7                0.0

                                NASDAQ-100 Index                    0.5               0.8                0.6                   2.5                    1.3                 2.6                1.4                0.0
         Return to
         Risk Ratio                 Nifty50 Index                   0.1               -0.1               0.2                   1.8                    0.4                 0.6                0.4                -0.1

                                       INR/USD                      0.2               0.3                0.2                   -0.5                   0.1                 0.1                0.1                0.0

                                     NYSE FANG+ Index has outperformed S&P500 and NASDAQ-100 on risk-adjusted
                                                 and absolute return basis in 7 out of 8 calendar years
Source: Bloomberg data as on Feb 26, 2021 ; Exchange rate of FBIL are used for conversion of index value from USD to INR. Past performance may or may not sustain in future. The index return are in Total Return Variant.
The data shown above pertains to the Index and does not in manner indicate performance of any scheme of the Fund.
NYSE FANG+ Index performance for rolling return period

                    NYSE FANG+ Index v/s NASDAQ-100 Index
       Outperformance           5 Year       3 Year       2 Year         1 Year
                                                                                                                                                   Average Rolling Return
              >7%                95%          90%           72%           69%
          >5% & 3% & 1% & 0% & 5% & 3% & 1% & 0% &
NYSE FANG+ Index sector and stock weighing

                              Gics Industry Classification                         Weight (in %)                       Stock Name      Weight (in %)

                                                                                                                         Baidu             14.4
                         Interactive Media & Services                                   46.1
                                                                                                                         Twitter           12.1
                         Internet & Direct Marketing Retail                             17.1                            Alphabet           11.0
                                                                                                                         Netflix            9.4
                         Entertainment                                                  9.4
                                                                                                                         NVIDIA             9.3
                         Semiconductors & Semiconductor                                                                  Apple              9.1
                                                                                        9.3
                         Equipment
                                                                                                                          Tesla             9.1
                         Technology Hardware, Storage &
                                                                                        9.1                             Amazon              8.9
                         Peripherals
                                                                                                                        Facebook            8.6
                         Automobiles                                                    9.1
                                                                                                                        Alibaba             8.3

                ○ The periodical rebalancing occurs quarterly
                ○ Weight of each index constituents is set at 10% (equal weigh) on the date of rebalancing
                ○ Between the two-rebalancing quarter, the weight of each index constituents may drift due to price movement observed for each stock.

                                           The Index potentially aims to provide focused exposure to FANG+ Stocks

Source: Data as on March 03, 2021, The GICS classification is based on NYSE FANG+ data. NYSE FANG+ Index methodology
NYSE FANG+ Index sector and stock weighing

                           NYSE FANG+ Index constituents                                                                     Nifty50 Index constituents (Top 10)

                             Stock Name                     12M Forward P/E                                                       Stock Name                     12M Forward P/E

                               Alibaba                             19.7                                                            HDFC Life                             91.4
                              Facebook                             20.4                                                               Titan                              67.1
                              Alphabet                             26.0                                                              Nestle                              63.3
                                Apple                              27.6                                                           Asian Paints                           62.4
                                Baidu                              28.4                                                           Bharti Airtel                          57.3
                                Nvidia                             41.1                                                       Hindustan Unilever                         53.9
                               Amazon                              48.8                                                        SBI Life Insurance                        48.8
                                Netflix                            51.3                                                         Shree Cements                            46.4
                               Twitter                             82.7                                                             Britannia                            43.7
                                 Tesla                             156.8                                                         Bajaj Finance                           42.0

                 ○ 12M forward P/E of FANG+ constituents are relatively lower than India’s highest P/E stock forming part of Nifty50 Index.
                 ○ Consumer durable and consumer staple in India are continues to have higher P/E

Source: Data as on March 03, 2021, The GICS classification is based on NYSE FANG+ data. NYSE FANG+ Index methodology. The sector(s)/stock(s)/issuer(s) mentioned in this presentation do not constitute any research
report/recommendation of the same and the Fund may or may not have any future position in these sector(s)/stock(s)/issuer(s).
Are FANG+ Index constituents valued high ?

         5.00                                               Standard Deviation Bands of 12M forward P/E
         4.00

         3.00                                                                                                                                                                    1.04
         2.00

         1.00

              -
        (1.00)                                                                                                                                                                   0.32
        (2.00)

        (3.00)

        (4.00)
                     Feb- Apr-         Jun-      Aug-      Oct-      Dec-     Feb-      Apr-     Jun-      Aug-      Oct-     Dec-      Feb-      Apr-   Jun-   Aug-   Oct-   Dec-   Feb-
                     2018 2018         2018      2018      2018      2018     2019      2019     2019      2019      2019     2019      2020      2020   2020   2020   2020   2020   2021

                                                                 NASDAQ-100 Index                               NYSE FANG+ Index

                  ○ 12M forward P/E of NYSE FANG+ Index stands at 35.99x (0.32σ) whereas its historical average over last two year stands at 34.21x.
                  ○ 12M forward P/E of NASDAQ-100 Index stands at 28.39x (1.04σ) whereas its historical average over last two year stands at 23.62x.

Source: Data as on February 26, 2021 ; period range from Jan 29, 2018 – Feb 26, 2021 considered. 12M Blended Forward P/E based on Bloomberg estimate
Why invest in Mirae Asset NYSE FANG+ ETF and Fund of Fund ?

 Focused and equal                              Portfolio of                              Provides passive                            Provides avenue to     Has delivered
 weighted exposure                           companies which                                international                              benefit also from   better Returns and
  in innovative high                           are geared to                                  exposure                                 INR depreciation      Risk adjusted
 growth technology,                            participate in                            predominantly to                                                     returns than
 internet and media                          future technology                           US markets at low                                                    NIFTY 50 and
        stocks.                                 disruptions                                      cost                                                       NASDAQ 100 in
                                                                                                                                                              the long run

Past performance may or may not sustain in future. The data pertains to the Index and does not in manner indicate performance of any scheme of the Fund.
Annexure
NFO Details for Mirae Asset NYSE FANG+ ETF

         NFO Period                 Allotment Date         Benchmark                    Listing
         19th April 2021 –
                                    06th May 2021          NYSE FANG+ Index (INR)       NSE & BSE
         30th April 2021

                                    Minimum                Post NFO                     Authorized
         Fund Manager               Investment             On exchange ( in multiple    Participant
                                    Rs. 5000/- and in      of 1 units), Directly with   Mirae Asset Capital
         Mr. Siddharth Srivastava
                                    multiples of Rs. 1/-   AMC (in multiple of          Markets
                                    thereafter.            2,00,000 units)              (India) Pvt Ltd.

         Taxation                   Redemption*
         Debt                       T+4
NFO Details for Mirae Asset NYSE FANG+ ETF Fund of Fund

                        NFO Period                                               Allotment Date                                           Benchmark                          Plan & Options
                        19th April 2021 –                                                                                                                                    Regular Plan and Direct
                                                                                 10th May 2021                                            NYSE FANG+ Index (INR)
                        03rd May 2021                                                                                                                                        Plan with Growth Option

                                                                                 Minimum
                                                                                                                                          Post NFO
                        Fund Manager                                             Investment                                               Minimum Additional                 Taxation
                        Ms. Ekta Gala                                            Rs. 5000/- and in                                        Application Amount                 Debt
                                                                                 multiples of Rs. 1/-                                     Rs. 1000/-.
                                                                                 thereafter.

                                                                                 SIP Amount                                               Exit Load:
                                                                                                                                          If redeemed within 3 months from
                        Redemption*                                              Monthly and Quarterly:
                                                                                                                                          the date of allotment: 0.50%
                        T+5                                                      Rs. 5000/- (and in
                                                                                                                                          If redeemed after 3 months from
                                                                                 multiples of Re. 1/-)
                                                                                                                                          the date of allotment: NIL

* Redemption cycle for Fund of Fund will be T+ 5 days which is one day after the ETF pays to the FOF, but within the stipulated 10 Business days. Holiday / Business Day
scenario of the underlying to be checked for actual pay out date.
Disclaimers

BSE/NSE Disclaimer: Every person who desires to apply for or otherwise acquires any unit of this Fund may do so pursuant to independent inquiry, investigation and analysis and shall not have any claim against the
Exchange whatsoever by reason of any loss which may be suffered by such person consequent to or in connection with such subscription/ acquisition whether by reason of anything stated or omitted to be stated herein or
any other reason whatsoever

Statutory Details: Trustee: Mirae Asset Trustee Company Private Limited; Investment Manager: Mirae Asset Investment Managers (India) Private Limited (AMC); Sponsor: Mirae Asset Global Investments Company Limited.

The information contained in this document is compiled from third party and publically available sources and is included for general information purposes only. There can be no assurance and guarantee on the yields.
Views expressed by the Fund Manager cannot be construed to be a decision to invest. The statements contained herein are based on current views and involve known and unknown risks and uncertainties. Whilst Mirae
Asset Investment Managers (India) Private Limited (the AMC) shall have no responsibility/liability whatsoever for the accuracy or any use or reliance thereof of such information. The AMC, its associate or sponsors or group
companies, its Directors or employees accepts no liability for any loss or damage of any kind resulting out of the use of this document. The recipient(s) before acting on any information herein should make his/her/their
own investigation and seek appropriate professional advice and shall alone be fully responsible / liable for any decision taken on the basis of information contained herein. Any reliance on the accuracy or use of such
information shall be done only after consultation to the financial consultant to understand the specific legal, tax or financial implications.

ICICI Securities Ltd.( I-Sec). Registered office of I-Sec is at ICICI Securities Ltd. - ICICI Centre, H. T. Parekh Marg, Churchgate, Mumbai - 400020, India, Tel No : 022 - 2288 2460, 022 - 2288 2470. AMFI Regn. No.: ARN-0845.
We are distributors for Mutual funds. Mutual Fund Investments are subject to market risks, read all scheme related documents carefully. The contents herein above shall not be considered as an invitation or persuasion
to trade or invest. I-Sec and affiliates accept no liabilities for any loss or damage of any kind arising out of any actions taken in reliance thereon.

Mutual fund investments are subject to market risks, read all scheme related documents carefully.
For further information about other schemes (product labelling and performance of the fund) please visit the website of the AMC: www.miraeassetmf.co.in

Please consult your financial advisor before investing
PRODUCT LABELLING___________________________________________________________________                                                                PRODUCT LABELLING___________________________________________________________________

Mirae Asset NYSE FANG + ETF is suitable for investors who are seeking*                                                                              Mirae Asset NYSE FANG+ ETF Fund of Fund is suitable for
                                                                                                   M
                                                                                                       od e
                                                                                                           ra   te
                                                                                                                     Mo der
                                                                                                                       H ig at e ly
                                                                                                                            h
                                                                                                                                                    investors who are seeking*                                                                          M
                                                                                                                                                                                                                                                            od e
                                                                                                                                                                                                                                                                ra   te
                                                                                                                                                                                                                                                                          Mo der
                                                                                                                                                                                                                                                                            H ig at e ly
                                                                                                                                                                                                                                                                                 h

• Returns that are commensurate with the performance of NYSE FANG + Total                                                             Hi                                                                                                                                                   Hi
                                                                                           er to

                                                                                                                                                                                                                                                er to
                                                                                               e

                                                                                                                                                                                                                                                    e
                                                                                                                                        gh                                                                                                                                                   gh
                                                                                             at

                                                                                                                                                                                                                                                  at
                                                                                         od w

                                                                                                                                                                                                                                              od w
                                                                                                                                                    • To generate long term capital appreciation/income
                                                                                        M Lo

                                                                                                                                                                                                                                             M Lo
  Return Index, subject to tracking error and foreign exchange movement.
                                                                                                                                             Very

                                                                                                                                                                                                                                                                                                  Very
                                                                                                                                             High

                                                                                                                                                                                                                                                                                                  High
                                                                                  Low

                                                                                                                                                                                                                                       Low
• Investments in equity securities covered by NYSE FANG + Total Return Index                                                                        • Investments predominantly in units of Mirae Asset NYSE FANG + ETF

                                                                                  Investors understand that their principal                                                                                                            Investors understand that their principal
*Investors should consult their financial advisers, if they are not clear about           will be at Very High Risk                                  *Investors should consult their financial advisers, if they are not clear about           will be at Very High Risk

the suitability of the product.                                                                                                                      the suitability of the product.
ICE Disclaimers

Disclaimer:

Source ICE Data Indices, LLC (“ICE Data”) is used with permission. “[SM/®]” is a service/trade mark of ICE Data or its affiliates and has been licensed, along with the FANG + Index (“Index”) for use by Mirae Asset Investment
Manager (India) Pvt. Ltd. in connection with Mirae Asset NYSE FANG+ ETF (the “Product”). NYSE® is a registered trademark of NYSE Group, Inc., an affiliate of ICE Data and is used by ICE Data with permission and under a
license. Neither the Mirae Asset Investment Manager (India) Pvt. Ltd., Mirae Asset Trustee Company Private Limited (the “Trust”) nor the Product, as applicable, is sponsored, endorsed, sold or promoted by ICE Data, its
affiliates or its Third Party Suppliers (“ICE Data and its Suppliers”). ICE Data and its Suppliers make no representations or warranties regarding the advisability of investing in securities generally, in the Product particularly,
the Trust or the ability of the Index to track general stock market performance. ICE Data’s only relationship to Mirae Asset Investment Manager (India) Pvt. is the licensing of certain trademarks and trade names and the
Index or components thereof. The Index is determined, composed and calculated by ICE Data without regard to the LICENSEE or the Product or its holders. ICE Data has no obligation to take the needs of the Licensee or
the holders of the Product into consideration in determining, composing or calculating the Index. ICE Data is not responsible for and has not participated in the determination of the timing of, prices of, or quantities of the
Product to be issued or in the determination or calculation of the equation by which the Product is to be priced, sold, purchased, or redeemed. Except for certain custom index calculation services, all information provided
by ICE Data is general in nature and not tailored to the needs of LICENSEE or any other person, entity or group of persons. ICE Data has no obligation or liability in connection with the administration marketing, or trading
of the Product. ICE Data is not an investment advisor. Inclusion of a security within an index is not a recommendation by ICE Data to buy, sell, or hold such security, nor is it considered to be investment advice.

ICE DATA AND ITS SUPPLIERS DISCLAIM ANY AND ALL WARRANTIES AND REPRESENTATIONS, EXPRESS AND/OR IMPLIED, INCLUDING ANY WARRANTIES OF MERCHANTABILITY OR FITNESS FOR A PARTICULAR PURPOSE OR
USE, INCLUDING THE INDICES, INDEX DATA AND ANY INFORMATION INCLUDED IN, RELATED TO, OR DERIVED THEREFROM (“INDEX DATA”). ICE DATA AND ITS SUPPLIERS SHALL NOT BE SUBJECT TO ANY DAMAGES OR
LIABILITY WITH RESPECT TO THE ADEQUACY, ACCURACY, TIMELINESS OR COMPLETENESS OF THE INDICES AND THE INDEX DATA, WHICH AREPROVIDED ON AN “AS IS” BASIS AND YOUR USE IS AT YOUR OWN RISK.

Apple® is a registered trademark of Apple, Inc. Facebook® is a registered trademark of Facebook, Inc. Amazon® is a registered trademark of Amazon Technologies, Inc. Netflix® is a registered trademark of Netflix, Inc.
Google® is a registered trademark of Google, Inc. Alibaba® is a registered trademark of Alibaba Group Holding Limited. Baidu® is a registered trademark of Baidu.com, Inc. Nvidia® is a registered trademark of Nvidia
Corporation. Tesla® is a registered 11 V. 20 Nov 2019 trademark of Tesla, Inc. Twitter® is a registered trademark of Twitter, Inc. S&P 500® is a registered trademark of Standard & Poor's Financial Services LLC. NASDAQ-
100® is a registered trademark of NASDAQ, INC. None of the foregoing entities are affiliated with, endorsed by, or sponsored by Intercontinental Exchange, Inc., or any of its subsidiaries or affiliates, and the inclusion of the
entities on our web site does not evidence a relationship with those entities in connection with the Index, nor does it constitute an endorsement by those entities of the Index or NYSE.
T H A N K YO U
You can also read