Or just BIG Numbers? Tanzania & Extractives - Transformation - Alan R. Roe Presentation to REPOA/WIDER Conference - unu-wider
←
→
Page content transcription
If your browser does not render page correctly, please read the page content below

Tanzania & Extractives ------ Transformation
                         or just BIG Numbers?

                     Alan R. Roe
              UNU-WIDER and University of
                     Warwick

     Presentation to REPOA/WIDER Conference
 Transformation for Growth, Employment and Poverty
                      Reduction

         Dar es Salaam - November 28 2016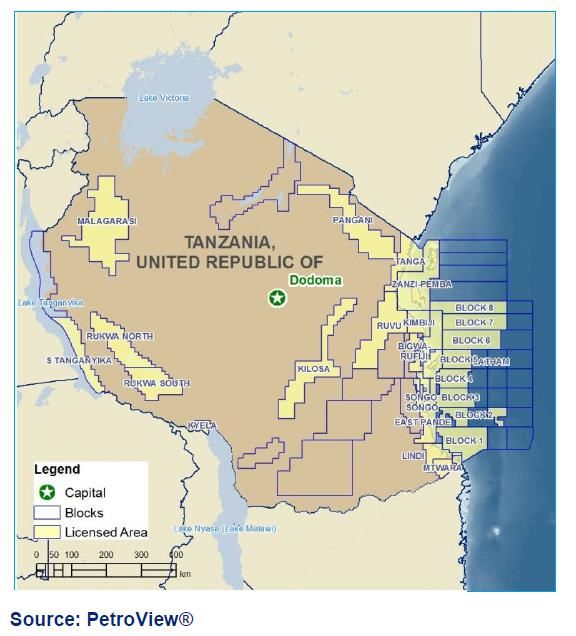
Outline

1. Introduction: Economic Transformation: always the objective

2. Gold Mining 1998-2010: the 1st opportunity

3. Outcomes: Why the disappointments?

4. Natural Gas 2014 onwards : the 2nd opportunity

5. The short-terms benefits: near shore gas

6. Longer term: deep-water off-shore gas

7. Policy challenges
1. Introduction

•   The First Five Year Plan 1964 -1969 targeted:

     •   Reduction Primary Production share: from 60% to 39% by 1980
     •   Increase in Industrial Activities share (Manufacturing, construction)
         from 13% to 27% by 1980 (Table III)

•  BUT 50 years later as the UN Human Development Report 2014 notes
   the share of industry has increased from 18% in 2001 to only 22.1% in
   2012. Within this overall increase:
    • Mining’s share rose : 1.8% of GDP in 2000 to 3.3% by 2010
    • Construction’s share rose: 8.2% of GDP to 10.8% by 2010
    • Manufacturing’s share remained constant at around 8 %
    • Low productivity rural activities including services remain the
       dominant sector
• Some transformation – Yes but “Tanzania’s impressive economic
  growth in the last decade has failed to translate into meaningful
  improvements in human development.” (UNDP pg xiii)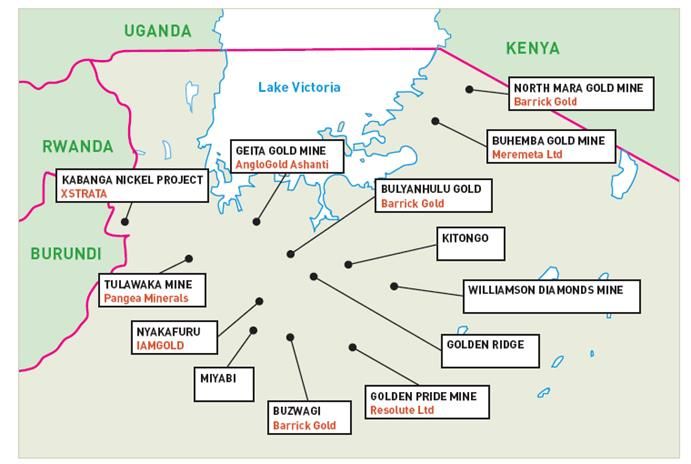
www.icmm.com
2. Gold mining – 1998 to 2012 – the first opportunity

• Progress from 1964 onwards in changing the basic structure of the
  Tanzanian economy in the manner envisaged by Julius Nyerere and
  other leaders had been consistently disappointing for more than 30
  years
• But there signs of change from the end of the 1990s when gold and
  diamond investments resurged
• As a result from 2000 MINERAL PRODUCTION rose very rapidly
• In terms of EXPORT composition the changes were also dramatic and
  were almost entirely associated with minerals (gold and diamonds)
• In terms of GDP – there was also a visible change to an increased
  share of Mining and Manufacturing
Review some of the Facts behind these
            statements
Foreign direct investment surged (Source: UNCTAD)
UNCTAD World Investment Report 2014
data tells us that:
Tanzania is already a leading non-oil
destination for FDI in Africa after South
Africa
FDI flows of $10 million or less per
annum in the 1990s have grew ONE
HUNDRED-FOLD to over $2,000 million
per annum by 2013 as gas investments
also materialised!
A large percentage of Tanzania’s
total FDI stock > $10 billion is
associated with minerals and more
recently oil and gas.
GDP - No Structural change 1965 to end 1990s
      but some visible movement thereafter

Sector Shares since 2000            2000   2001   2002   2003   2004   2005   2006   2007

       MINING                        1.5    1.8    2.1    2.4    2.6    2.9    3.2    3.5

                                    100.   100.   100.   100.   100.   100.   100.   100.
       Total GDP                      0      0      0      0      0      0      0       0
       Monetary GDP                 83.9   83.9   84.2   84.4   83.6   84.1   84.5   84.8

       All Agriculture (Monetary)   18.2   17.7   17.5   17.4   17.2   16.2   15.3   15.1
       Crop Husbandry               13.0   12.7   12.7   12.6   12.5   11.5   10.6   10.7
       Other Agriculture             5.2    5.1    4.8    4.8    4.7    4.7    4.6    4.3

       All Industry, Mining and
       Construction                 16.9   17.0   18.7   20.1   19.9   19.7   19.6   19.9
       Manufacturing                 8.8    8.4    8.3    8.3    8.1    7.9    7.8    7.8
       Other Industry and
       Construction                  6.7    6.9    8.3    9.5    9.3    8.9    8.6    8.6

       Services                     41.6   41.7   40.5   39.3   38.8   39.1   40.0   40.2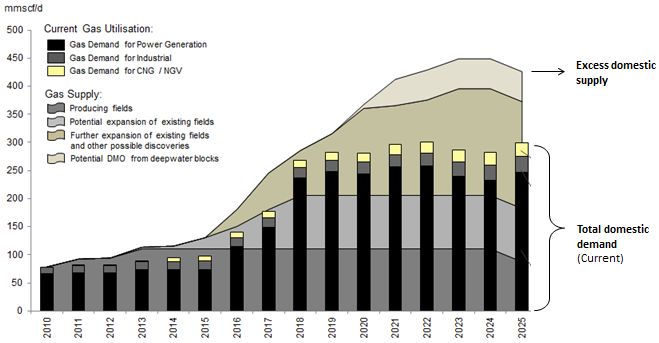
Sustained gains in per capita incomes followed
Per capita income gains 1950 to 2007
After 2000: a visibly 12%
more successful pattern of 10%
income growth
8%
Since 2007: – growth has
remained consistently high 6%
and positive (c. 7% 0r 5% 4%
per capita) 2%
Result: The Tanzanian 0%
people have fared much
1
3
5
7
9
1
3
5
7
9
1
3
5
7
9
1
3
5
7
9
1
3
5
7
9
1
3
5
7
195
195
195
195
195
196
196
196
196
196
197
197
197
197
197
198
198
198
198
198
199
199
199
199
199
200
200
200
200
better since the 1996
-2%
reforms (including of -4%
Tanzania
mining) than in most other
Founded
-6% New Mining
periods of post-
Codes
-8%
Independence history
Source: Angus Maddison and University of Groningen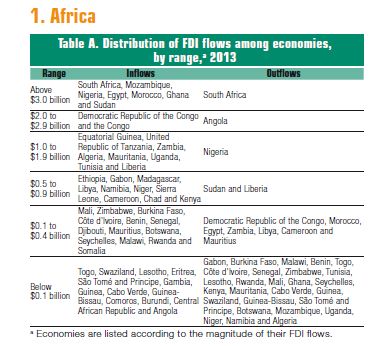
Also a big increase in government revenues

•   GOVERNMENT REVENUE
    from Mining had to 2008        Predicted revenue from 5 major mines to 2034
    been very low – and was
    much criticised (e.g. in
    Golden Opportunity Report -
    2008 )
•   but by 2010 the natural life
    cycle of production and
    revenue-take was already
    moving that revenue-take
    from only $20 million (2% of
    total tax revenues) rapidly
    upwards
•    By 2011/12 the TEITI was
    reporting mining tax
    revenues of $390 million
    which was then around 10%        Source: ICMM –Mining: What future can we expect, 2008
    of government total
    revenues
Exports: Gold overtook traditional exports by 2000
($ million)
1000
900 Gold
Coffee
800 Cotton
Tea Note:
700 Tobacco
Cashew The radical
600
differences between
500 1999 and 2008 –
400
sustained through
2013
300
200
100
0
1999 2000 2001 2002 2003 2004 2005 2006 2007 2008…a tendency sustained to 2012 before falling away
(Source IMF 2014 and 2016)
Gold exports of circa $1.7 billion in 2013/14 fell to $1.2 billion by
2015/16 but gold is still equal to the total exports of all traditional
agricultural products3. Outcomes: why the disappointments?
• So BIG numbers BIG opportunity – but outcomes disappointing – WHY?
• UK and North Sea Oil
• Bulyanhulu and Buzwagi (gold and diamond mining communities – Geita and Mwadui
mines)
• Incomes had increased but local inflation higher
• Jobs had been created but much inward labour migration had lessened benefits
to local populations.
• Health services better but unequal access created sense of greater inequality
• Bigger strain on local public services with no compensating gains in local public
revenues
• Some gains in nutritional status for children
• So no universal condemnation of the mining companies but no obvious sense that
inclusive growth had been fostered by arrival of miningSome in Tanzania understood the opportunity
very well
Judge Mark Bomani (Report of the Presidential Committee to Review and Advise
Government on Management of the Mineral Sector 2008) recommended several
improvements in policy, including:
• Greater recognition of shared responsibilities of the government working WITH mining
companies to support infrastructure in mining areas covering roads, electricity, water
and social services such as village dispensaries, schools and security services.
• Better integrating compensation systems (e.g. for resettlement) with the needs of both
the local communities and the mining companies to, for example ensure new business
start-ups for development based around mines
• Improved training: tighter requirements on companies but also more systematic
government-driven arrangements, including larger budgets for existing other training
institutions.
• Mining towns – their development has been haphazard- the government should work
more closely with the companies to plan and monitor the development of these towns.
• Improved policies and programmes to help strengthen any sector working closely with
the mining sector to capture ‘the immense benefits that the growing mining industry
provides’.
• A better share of mineral revenues to local areas (Ghana-style)The obvious(?) planning challenge
Multi million dollars of new private Major mine locations in Tanzania in 2008
investment in contiguous areas was
surely the basis for systematic
planned development!
- What are now being called
Resource Corridors or Spatial
Development Initiatives (SDIs)
examples include Maputo
Development Corridor and
Simandou Integrated Mining and
Infrastructure project
But in the event Tanzanian policy
put all its efforts into one other of
the Bomani recommendations – a
reform of the royalty system.
- With the benefit of hindsight – not
a priority4. Natural Gas 2014 onwards : the 2nd
opportunity
What will this, can this do for the economy?
TWO Answers:
1. Short-term: Onshore or near shore gas discoveries - new
energy-generation possibilities
2. Longer-term: Deep offshore discoveries – new export revenues
and new industries?Oil and Gas in Tanzania
• Tanzania currently has no commercial OIL discoveries
• but there are at least 4 small producing or imminently producing
GAS fields (Songo Songo – since 2004, Mnazi Bay –since
2015, Killwani North (Aminex) and Ruvu Basin (Dodsal of UAE)
– both from 2016.
• Songo Songo is quite small and took decades to bring to
commercial production – partly due to
• The limited local market
• the impracticability of export (in view of the apparently
limited reserves)
• In this context more recent gas developments in Mnazi Bay
(since 2015) are significant and already delivering
• In addition, there are now much larger, very promising gas
discoveries (but less imminent for production) in the deep Indian
Ocean: offshore blocks have been licensed by the government
to BG, Statoil, Petrobras, Shell and to other international
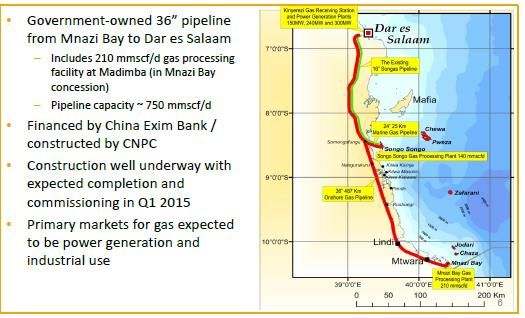
companies.New gas – initial stage development – from 2015
(Source: Wentworth Resources Ltd.)5. Short-term benefits 1. They have justified the building of a new high capacity $1.2 billion gas pipeline from Mnazi Bay to Dar – financed by China Exim Bank. This will have substantial capacity – greater than that supplied by the early stage gas 2. The 2015 Gas Sales Agreement (between the producer and TPDC) involves a gas selling price at Mtwara of $3.07 per mcf allowing TPDC to sell that gas to TANESCO in Dar at around $5.00. This should allow TANESCO to generate power at nearer 12c/kwh rather than current cost of power generation of around 35c/kwh - using emergency power (diesel fuel, jet fuel etc). 3. On this basis with TANESCO previously selling power to their consumers at around 16c/kwh, the huge Tanzanian government subsidy to TANESCO will be (has been) significantly reduced (Tsh 399 billion 2013/14 – 0.5% of GDP – equivalent to 4% of total government revenues. 4. The producers have financed part of their investment cost locally and this will be a good early stage loan for the restructured Tanzanian Investment Bank (TIB)
Gas Supply and Demand – uses 2010 to 2025
    (anticipated)

•   Production from Songa Songa = < 100 mmscf/d
•   From 2015 – Mnazi Bay Concession Partners (Maurel et Prom and
    Wentworth) will add 80 mmscf/d rising to 130 mmscf/d by 2016/17 (GSA):
•   From late 2016 - Aminex at Killwani North expects circa 20-30 mmscf/d (via
    Songa Songa) and Dodsal Ruvu Basis is also coming
•   So by 2018, enough gas to meet a substantial part Tanzania’s rising needs
    for energy generation and at lower costs.
Plus some new industrial opportunities
Already we see in 2016 at least some major industrial spin offs
• A huge $500 million investment in Cement Production at Mtwara by Dangote
Cement (from W. Africa) which:
• will create many hundreds of additional jobs
• $500,000 social investment committed to the Mtware community
• will use cheap gas from Mnazi Bay to power its own energy generation
• will gear it up to provide to meet the huge growth in demand for cement
from the further gas investments post 2018
• will reportedly make Tanzania self-sufficient in cement even as demand
rises
• Commitment to establish a large Industrial Park as part of the agreement to
provide land for the use of the BG/TPDC plant for LNG near Lindi
• Other important industrial investments seem likely once the deep-water gas
begins to produce (see later slides)Big Results Now – 5 million more Tanzanians
with electricity
Generation Transmission Distribution
7 new plants 7 new lines 590,000 new connections
~5 million more
1,310 MW in new 3100 km of new
people with electricity
capacity high voltage lines
access
14,000 GWh of 236 kWh/capita of
annual energy annual energy 30% electrification access
generated delivered
SSMP I & II
Mwanza (HFO) Backbone Backbone Tx (BTIP)
Pending/new Customer
Kinyerezi I Dar-Arusha Mini Hydro
Applications
Projects Kinyerezi II Singida-Arusha ORIO
Urban Network
planned Kinyerezi III Somanga-Kinyerezi Electricity V
Expansion
for Kinyerezi IV Makambako-Songea TAZAMA Fuel Pump
Underline Distribution
delivery Singida Geo Wind Ph.1 North West Grid Phase1 Grid Extension
Bulyanhulu - Geita Tx line
Kilwa Energy Ph.1 Dar-Dodoma (Turnkey Phase 2)
projects
Low Cost Design
Electrification of Health &
Education facilities in
rural areas
SOURCE: Energy lab6. The longer-term and deep-water offshore gas
This gets most of the headlines
– huge sums involved
Blocks 1,3 and 4 = BGG
(British Gas Group)- now
Shell/Ophir
Block 2 = Statoil
Blocks 5.6 and 8 = Petrobras
(some with Shell)
Blocks 9,10, 11 and 12 = Shell
( into Zanzibar waters)BG concessions - offshore deep-water gas
Sixteen successful
wells identified by
BGG
1,400 metres of water
2,000 metres below
the seabed
24BG project assumptions (some from PSA)
Two-train LNG liquefaction plant onshore
Assumed 5% minimum domestic market obligation
Assumed TPDC takes 12.5% equity on behalf of GoT
Key Assumptions Production Price
(MMTpa) (US$/mmBtu, fob)
High price scenario 7.4 13.00
Low price scenario 7.4 8.00
25Project timeline
Final
Investment
Decision
Planning Construction Operations De-
commissioning
several 4–5 20–30 2–3
years years years years
Exploration, Construction Production, Closure of
commercial of pipelines, liquefaction operations
evaluation building LNG and export and
and design plant of gas remediation
26Likely macroeconomic impacts • Investment (Foreign Direct Investment) • Exports • Government Revenue • Jobs • Domestic Gas Supply
A potentially huge investment outlay ($ billion)

                                Total investment
                                cost (upstream and
                                midstream) > $20
                                billion
……will result in a large export expansion (LNG)
US$bn
Total exports 2013/14 = $5.6 billon (remember
mining exports that year = $1.7 billion
6
High price: Exports = $5bn
4
Low price: Exports = $3bn
2
0
Year 0 Year 5 Year 10 Year 15 Year 20 Year 25 Year 30
29…..and via the PSA an early boost to
government revenues
% of GDP Construction Operations
6%
Budget deficit incl grants (5.2%
5%
of GDP in 2013/14)
4%
Grants (3.3 % of 2013/14 GDP)
3%
Government revenue
2%
1%
0%
Year -10 Year -5 Year 0 Year 5 Year 10 Year 15 Year 20 Year 25 Year 30
30$.5 b
$1. b
$2. b
$. b
$1.5 b
Year -10
Year -9
Year -8
Annual charges
Year -7
Year -6
Year -5 Government profit share
Year -4
Year -3
Year -2
Year -1
Year 0
Year 1
Year 2
Year 3
Year 4
Year 5
Royalties
Year 6
Year 7
Year 8
Year 9
Personal income tax
Year 10
Year 11
Year 12
Year 13
Year 14
Year 15
Year 16
Year 17
Year 18
Year 19
Year 20
Year 21
Year 22
Year 23
…… part of early revenues are from PSA
production share (channelled via TPDC)
Year 24
Year 25
Year 26
Year 27
Year 28
Year 29
Year 30
Corporate income tax- Local contractors
Year 31
Corporate Income Tax and WHT- BG & TPDC…….but direct JOB creation is mainly significant
in the construction phase
Planning Construction Operations
several 4–5 20–30
years years years
Hundreds Thousands of Hundreds of
of jobs direct jobs direct jobs
Construction Industrial
skills policy and
training the supply
chain
32Ranking of possible uses of gas
Maximum input prices and projected volumes
US$/ Residential Gas volumes
mmBtu Commercial CNG LNG Fertiliser Power Methanol GTL
10 (2mmsc/d) (1 mmsc/d) (1,000mms
(60mmsc/d)
(70 mmsc/d) )(160mmsc/d) (700mmsc/d
c/d)
9 – 10
$/mmBtu
8 1,000 mmsc/d
8–9
$/mmBtu
6
7–8
$/mmBtu 750 mmsc/d
5–6
4 $/mmBtu 5–6
$/mmBtu
4–5 500 mmsc/d
$/mmBtu
2
3–4
$/mmBtu
250 mmsc/d
0 50 mmsc/d
0 2 4 6 8 10 12 14
33But the capital cost of different possible uses
also vary widely
Expanding Existing Uses:
1. Power $500 million for c. 540 MW – Usage 250mmsc/d by 2025
2. CNG/NGV $Gas is key to these desired outcomes
Generating
Gas volumes
capacity Kinyerezi: New gas- mmscuf/d
MW fired capacity 250
2,500
DMO 200
2,000 IV
IV
III
150
1,500 III
II Kinyerezi: Songo
I New gas Songo
demand II expansion
1,000 100
I
Current 50
500 gas in
Estimated total installed
generating capacity – all power
energy sources generation
0 0
2013 2014 2015 2016 demand & supply post-2020
projections
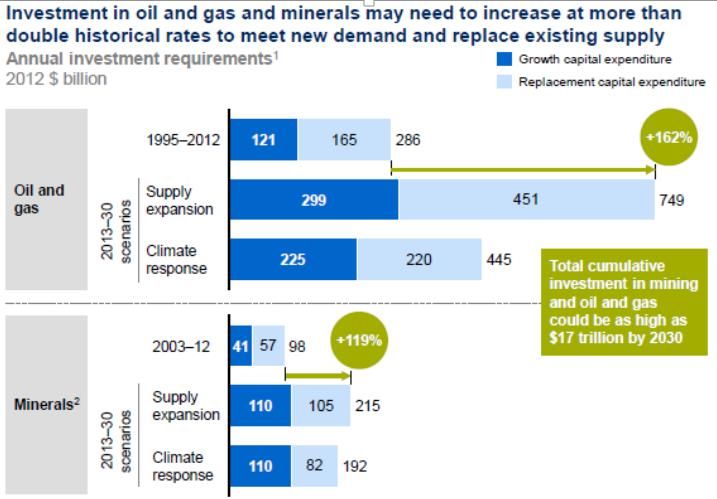
357. The policy challenges Tanzania shares these challenges with many other countries: • Still growing global demand for minerals, oil and gas: the climate change agenda notwithstanding • Sources of supply increasingly in low and middle income countries • So large future investments to be expected (Source: McKinsey G I)
New WIDER Project: Extractives and Development

• Launched November 2015
• Highly relevant to Tanzania and so the REPOA programme
• Coordinated by Tony Addison and Alan Roe
• Broad-ranging agenda of research issues from the role of extractives in
  the new industrial policies (Linn, Stigliz, Rodrik et al), through
  macro/revenue management and international initiatives (e.g. EITI and
  Natural Resources Charter) to community level management)
• 34 authors so far recruited from industry, government, regulators,
  international agencies, academics
• Web site up and running – see www.wider.org/e24
• First 10 Working Papers to be uploaded in next few weeks
Can Tanzania become an oil and gas economy?

Technical constraints:
Numerous difficult technical problems to solve in extracting gas from several
miles into the Indian Ocean under 1,400 metres of water and a further 2,000
metres of variable sea bed strata

Commercial Constraints:
1. For the Companies – can they justify the huge upstream and mid stream
   investments given their (changing) expectations of the global market (e.g.
   for LNG)?
2. For the Government and TPDC – can they finance the very large
   infrastructure and supporting investments needed to ensure the delivery
   and effective usage of the available gas (and oil)? WHO will coordinate?
3. Will the global demand and supply situation remain favourable to
   exploiting the Tanzanian resources?
Critical Issues to be managed to support
                  transformation this time

• Expectations management: A communications strategy is needed
  immediately to manage expectations in government, in the affected local
  communities and in the country more generally.
• Skills development: More needs to be done to develop skills in both the
  private and public sectors. Although few direct jobs will be created there are
  very large opportunities for indirect job creation through linkages to the rest
  of the economy.
• Public sector capacity: This is currently weak in the area of contract
  negotiation, regulation of the sector, contract management, and
  management of the fiscal regime.
• The reformed National Oil and Gas company (TPDC) – its financing, its
  specific roles, building its capacities
• Infrastructure development: Government revenues from the gas sector
  must be used in part to build the infrastructure needed to attract investment
  in other areas - a real – but difficult - opportunity to diversify the economy
  and contribute to industrialisation
…….Continued
• Macro-economic and revenue management: The government needs to
exercise caution on the macroeconomic fundamentals to avoid exchange
rate appreciation and damage to traditional export activities. (the Dutch
Disease problem)
• Sovereign wealth fund: Should there be one?
• Stabilization arrangements – against volatile prices: should these be
set up?
• Inclusive growth: ensuring that no sector is left behind: The
government needs policies/strategies to ensure that other sectors of the
economy are not left behind. Much of the emphasis must lie in skills and
knowledge and the government should focus on building human capacity in
all sectors.
• Transparency and good governance: Tanzania is fortunate to discover
gas now. They can learn from lessons from other countries on the
importance of transparency and good governance.
• Above all the politics of the situation: how to protect this unique
opportunity from political opportunism and mismanagement !Tanzania & Extractives ------
Transformation or just BIG Numbers?
Many thanks
Questions and comments to Alan Roe
alan.roe@opml.co.ukYou can also read