"Disciplined Liquids Development in Four Prolific Core Areas" - Investor Presentation - Advantage Oil & Gas LTD.
←
→
Page content transcription
If your browser does not render page correctly, please read the page content below
“Disciplined Liquids Development in Four Prolific Core Areas”

Investor Presentation      TSX: AAV             November 2019
ADVANTAGE AT A GLANCE
TSX 52-week trading range $1.35 - $3.46
Shares Outstanding (basic) 187 million
Market Capitalization $0.4 billion
Enterprise Value $0.7 billion
Advantage Montney Assets
2019 Guidance (1)
Total Production 43,500 to 46,500 boe/d
Liquids Production (~100% Increase vs 2018) 2,900 to 3,200 bbls/d
Progress
Glacier
Q3 2019 Production Valhalla
Total Production 42,080 boe/d
BC AB
Liquids Production 3,142 bbls/d Pipestone/
Wembley
6 Miles
Notes:
(1) Forward-looking information. Refer to three year development plan (November 1, 2018 and Advantage holds 134,400 net acres (210 net
July 8, 2019 news releases) and Advisory for material assumptions and risk factors. sections) in the condensate/light oil-rich
Montney Glacier/Pipestone fairway
2
BUILDING ON FOUNDATIONAL ASSETS, TRANSITIONING TO TOP-TIER LIQUIDS

                     Solid Today                                                             Solid Tomorrow

                                                                                   Reinvest in Our High Return
       Free Cash Generating Asset
                                                                                   Liquids Assets
                                                                                   Retain Competitive Edge with
       Ultra-Low Costs                                                             Commanding Infrastructure
                                                                                   Minimal Commitments and Self-
       Financial Strength & Flexibility                                            Funding Program
                                                                                   Revenue Diversification to
       Exposure to AECO <                  20%(1)                                  Continue by Increasing Liquids
 (1)   Forward-looking information. Percent of forecast revenue expected to be exposed to AECO in 2019 & beyond. Refer to three year
       development plan (November 1, 2018 and July 8, 2019 news releases) and Advisory for material assumptions and risk factors.

                                                                                                                                       3
COMMITMENT TO ENVIRONMENTAL LEADERSHIP AND SUSTAINABILITY
                                                  “A Proud         Clean Energy Producer – The World Needs More of Our Energy”

                                                                CO2 Sequestration                                             Plant Flared Volumes as Percent of
                                                             (tonnes CO2e accredited)                                                     Production
                                                                                              90,367                                                 Improved operating efficiencies and
                                                                                                                        0.34%
                                                  90,000 tonnes CO2e equates to                                                           0.30%       lower emission equipment design
                                                    approx. 20,000 vehicles (1)
                                                                                                                                                           0.22%
                                                                   57,410        56,999                                                                                     0.14%
                                         47,393
                                                        40,853

                                          2014           2015        2016         2017            2018                    2015             2016              2017           2018

                                                     Non-Producing Wells vs LMR                                  • Natural gas is the fastest way to reduce
 Non-Producing Net Wells (AIF 2018)

                                      5,000                                                                        CO2 emissions – by displacing coal
                                                                            Ultra-low liability
                                      4,000                                     exposure                         • Created 650 full-time jobs/year over the
                                                                                                                   last 5 years
                                      3,000
                                                                                                                 • Contributed >$1 million to community
                                                                  Advantage
                                      2,000                                                                        programs since inception
                                      1,000                                                                      • Fully reclaimed equivalent of 60% of
                                                                                                                   legacy Advantage field sites to date
                                         0
                                              0            10           20            30             40          • See Sustainability Report on AAV website
                                                                 LMR (Jan 2019)          (1) Based on estimates per Environmental Protection Agency emissions per vehicle            4
                                                                                         (2) LMR – Liability Management Ratio as determined by Alberta Energy Regulator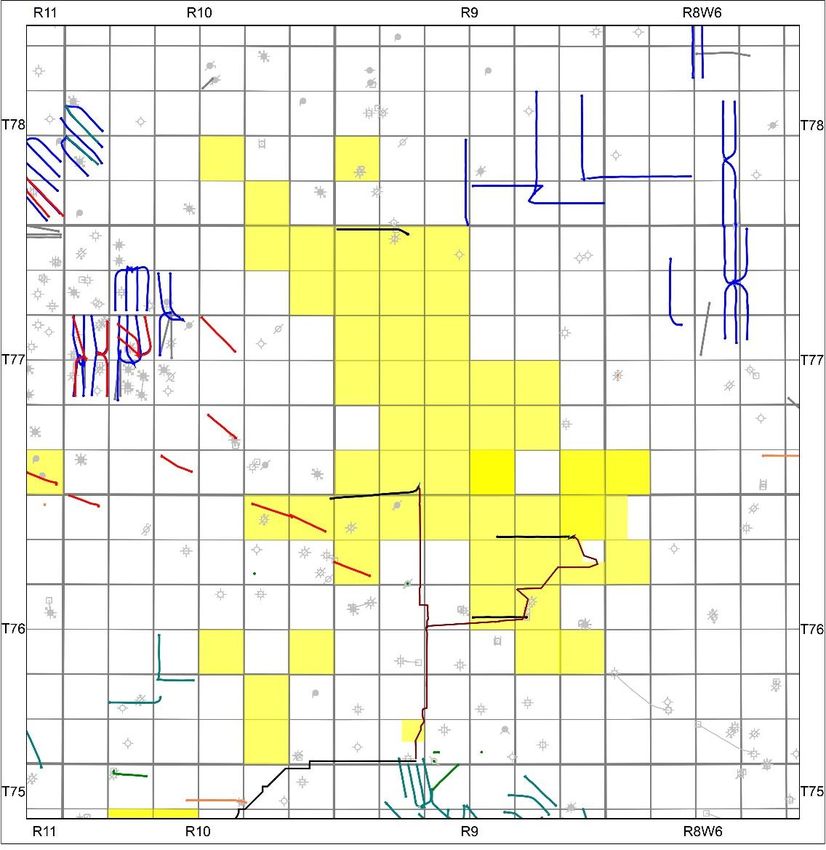
LIQUIDS DEVELOPMENT PROGRAM OBJECTIVES

Total Revenue Diversification                                               Value Enhancement (1)
         >50% Liquids by 2021
                                                                            • Transition to >50% liquids revenue
                                                                              (condensate/light oil)
   20%                                            Liquids
                39%                               Midwest US                • Double digit Adjusted Funds Flow
    9%                           53%                                          (“AFF”) per share growth
                                                  Dawn
   12%                                            Fixed Price               • Double digit return on capital
                                                  Empress                     employed
                17%
                                                  AECO
   39%                           16%                                        • Generates significant free cash &
                                                Well Diversified
                19%                                                           maintains Total Debt to AFF ~2.0x
                                                 Natural Gas
                                                  Portfolio
                                 16%
                8%                                                          • Preserves low cost structure
                2%
   20%
                15%              11%                                        • Develops significant AFF from
                                 4%                                           Wembley, Progress & Valhalla in
   2019E       2020E           2021E                                          addition to Glacier

                  Notes: (1) Forward-looking information. Refer to three year development plan (November 1, 2018 and
                             July 8, 2019 news releases) and Advisory for material assumptions and risk factors.       5
LIQUIDS DEVELOPMENT UNDERPINNED BY TOP TIER ASSETS (1)

                                                                                              Condensate & Light Oil Focused
                                                              6 miles                     • Glacier asset generating free cash
                                               Progress
                                                                                          • Significant oil pool discovery at
                                                                                            Progress
   Glacier                                                                                • Liquids development underway
   ‘The Foundation’                                                                         in all land blocks
                                        Valhalla
                                                                                          • Utilize 3rd party gas processing for
                                                                                            initial Pipestone/Wembley wells
BC AB                                                                                     • Two 5,000 bbls/d liquids hubs at
                           Multi-zone                                                       Pipestone/Wembley and
                                                               Pipestone/                   Progress to be constructed (100%
                        Premium Liquids                         Wembley
                         Development                                                        working interest)
                        Throughout the
                            Fairway                                                       • Existing spare processing capacity
                                                                                            at Glacier Plant to accommodate
                                                                                            growth at Progress and Valhalla
               (1)   Forward-looking information. Refer to three year development plan (November 1, 2018                        6
                     and July 8, 2019 news releases) and Advisory for material assumptions and risk factors.
OPERATIONS OVERVIEW – SHIFTING TO MIDDLE MONTNEY LIQUIDS

                                                       Deep Liquids-Rich Inventory (1)(2)(3)
                                                              Booked Undeveloped           Unbooked          Upside

                      Progress
                                                TOTAL future
                                                location inventory
    Glacier                                     ~1,400 to 1,500
                                                                                    697

                 Valhalla
                                                         70

                                 Pipestone/             216                                                      244
                                                                                    129                                      11
                                 Wembley
                                                  100 bbls/mmcf

                                              • Total of ~210 net sections (134,400 net acres)
                                              • Middle Montney is liquids-rich throughout (25 to 280
                                                bbls/mmcf)
                                              • Only 75 liquids-rich wells drilled to date – 6% of inventory
Liquids-rich
                                              • 100% Ownership of Glacier Gas Plant
Middle Montney
                                                  • 400 mmcf/d raw gas capacity, 6,800 bbls/d liquids
                                                    handling
                                                  (1) Management    Estimates. Refer to Advisory.
                                                  (2) Based on Sproule December 31, 2018 Reserves Report.
                                                  (3) C + shallow cut recoveries.                                            7
                                                       3
ADVANTAGE MONTNEY – MULTIZONE DEVELOPMENT THROUGHOUT

                                                                            Wembley
                                                                          primary target
                              Valhalla liquids
                             appraisal targets

           Glacier liquids
               zones                             New oil pool discovery

                                                                                           Advantage Operated HZ
                                                                                           Offset Operator HZ

                                                                                                             8
WEMBLEY/VALHALLA (PIPESTONE) LIQUIDS RICH DEVELOPMENT

                                                                                                                      •      71 net sections in the premium, multi-
                                               Recently completed D3 Well
                                                                                                                             layer, liquids fairway
                                                   30% liquids (IP30)
                                                                                                                      •      Valhalla wells are tied into AAV Glacier
                                                                                                                             Plant to the West
                                        Valhalla                                                                      •      Wembley wells will flow South to
 New 5 well pad                                                                                                              Tidewater and Keyera plants
 7,117 boe/d
 (22% liquids)(1)
                                                                                     Competitor well                  •      Seven Wembley wells planned for Q3/Q4
 Confidential competitor well                                                       IP30 1,422 boe/d
 (~41% oil, NGL not available)                                                       (67% liquids) (4)
                                                                                                                             2019, plus one water disposal
 Confidential competitor well
 (~44% oil, NGL not available)                                                                  AAV 12-25             •      Wembley area continues to show
                                                                                               (62% liquids)                 predictable, top tier results across the
                                                                                                                             fairway (150-300 bbls/mmcf)
                                             Pipestone/Wembley
                                                                                                   4 well pad
                                                                                                     drilling         •      Valhalla showing similar results, though
                                                                                                                             earlier in development
                                                                                                                          Half-cycle Economics(2)(3)
                                                                                                                          (AECO Cdn $2.00/mcf & $US 60/bbl WTI)

                                                                                                                          Rate of Return %                  Payout Years                Breakeven(3)
                                                                                                                          >90%                              1.3 - 1.4
SIGNIFICANT LIGHT OIL POOL DISCOVERY AT PROGRESS

                                         Kelt Oil Wells           Tourmaline Oil Wells
                                    Up to 153,000 bbls CTD       Up to 152,000 bbls CTD

       13-31 Montney D1 (2017)
                                                                                            • 50 net sections assembled at low cost
                                                                                              over 5 years
                                                                                            • Appraisal drilling began in 2017
                                                                                            • 4 Advantage wells drilled to date
                                                                                            • Recent advancement in frac design at
 16-36 Montney D3 (1)                                                                         16-36 resulted in >1,000 bbls/d oil rate(1)
 1,038 bbls/d oil
 290 bbls/d NGL
                                                                                            • Recent pressure data indicates majority
 4.9 mmcf/d gas
                                                                02/2-34 Montney D3 (2018)
                                                                                              of lands are over-pressured
                                                                                            • Pipeline to AAV Glacier Plant to be
                                                                                              constructed November 2019

                                                                                              Progress oil wells are expected to
                                                               5-22 Montney D3 (2018)
                                                                                                    be competitive with
                                               Tie in to AAV
                                               Glacier Plant
                                                                                                    Wembley/Pipestone

                        (1) Average rate at 5,168 kPa over 72 hours at end of frac flowback and production test. Entrained NGLs calculated using composition
                            from 02/2-34 well and shallow-cut recoveries. Production rates were continuing to increase prior to the well being shut in due to
                            flare limitations. Preliminary results are not necessarily indicative of long-term performance or of ultimate recovery.             10
LIQUIDS-RICH MIDDLE MONTNEY AT GLACIER STEPPING UP
• Early development was in Upper and Lower
Q1 2019 10 Well
Middle Montney Pad – Montney (lean gas)
Average Final Rate 422
bbls/d (73 bbls/mmcf) • Recent focus on Middle Montney, where liquids
range from 25 to 80 bbls/mmcf
• 89 net sections
• 750 well inventory (4), including 480 liquids-rich
• Low costs = resilient netbacks
• IP30 well liquids rates up to 400 bbls/d
Half-cycle Economics(1)(2)
(AECO Cdn $2.00/mcf & $US 60/bbl WTI)
Q4 2018 5 Well Middle
Montney Pad – Average
Breakeven(3)
Final Rate 428 bbls/d per Rate of Return % Payout Years (AECO Cdn $)
Well (85 bbls/mmcf)
40% - 90% 1.4 – 2.2STRATEGIC INFRASTRUCTURE CONTROL, FLEXIBLE PIPELINE ACCESS
100% Owned Glacier Gas Plant –
400 mmcf/d Raw Gas + 6,800 bbls/d C3+ Liquids Extraction
TCPL Groundbirch
Lateral
BC AB Advantage Glacier
Gas Plant
Future AAV Progress
Liquids Hub
AAV Liquids Handling Hub Keyera
2,000 bbls/d Pipestone Plant
• NGTL sales gas firm transportation service in-place.
6 miles
Connection to Alliance pipeline completed.
Company Land
• >100 mmcf/d surplus capacity available at Glacier Plant Company Gas Plant
3rd Party Gas Plants
TransCanada Pipeline
• Pipeline to tie Progress in to AAV Glacier Plant to be Pembina Pipeline
Advantage Pipeline Tidewater AAV Wembley Liquids Hub
constructed by November 2019 Alliance Pipeline Pipestone Plant 5,000 bbls/d Q2-2020
Tidewater Pipeline
• 3rd Party processing secured to match early
Pipestone/Wembley growth profile
122019 GUIDANCE AND ESTIMATES (1)(2)
Average production (boe/day) 43,500 - 46,500
Gas production (mmcf/d) 244 to 260
Liquids production (bbls/d) 2,900 to 3,200
% Liquids / % Condensate/light oil 7% / 76%
Royalties ($/boe) and Royalty Rate (%) $0.40 (3%)
Operating Cost ($/boe) $2.00
Transportation Cost ($/boe) $3.40
G&A/Finance Cost ($/boe) $1.50
Cash Used in Investing Activities (4) (millions) $180 to $200
Net Capital Expenditures (3)(4) (millions) $180 to $200
Notes:
(1) Forward-looking information. Refer to Advisory for cautionary statements regarding Advantage’s budget and three-year development plan including
material assumptions and risk factors.
(2) Refer to Three Year Plan news release dated November 1, 2018 and 2019 capital expenditure guidance in news release dated July 8, 2019.
(3) Non-GAAP Measure which may not be comparable to similar non-GAAP measures used by other entities. Refer to Advisory.
(4) Net Capital Expenditures is the same as Cash Used in Investing Activities as no change in non-cash working capital is assumed between years and
other differences are immaterial.
13THREE YEAR DEVELOPMENT PLAN – LIQUIDS TRANSITION(1)
Total Production (boe/d) Liquids Production and 14,000 bbls/d
Exit
Composition (bbls/d) 10,500 to
48,500 to
46,000 to 52,500 11,500
43,500 to 48,000
46,500
22% 6,500 to
7% 15%
7,500
2,900 to
C5+ /
78% light oil
3,200
76%
76%
2019G 2020E 2021E 2019G 2020E 2021E
Gas Liquids % of Total
Costs ($/boe) Three Year Development Plan
$1.55 • Capital program calibrated to maintain
$1.60
G&A and
$1.50 strong balance sheet
Finance $3.65
$3.55 • Flexibility exists to manage gas production
Transport $3.40 with minimal impact on adjusted funds
$2.95 flow
$2.60
Operating $2.00
$0.40 $0.75 $1.20
Royalties
2019G 2020E 2021E
Notes:
(1) Forward-looking information. Refer to three year development plan (November 1, 2018 and July 8, 2019 news releases) 14
and Advisory for material assumptions and risk factors. G – Guidance, E - EstimatesDEVELOPMENT PLAN PRICE SENSITIVITY(1)
Gas Price Sensitivity Oil Price Sensitivity
Total Debt to Adjusted Funds Flow (2) Total Debt to Adjusted Funds Flow (2)
AECO $1.30/mcf AECO $1.70/mcf WTI US$50.00/bbl WTI US$70.00/bbl
(@ WTI US$58/bbl Flat) (@ AECO Cdn$1.65/mcf Flat)
2.0
1.8 1.8 1.9
1.6
1.6 1.6
1.3
1.4 1.2
1.0
0.6
2019 2020 2021 2019 2020 2021
Notes:
(1) Forward-looking information. Refer to three year development plan (November 1, 2018 and July 8, 2019 news releases) and
Advisory for material assumptions and risk factors.
(2) Non-GAAP measure which may not be comparable to similar non-GAAP measures used by other entities. Refer to Advisory.
(3) Estimated average three-year C5+/Light Oil differential to WTI of US$7.50/bbl and FX $0.755 Cdn/US. Other market 15
diversification based on future prices as of April 2, 2019.STRONG HEDGES AND TRANSPORTATION IN-PLACE (1)
Current Hedging Transactions (MMcf/d) Hedging Strategy
140 90% • Summer 2019 AECO hedges mitigate
AECO ($Cdn/Mcf) volatility
80%
120 $2.87 $2.87
Dawn ($US/Mmbtu) • Expect to hedge both liquids and natural
70% gas in future periods
100 $3.01 % of AECO Exposure
Hedged 60%
% of Dawn Exposure
80 $3.01 Hedged 50% Transportation
60 40% • Sufficient current and future
transportation capacity available to meet
$3.16
30% requirements of 2019-2021 development
40 $2.83 $1.84 $1.84 $2.12
20% plan
$2.26 $1.36 $1.36
20 • Actively manage contracted
10%
$1.36 transportation capacity to optimize
0 0% portfolio
Q1-19 Q2-19 Q3-19 Q4-19 Q1-20 Q2-20 Q3-20 Q4-20
Notes:
(1) Forward-looking information. Refer to three year development plan (November 1, 2018 and July 8, 2019 news releases)
and Advisory for material assumptions and risk factors.
16Financial Discipline Operationally Nimble Returns Focus
APPENDIX

           18
GLACIER – LOCATED IN THE HEART OF THE MONTNEY RESOURCE PLAY
BC AB
Glacier
Pipestone Liquids Fairway
Source: Geoscout, Corporate Presentations
Montney Siltstone Comparison:
• 700 times more permeability
• 4x more formation thickness
• Very low clay content
• Liquids & Improved well efficiencies strong economics
Up to 83 bbls/MMcf
19CONTINUOUS IMPROVEMENT HAS LED TO EXCEPTIONAL EFFICIENCIES
20MIDDLE MONTNEY PRODUCTION CONTINUES TO INCREASE
2018/19 11 wells
Gen 6: Slickwater, OH Packers, Stage
• 2017+ Middle Montney wells with frac design changes
completions Avg 33 frac stages including >30 frac stages & numerous mechanical
systems evaluated
2016/17 6 Wells
• 39 total Middle Montney wells on-production across
Gen 5: Slickwater, OH Packers, Cased
hole & Stage completions Glacier land block.
Avg 27 frac stages
2015 13 wells
Gen 4: Slickwater, OH Packers
Avg 19 frac stages
2014 3 wells
Gen 3: Slickwater, OH Packers
Avg 15 frac stages
2013 4 wells
Gen 2: Poly CO2, & Slickwater Plug and Perf
Avg 13 frac stages
2012 2 wells
Gen 1: Poly CO2, Sand Plugs,
Avg 15 frac stages
Middle Montney Budget Type Curve (IP30 5.0 mmcf/d & 5.0 Bcf)
21GLACIER MONTNEY ASSIGNED 2P EUR PER WELL & INTERVAL
Glacier - 2P Recoveries per Interval(1)
# of Gross HZ Wells 2P Recovery [bcf/well]
Developed Undeveloped Total Developed Undeveloped Total
Interval
YE YE YE YE YE YE YE YE YE YE YE YE YE YE YE YE YE YE
2016 2017 2018 2016 2017 2018 2016 2017 2018 2016 2017 2018 2016 2017 2018 2016 2017 2018
1 UM 103 111 115 141 133 130 244 244 245 4.9 5.1 5.2 5.9 5.8 5.8 5.4 5.5 5.5
2 MM 12 15 22 52 65 61 64 80 83 5.8 5.6 6.4 5.2 5.6 5.4 5.3 5.6 5.7
3 MM 8 10 13 25 35 40 33 45 53 4.5 4.4 4.6 4.1 4.4 4.4 4.2 4.4 4.5
4 MM 2 3 4 5 11 14 7 14 18 6.1 7.4 7.7 5.9 6.6 6.6 6.0 6.7 6.8
5 LM 43 51 54 84 81 86 127 132 140 7.1 7.7 7.8 6.4 6.5 6.4 6.6 6.9 6.9
Total 168 190 208 307 325 331 475 515 539
Valhalla - 2P Recoveries per Interval(1)
# of Gross HZ Wells 2P Recovery [bcf/well]
Developed Undeveloped Total Developed Undeveloped Total
Interval
YE YE YE YE YE YE YE YE YE YE YE YE YE YE YE YE YE YE
2016 2017 2018 2016 2017 2018 2016 2017 2018 2016 2017 2018 2016 2017 2018 2016 2017 2018
1 UM 2 4 4 5 5 2 9 9 2.9 6.6 6.8 7.9 7.5 2.9 7.3 7.2
2 MM 1 2 2 5 7 1 7 9 4.4 4.3 5.0 4.1 4.2 4.4 4.2 4.4
4 MM 1 1 2 2 0 3 3 2.1 3.8 2.1 3.4 2.1 3.5
Total 3 7 7 0 12 14 3 19 21
(1) Based
on Sproule 2016 - 2018 year-end reserve reports. Indicated raw gas volumes per well. Refer to Statement of Reserves Data and
Other Oil and Gas Information in the Corporation’s Annual Information Forms which are available at www.sedar.com and 22
www.advantageog.com.WEMBLEY MONTNEY ASSIGNED 2P EUR PER WELL & INTERVAL
Wembley Montney Assigned 2P EUR Per Well & Interval(1)
# of Gross HZ Wells 2P Gas & Free Liquids Recovery [bcf/well mstb/well]
Interval Developed Undeveloped Total Developed Undeveloped Total
YE YE YE YE YE YE YE YE YE YE YE YE
2017 2018 2017 2018 2017 2018 2017 2018 2017 2018 2017 2018
4 MM 1 11 0 12 2.3 358 2.3 358 2.3 358
Total 0 1 0 11 0 12
(1) Based on Sproule 2017 and 2018 year-end reserve reports. Indicated raw gas volumes per well. Refer to Statement of Reserves Data and
Other Oil and Gas Information in the Corporation’s Annual Information Forms which are available at www.sedar.com and 23
www.advantageog.com.ADVISORY
Forward-Looking Information and Statements
The information in this presentation contains certain forward-looking information and forward-looking statements (collectively, "forward-looking statements")
within the meaning of applicable securities laws relating to the Corporation's plans and other aspects of its anticipated future operations, management focus,
strategies, financial, operating and production results and business opportunities. These statements relate to future events or our future intentions or performance.
All statements other than statements of historical fact may be forward-looking statements. The statements have been prepared by management to provide an
outlook of the Corporation's activities and results and may not be appropriate for other purposes. Forward-looking statements are often, but not always, identified
by the use of words such as “seek”, “anticipate”, “plan”, “continue”, “estimate”, “guidance”, “demonstrate”, “expect”, “may”, “can”, “will”, “project”, “predict”,
“potential”, “target”, “intend”, “could”, “might”, “should”, “believe”, “would” and similar expressions and include statements relating to, among other things, the
Corporation's 2019 to 2021 Development Plan (the "Plan"), the Plan's development focus and the timing thereof, the expected sources of funding for the Plan;
expected results and benefits to be derived from the Plan include, but are not limited to, increasing the anticipated amount of annual average liquids production,
increasing C5+/light oil production mix and the expected amount of C5+/light oil production mix, diversifying the Corporation's revenue sources including the
composition of natural gas and liquids, developing additional operational and infrastructure optionality and how this will be achieved; annual production average
and the expected amount by which total annual average production will be increased by in 2019 to 2021; expected net capital expenditures for 2019 to 2021,
including the expected focus and allocation of such expenditures; the expected cumulative capital investment over the Plan's three years; resource development
potential beyond the Plan and the Corporation's future drilling inventory; the benefits derived from third party processing arrangements the Corporation entered
into with two midstream firms; and other matters. Advantage’s actual decisions, activities, results, performance or achievement could differ materially from those
expressed in, or implied by, such forward-looking statements and accordingly, no assurances can be given that any of the events anticipated by the forward-looking
statements will transpire or occur or, if any of them do, what benefits that Advantage will derive from them.
With respect to the forward-looking statements contained in this presentation, Advantage has made a number of material assumptions regarding, but not limited
to: current and future commodity prices; the Corporation's current and future hedging program; future exchange rates; future production and composition
including natural gas and liquids; royalty regimes and future royalty rates; future operating costs; future transportation costs and availability of product
transportation capacity; future general and administrative costs; the estimated well costs including frac stages and lateral lengths per well; the number of new
wells required to achieve the objectives of the Plan; that the Corporation will be able to complete its infrastructure projects on a timely basis; the timing for the
construction to be completed on third party mid-stream facilities; timing and amount of net capital expenditures; and that the Corporation will have sufficient
financial resources required to fund its capital and operating expenditures and requirements as needed.
24ADVISORY
Management has included the summary of assumptions and risks related to forward-looking information in order to provide shareholders with a more
complete perspective on Advantage's future operations and such information may not be appropriate for other purposes. Advantage’s actual results,
performance or achievement could differ materially from those expressed in, or implied by, these forward-looking statements and, accordingly, no
assurance can be given that any of the events anticipated by the forward-looking statements will transpire or occur, or if any of them do so, what benefits
that Advantage will derive there from. Management does not have firm commitments for all the costs, expenditures, prices or other financial assumptions
used to prepare the forward-looking information or assurance that such operating results will be achieved and, accordingly, the complete financial effects of
all of those costs, expenditures, prices and operating results are not objectively determinable. Readers are cautioned that the foregoing lists of factors are
not exhaustive. The Corporation and management believe that the statements have been prepared on a reasonable basis, reflecting management's best
estimates and judgments. However, because this information is highly subjective and subject to numerous risks including the risks discussed above, it should
not be relied on as necessarily indicative of future results. These forward-looking statements are made as of the date of this presentation and Advantage
disclaims any intent or obligation to update publicly any forward-looking statements, whether as a result of new information, future events or results or
otherwise, other than as required by applicable securities laws.
These statements involve substantial known and unknown risks and uncertainties, certain of which are beyond Advantage’s control, including, but not
limited to: changes in general economic, market and business conditions; industry conditions; impact of significant declines in market prices for oil and
natural gas; actions by governmental or regulatory authorities including increasing taxes and changes in investment or other regulations; changes in tax
laws, royalty regimes and incentive programs relating to the oil and gas industry; the effect of acquisitions; Advantage's success at acquisition, exploitation
and development of reserves; failure to achieve production targets on timelines anticipated or at all; unexpected drilling results; changes in commodity
prices, currency exchange rates, net capital expenditures, reserves or reserves estimates and debt service requirements; the occurrence of unexpected
events involved in the exploration for, and the operation and development of, oil and gas properties, including hazards such as fire, explosion, blowouts,
cratering, and spills, each of which could result in substantial damage to wells, production facilities, other property and the environment or in personal
injury; changes or fluctuations in production levels; individual well productivity; lack of available capacity on pipelines; delays in anticipated timing of drilling
and completion of wells; delays in completion of infrastructure; lack of available capacity on pipelines; individual well productivity; competition from other
producers; the lack of availability of qualified personnel or management; credit risk; changes in laws and regulations including the adoption of new
environmental laws and regulations and changes in how they are interpreted and enforced; our ability to comply with current and future environmental or
other laws; stock market volatility and market valuations; liabilities inherent in oil and natural gas operations; uncertainties associated with estimating oil
and natural gas reserves; competition for, among other things, capital, acquisitions of reserves, undeveloped lands and skilled personnel; incorrect
assessments of the value of acquisitions; geological, technical, drilling and processing problems and other difficulties in producing petroleum reserves; ability
to obtain required approvals of regulatory authorities; and ability to access sufficient capital from internal and external sources. Many of these risks and
uncertainties and additional risk factors are described in the Corporation’s Annual Information Form dated February 28, 2019 which is available at
www.Sedar.com and www.advantageog.com. Readers are also referred to risk factors described in other documents Advantage files with Canadian
securities authorities.
25ADVISORY
Oil and Gas Information
Barrels of oil equivalent ("boe") and thousand cubic feet of natural gas equivalent ("mcfe") may be misleading, particularly if used in isolation. Boe and mcfe
conversion ratios have been calculated using a conversion rate of six thousand cubic feet of natural gas equivalent to one barrel of oil. A boe and mcfe
conversion ratio of 6 mcf: 1 bbl is based on an energy equivalency conversion method primarily applicable at the burner tip and does not represent a value
equivalency at the wellhead. Given that the value ratio based on the current price of crude oil as compared to natural gas is significantly different from the
energy equivalency of 6:1, utilizing a conversion on a 6:1 basis may be misleading as an indication of value.
This presentation discloses drilling inventory in the Glacier, Valhalla, Progress and Pipestone/Wembley areas in three categories: (i) proved locations; (ii)
probable locations; and (iii) unbooked locations. Proved locations and probable locations are derived from Sproule Associates Limited reserves evaluation
effective December 31, 2018 and account for drilling locations that have associated proved and/or probable reserves, as applicable. Unbooked locations are
internal estimates based on our prospective acreage and an assumption as to the number of wells that can be drilled per section based on industry practice
and internal review. Unbooked locations do not have attributed reserves or resources. Of the 1,400 to 1,500 total drilling locations identified herein, 327 are
proved locations, 29 are probable locations and 1,044 to 1,144 are unbooked locations. Unbooked locations have been identified by management as an
estimation of our multi-year drilling activities based on evaluation of applicable geologic, seismic, engineering, production and reserves information. There is
no certainty that the Corporation will drill all unbooked drilling locations and if drilled there is no certainty that such locations will result in additional oil and
gas reserves, resources or production. The drilling locations on which we actually drill wells will ultimately depend upon the availability of capital, regulatory
approvals, seasonal restrictions, oil and natural gas prices, costs, actual drilling results, additional reservoir information that is obtained and other factors.
While certain of the unbooked drilling locations have been de-risked by drilling existing wells in relative close proximity to such unbooked drilling locations,
other unbooked drilling locations are farther away from existing wells where management has less information about the characteristics of the reservoir
and therefore there is more uncertainty whether wells will be drilled in such locations and if drilled there is more uncertainty that such wells will result in
additional oil and gas reserves, resources or production.
References in this presentation to production test rates, initial production rates, IP30 rates, flow rates, yields and other short-term production rates are
useful in confirming the presence of hydrocarbons, however such rates are not determinative of the rates at which such wells will commence production and
decline thereafter and are not indicative of long term performance or of ultimate recovery. Additionally, such rates may also include recovered "load oil"
fluids used in well completion stimulation. While encouraging, readers are cautioned not to place reliance on such rates in calculating the aggregate
production of Advantage. Advantage cautions that the test results should be considered to be preliminary.
26ADVISORY
Advantage has presented certain type curves and well economics for its Montney areas. The type curves presented are based on Advantage's historical
production. Such type curves and well economics are useful in understanding management's assumptions of well performance in making investment
decisions in relation to development drilling in the Montney area and for determining the success of the performance of development wells; however, such
type curves and well economics are not necessarily determinative of the production rates and performance of existing and future wells and such type curves
do not reflect the type curves used by our independent qualified reserves evaluator in estimating our reserves volumes. The type curves differ as a result of
varying horizontal well length, stage count and stage spacing. The type curves represent the average type curves expected. In this presentation, estimated
ultimate recovery represents the estimated ultimate recovery associated with the type curves presented; however, there is no certainty that Advantage will
ultimately recover such volumes from the wells it drills.
In presenting such type curves, inputs and economics information and in this presentation generally, Advantage has used a number of oil and gas metrics
which do not have standardized meanings and therefore may be calculated differently from the metrics presented by other oil and gas companies. Such
metrics include DCE+T, "EUR", "NPV10", "payout", "rate of return" (or "ROR"), "half cycle ROR", and “operating netback". EUR represents the estimated
ultimate recovery of resources associated with the type curves presented. NPV10 represents the anticipated net present value of the future net revenue
discounted at a rate of 10% associated with the type curves presented. Payout means the anticipated years of production from a well required to fully pay
for the DCE+T of such well. ROR means the rate of return of a well or the discount rate required to arrive at a NPV equal to zero. Half cycle ROR means the
rate of return of a well or the discount rate required to arrive at a NPV equal to zero when taking into account "half cycle" costs, which include drilling,
completion, equip and tie-in capital expenditures.
Production estimates contained herein are expressed as anticipated average production over the calendar year. In determining anticipated production for
the years ended 2019 to 2021 Advantage considered historical drilling, completion and production results for prior years and took into account the
estimated impact on production of the Corporation’s 2019 to 2021 expected drilling and completion activities.
27ADVISORY
Non-GAAP Measures
The Corporation discloses several financial and performance measures that do not have any standardized meaning prescribed under International Financial
Reporting Standards ("IFRS" or “GAAP”). These financial and performance measures include “net capital expenditures”, “adjusted funds flow”, “total debt”,
and “total debt to adjusted funds flow”. Such financial and performance measures should not be considered as alternatives to, or more meaningful than
measures determined in accordance with GAAP including “net income”, “comprehensive income”, “cash provided by operating activities”, or “cash used in
investing activities”. Management believes that these measures provide an indication of the results generated by the Corporation’s principal business
activities and provide useful supplemental information for analysis of the Corporation’s operating performance and liquidity. Advantage’s method of
calculating these measures may differ from other companies, and accordingly, they may not be comparable to similar measures used by other companies.
“Net capital expenditures” include total capital expenditures related to property, plant and equipment and exploration and evaluation assets incurred during
the period. Management considers this measure reflective of actual capital activity for the period as it excludes changes in working capital related to other
periods. The Corporation considers “adjusted funds flow” to be a useful measure of Advantage’s ability to generate cash from the production of natural gas
and liquids, which may be used to settle outstanding debt and obligations, and to support future capital expenditures plans. Changes in non-cash working
capital are excluded from adjusted funds flow as they may vary significantly between periods and are not considered to be indicative of the Corporation’s
operating performance as they are a function of the timeliness of collecting receivables or paying payables. Expenditures on decommissioning liabilities are
excluded from the calculation as the amount and timing of these expenditures are unrelated to current production, highly variable and discretionary. “Total
debt” is the total of bank indebtedness and working capital deficit. “Total debt to adjusted funds flow” is a ratio calculated as total debt divided by adjusted
funds flow for the previous four quarters. Total debt to adjusted funds flow is considered by management to be a useful measure as it is commonly used to
evaluate the leverage of a company and the ability to settle outstanding debt and obligations with cash generated from operations. Refer to the
Corporation’s most recent Management’s Discussion and Analysis, which is available at www.sedar.com and www.advantageog.com, for additional
information about certain financial measures, including reconciliations to the nearest GAAP measures, as applicable.
28ADVISORY
Abbreviations
The following abbreviations used in this presentation have the meanings set forth below.
bbl barrel
bbl/d barrel per day
bbls/d barrels per day
bbls/mmcf barrels per million cubic feet
boe barrels of oil equivalent of natural gas, on the basis of one barrel of oil or natural gas liquids for six thousand cubic feet of natural gas
boe/d barrels of oil equivalent per day
GJ Gigajoule
mcf thousand cubic feet
Mcfe thousand cubic feet equivalent on the basis of six thousand cubic feet of natural gas for one barrel of oil or natural gas liquids
mmcf/d million cubic feet per day
mmcfe/d million cubic feet equivalent per day
NGL natural gas liquids
DCE+T drill, complete, equip and tie-in
C3+ propane plus
C5+ pentanes plus
29ADVANTAGE CONTACT INFORMATION
Investor Relations
1.866.393.0393
ir@advantageog.com
www.advantageog.com
Listed on TSX: AAV
Advantage Oil & Gas Ltd.
Suite 2200, 440 – 2nd Avenue SW
Calgary, Alberta T2P 5E9
Main: 403.718.8000
Facsimile: 403.718.8332
Advantage 100% W.I. Glacier Gas Plant
Andy Mah, P.Eng. Director, President & Chief Executive Officer
Mike Belenkie, P.Eng. Chief Operating Officer
Craig Blackwood, C.A. Chief Financial OfficerYou can also read