Unaudited interim results - for the six months ended 31 December 2020 - MAKING THE RIGHT CONNECTION
←
→
Page content transcription
If your browser does not render page correctly, please read the page content below
Unaudited interim
results
for the six months ended
31 December 2020

                    MAKING THE RIGHT CONNECTION

                                      www.arbhold.co.za
                       ARB Holdings Ltd (“ARB” or “the company” or “the group”)
             Registration number: 1986/002975/06 | Share code: ARH | ISIN: ZAE000109435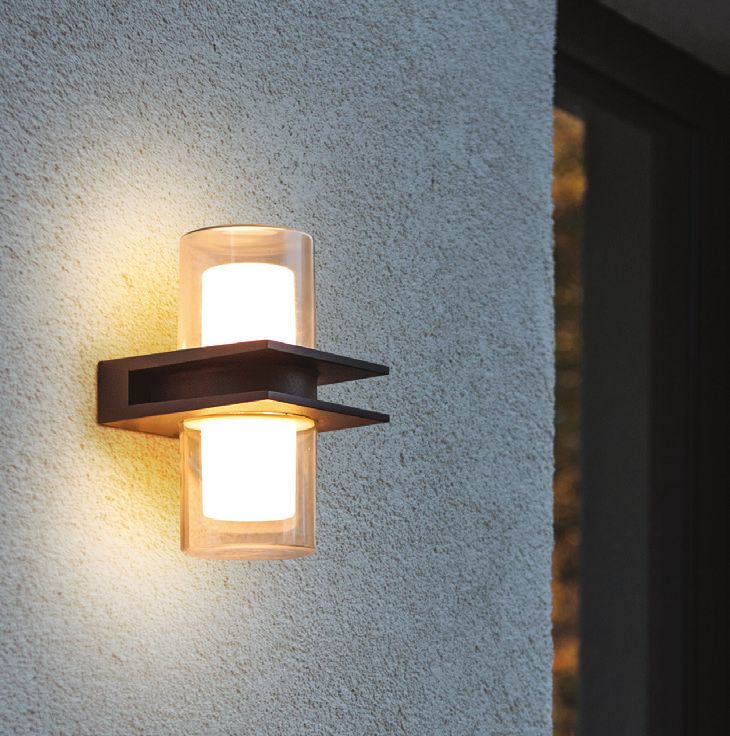
SALIENT POINTS

     Revenue up 5.3% to R1.49bn
           (2019: R1.42bn)

      Operating profit up 59.2%
        to R169m (2019: R106m)

     Net profits after tax up 28.9%
         to R109m (2019: R85m)

       Headline earnings per share
        (“HEPS”) up 25.9% to
     41.12 cents (2019: 32.65 cents)

 In line with past practice, no   interim
      dividend has been declared

   Cash generated by trading activities
   up 60% to R182m (2019: R114m)

    Net tangible asset value per share
up 9.6% to 473.7 cents (2019: 432.4 cents)

  R305m cash on hand (2019: R85m)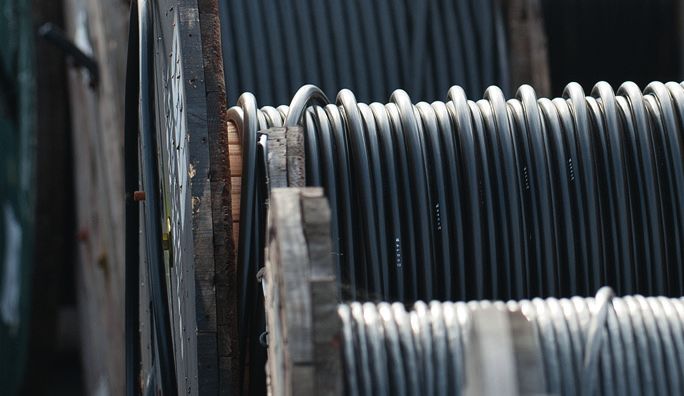
COMMENTARY

The board of directors of ARB (“the board”) is pleased to present the group’s interim results for the
six months ended 31 December 2020 (“the period”).

NATURE OF BUSINESS
ARB is an investment and property holding company that owns investments in related trading and
distribution businesses. Major investment holdings include 74% of ARB Electrical Wholesalers, a
level 2 BEE company that operates 20 electrical wholesale branches (June 2020: 22) throughout
South Africa, and 60% of Eurolux, which imports and distributes light fittings, lamps and related
accessories.

OVERVIEW OF THE PERIOD UNDER REVIEW
Key achievements during the period include significant improvements in operating profit and
operating margin. The group’s financial position is robust and its cash flow has been resilient in
challenging circumstances. These results demonstrate ARB’s ability to bounce back from adverse
trading conditions, such as the Covid-19 lockdowns, and the ability of a highly experienced and
skilled management team to reduce the costs of a largely fixed-cost business to maximise the
operational leverage from an improvement in revenue and gross margin, resulting in enhanced
returns to shareholders.

FINANCIAL REVIEW
The group delivered a strong performance for the period, increasing revenue by 5.3% to R1.49bn
(2019: R1.42bn). This was largely due to ARB’s trading environment despite the effects of the
pandemic.

Operating profit also showed substantial improvement, increasing by 59.2% to R169.2m (2019:
R106.3m) at an operating margin of 11.3% of revenue (2019: 7.5%). The gross margin increased from
25.1% to 26.5%, mainly attributable to increased margins in both major trading divisions.

Whilst ARB experienced some challenges in its supply chain, both locally and internationally, as a
result of the second wave of the pandemic, having stock available proved to be a significant factor
in the group’s success during this period. While the group, particularly the lighting division, was
overstocked at the June financial year end, this proved to be beneficial, not only in terms of having
stock on hand, but also because the stock had been acquired at favourable rand/US dollar prices.

The group is committed to constantly reviewing its operating models and procedures to gain
efficiencies and cost savings as market conditions change. Both divisions went through S189A
retrenchment processes during the period and have frozen a number of vacant positions.

The new warehouse management system (“WMS”) at the Lords View distribution centre went live on
14 December 2020 but, as is to be expected, it will take time to settle down and then be optimised.
It is estimated that this process will take another six months. The group has been consistent in
advising the market that the real benefits of this system will only be effective after June 2021.

                            ARB Holdings Limited Unaudited interim results for the six months ended 31 December 2020   1
COMMENTARY continued

    Shareholders have been regularly advised that the valuation of the liability of the put options of
    minority shareholders in Eurolux is volatile, and may increase or decrease significantly in the
    short term, mainly due to changes in the share price. The put option revaluations are reflected as a
    significant charge of R20.8m on earnings during the period (in the prior comparative period, this was
    income of R6m); a combined negative change of R26.8m.

    These put options are reflected as a current liability of R60m, an increase of 11% over the prior
    comparative period. This increase in the put option liability, and the associated charge to the income
    statement, is as a result of the improved earnings of the lighting division, and an increase in the
    valuation multiple to just over five. As explained previously, when operating profit increases, the put
    option valuation is likely to have a negative effect on earnings and vice versa. The CraigCor minority
    put option is exercisable from March 2023, and is reflected as a non-current liability.

    The group’s earnings per share (“EPS”) for the six months to December 2020 increased by 24.8% to
    41.02 cents per share (2019: 32.87 cents). Headline earnings per share (“HEPS”) were up by 25.9%
    to 41.12 cents (2019: 32.65 cents).

    The group has cash on hand of R304.7m (2019: R84.9m), a substantial increase over the prior
    comparable period of 259%. Cash generation has been very positive during the last six months,
    partly as a result of the improvement in working capital management, particularly with regards to
    stock levels in the lighting division; exceptional debtors’ collections in the electrical division; cost
    savings and efficiencies, and of the conscious decision not to pay a dividend at year end to retain
    cash reserves during the uncertainty of the Covid-19 pandemic.

    Management in both divisions have been active in debtors’ collections, which mitigated initial
    concerns about the recoverability of debtors. However, this remains a concern, more particularly in
    the electrical division, given potential new adverse trading conditions and the reluctance of credit
    insurers to grant sufficient cover to meet the anticipated increased exposure that will arise on
    normal supplies to customers.

    Credit insurers have actively reduced or withdrawn cover on many of the group’s customers, and
    they have reduced the percentage of the cover from 90% to 75%, as well as increasing risk premiums
    substantially. This has predominantly affected the electrical division whose customers are more
    allied to the construction industry. The hardening of the credit insurance market has necessitated
    additional calculated credit risk in the electrical division, to support customers’ increasing needs.
    This has not resulted in any material losses, nor has it affected the IFRS 9 expected credit loss
    charge for the period.

    Net interest received decreased by 0.2% to R2.7m (2019: R2.7m) as a result of the significant
    decrease in interest rates during the period, offset by increased cash from operations.

    ARB continues to take all appropriate actions to protect staff; preserve cash; defend its balance
    sheet and minimise its operating costs given the current circumstances. All health and safety
    requirements for the management of people to prevent or restrict Covid-19 transmissions are
    adhered to in all ARB operations. The stringent adherence to rules for the protection of employees
    is now a way of doing business at ARB.

2   ARB Holdings Limited Unaudited interim results for the six months ended 31 December 2020
The group continued to honour all of its supplier payments on time and in full during this period.
DIVISIONAL REVIEWS
The group is currently organised into three operating divisions, and this is the basis on which the
group reports its primary segmental information. Principal activities are as follows:
Electrical: distributors of electrical products across three main categories: power and
instrumentation cable; overhead line equipment, and low voltage products;
Lighting: distributors of halogen, fluorescent and energy saving LED lamps; light fittings and
electrical accessories; and
Corporate: property investment; specialist IT services; strategic and technical consulting, and
group head office companies.
Electrical division: revenue increased by 5.0% and operating profit up 60.9%
The division comprises ARB Electrical Wholesalers, GMC Powerlines, ARB Global, CraigCor and CED.
This division yielded a significant improvement in operating profit, mainly due to an improvement in
the gross margin from trading, together with rationalisation and other cost-saving efforts, despite
the lack of economic growth or infrastructure development in South Africa, and the lingering effects
of Covid-19 and the associated lockdowns.
There was a robust improvement in sales of power cable during the period under review, although
this is still below the level that the group is structured to supply due to the lack of infrastructure
development in South Africa and increased competition from manufacturers. The division also
experienced supply constraints from local manufacturers during the period as a result of the
pandemic and the lockdowns.
Overhead line product sales remain unsatisfactory due to the inconsistent spend by Eskom on
electrification projects and the equally sporadic spend on general electrification projects, which
have been further hampered as a result of Covid-19, particularly in restricting contractors’ staff
availability to execute on contracts. Eskom-related work is now a significantly smaller portion of this
business, although ARB remains committed to, and is fully capable of, servicing this market when
it regains momentum.
Low voltage sales, which have benefited from the Connect model expansion in prior years, continue
to improve and margins are being maintained on these products.
During the period, management undertook a number of right-sizing initiatives: closing two branches,
retrenching surplus employees and freezing a number of vacant positions. Other initiatives included:
assessing each branch’s footprint with a view to reducing excess space;
simplifying systems to reduce staff requirements;
emphasising staff costs and time management; and
conducting a thorough review of all expenditure and eliminating non-productive costs.
The implementation of the WMS at the Lords View distribution centre in Midrand is also expected to
bear fruit by streamlining processes and reducing costs in the future once it is fully and effectively
operational.
ARB Holdings Limited Unaudited interim results for the six months ended 31 December 2020 3COMMENTARY continued
This division’s focus on working capital is commendable and the business remains cash generative.
Lighting division: revenue increased by 5.8% and operating profit by 94.9%
The division comprises Eurolux, Radiant and Cathay Lighting. Profitability improved substantially
over prior years largely due to the effects of the rationalisation from the integration of the Eurolux/
Radiant facilities in Johannesburg, which is now starting to reflect significant savings.
The restructuring of the division is now finalised, with the right-sizing of the business for the next
normal resulting in a substantial reduction in the cost base. This included the rationalisation of
the Johannesburg warehouses, retrenchments, and a reduction in contract workers. In addition,
transport costs have been put out to tender, which should result in further savings.
While the lighting division was previously overstocked, this position has positively affected the
results in the period, and also resulted in a slight increase in market share. The stock has been
reduced by almost R90m and is more balanced than at the end of June 2020. However, given the
long procurement lead times of this business, stock management will continue to be a major focus.
Corporate division: revenue decreased by 4.9% and operating profit increased by 2.9%
This division comprises the property portfolio and Xact ERP Solutions business. The results are
lower than last year as a result of reduction in rentals received during the lease renewals on 1 July
2020 but are in line with expectations as a result of Covid-19.
Xact ERP Solutions has generated additional revenue from the warehouse integration project, but
this is reversed on the consolidation of the group results. It continues to develop a stand-alone
identity relevant to its target market, and to show customer gains, but remains a small revenue and
profit generator for the division.
CORPORATE ACTIVITY AND EXPANSION
Acquisitions remain part of the group’s growth and expansion strategy and the board is cognisant
of opportunities which present themselves. Potential to expand the product base in the electrical
division are currently being evaluated, however the immediate focus is to ensure that the warehouse
management system project implementation at the Lords View distribution centre is fully functional
to generate the envisaged benefits and efficiencies, and to ensure that the integrated Eurolux and
Radiant operation continues to runs optimally.
4 ARB Holdings Limited Unaudited interim results for the six months ended 31 December 2020PROSPECTS
Even with the availability of vaccines globally, and the arrival of the first vaccines in South Africa in
the first quarter of the 2021 calendar year, the duration and impact of the Covid-19 pandemic on our
economy generally, and our customer base in particular, remains hard to determine. It is likely that
the biggest challenge will be planning around any possible future waves of the pandemic. It appears
that normality in markets and many aspects of daily life will only return in 2022, or thereafter. While
the board indicated at the 2020 year end that it would take two to three years for life to normalise,
ARB is cognisant of the fact that leading economists believe that it could take 48 months of growth
just for the South African economy to revert to 2019 levels.
Fortunately, the return to level 3 restrictions in December 2020 were not as restrictive from a
business perspective, but certainly any Government, Eskom or large project work in South Africa
has slowed down substantially, so the visibility for planning purposes remains low.
As mentioned, credit control is facing pressure from credit insurers, who are cutting cover limits,
increasing co-insurance levels and charging increased premiums. The latter will aggravate the
risk of credit loss to the group and could hamper revenue generation as ARB limits its credit
risk exposure. However, the group remains committed to ensuring that it maintains sustainable
operations capable of taking advantage of any short- or medium-term improvements in the South
African economy.
Furthermore, the group has restructured its cost base to be profitable at these trading levels and
this bodes exceptionally well for ARB in the short to medium term. ARB is strongly positioned to
service the electrical needs of southern Africa, which will provide above average long-term growth
and returns, as the continent increases its electricity generation and usage.
ARB has significant financial resources; geographical footprint; distribution capability and a well-
established management team that can lead the business into the future.
ARB Holdings Limited Unaudited interim results for the six months ended 31 December 2020 5These interim statements, including these prospects have neither been audited nor reviewed by the
company’s auditors.
CONDENSED GROUP STATEMENT OF
COMPREHENSIVE INCOME
Audited
Six months to Six months to year to
31 December 31 December 30 June
% 2020 2019 2020
change (R000’s) (R000’s) (R000’s)
Revenue 5.3 1 493 804 1 418 026 2 352 995
Cost of sales 3.4 (1 097 681) (1 061 569) (1 765 391)
Gross profit 11.1 396 123 356 457 587 604
Other income (10.2) 2 180 2 427 10 912
Selling, administration and distribution
expenses (9.3) (229 069) (252 597) (452 620)
Operating profit 59.2 169 234 106 287 145 896
Write-off of trademarks, goodwill and
asset impairments – – (76 006)
Change in put option valuation (20 859) 6 000 33 003
Profit before interest and taxation 32.1 148 375 112 287 102 893
Net interest received (0.2) 2 740 2 744 3 774
Profit before taxation 31.4 151 115 115 031 106 667
Taxation 38.1 (42 072) (30 457) (13 352)
Profit for the period 28.9 109 043 84 574 93 315
Items that will not be recycled into
profit or loss
– Revaluation of property, plant and
equipment (net of taxation) – – (4 449)
Total comprehensive income for
the period 28.9 109 043 84 574 88 866
Profit for the period attributable to: 109 043 84 574 93 315
– Non-controlling interests (“NCI”) 72.4 12 639 7 332 9 472
– Ordinary shareholders 24.8 96 404 77 242 83 843
Total comprehensive income
attributable to: 109 043 84 574 88 866
– Non-controlling interests (“NCI”) 72.4 12 639 7 332 9 472
– Ordinary shareholders 24.8 96 404 77 242 79 394
6 ARB Holdings Limited Unaudited interim results for the six months ended 31 December 2020RECONCILIATION BETWEEN EARNINGS
AND HEADLINE EARNINGS
Audited
Six months to Six months to year to
31 December 31 December 30 June
% 2020 2019 2020
change (R000’s) (R000’s) (R000’s)
Profit for the period attributable
to ordinary shareholders 96 404 77 242 83 843
Impairment of trademarks and
goodwill – – 66 447
Impairment of buildings and
Right-of-use assets – – 9 310
Profit on disposal of property,
plant and equipment 421 (762) 326
Total tax effects of adjustments (118) (34) (16 651)
Total NCI effects of adjustments (75) 278 (2 359)
Headline earnings 96 632 76 724 140 916
Number of ordinary shares in issue
(000’s) 235 000 235 000 235 000
Weighted average number of ordinary
shares in issue (000’s) 235 000 235 000 235 000
Basic earnings per share (cents)* 24.8 41.02 32.87 35.68
Headline earnings per share (cents)* 25.9 41.12 32.65 59.96
* There are no dilutive instruments in issue.
ARB Holdings Limited Unaudited interim results for the six months ended 31 December 2020 7CONDENSED GROUP STATEMENT OF FINANCIAL POSITION
Audited
Six months to Six months to year to
31 December 31 December 30 June
% 2020 2019 2020
change (R000’s) (R000’s) (R000’s)
ASSETS
Property, plant and equipment 22 530 700 435 093 429 587
Right-of-use assets 63 793 69 675 69 817
Intangible assets (87) 10 000 76 447 10 000
Deferred taxation 18 771 6 809 19 480
Total non-current assets 623 264 588 024 528 884
Current assets 1 180 953 1 078 782 1 105 047
Inventory (16) 525 436 627 989 599 412
Trade and other receivables (4) 350 857 365 936 353 679
Cash resources 259 304 660 84 857 151 956
Total assets 1 804 217 1 666 806 1 633 931
EQUITY AND LIABILITIES
Share capital and premium 116 174 116 174 116 174
Revaluation reserve 70 729 75 178 70 729
Accumulated profits 952 523 849 891 856 119
Attributable to ordinary shareholders 1 139 426 1 041 243 1 043 022
Non-controlling interests 150 033 135 306 137 394
Total shareholder’s funds 1 289 459 1 176 549 1 180 416
Non-current liabilities 183 212 135 713 96 517
Put option liability 5 000 20 000 4 000
Right-of-use lease obligations 59 372 71 278 64 513
Long-term loans 91 912 – –
Deferred taxation (39) 26 928 44 435 28 004
Current liabilities (6) 331 546 354 544 356 998
Trade and other payables (7) 219 191 236 472 260 009
Short-term lease obligations 14 526 19 952 15 898
Put option liability 11 60 000 54 000 40 000
Short-term loans 19 208 38 851 38 753
Taxation payable 253 18 621 5 269 2 338
Total equity and liabilities 1 804 217 1 666 806 1 633 931
8 ARB Holdings Limited Unaudited interim results for the six months ended 31 December 2020Audited
Six months to Six months to year to
31 December 31 December 30 June
2020 2019 2020
(R000’s) (R000’s) (R000’s)
Net asset value per share (cents) 484.86 443.08 443.84
Net tangible asset value per share (cents) 473.73 417.39 432.40
Property, plant and equipment
Capital expenditure for the period 104 093 34 058 51 918
Right-of-use assets acquired in the period 4 329 5 007 5 041
Capital commitment – Radiant Properties – 88 000 88 000
Capital commitments – contracted for 3 600 7 520 89
Capital commitments – not contracted for 3 600 6 725 6 359
Depreciation and amortisation (12 722) (15 349) (42 474)
ARB Holdings Limited Unaudited interim results for the six months ended 31 December 2020 9CONDENSED GROUP STATEMENT OF CASH FLOWS
Audited
Six months to Six months to year to
31 December 31 December 30 June
% 2020 2019 2020
change (R000’s) (R000’s) (R000’s)
Cash generated by trading activities 60 182 377 114 341 192 272
Change in net working capital (137) 35 981 (98 088) (56 881)
Cash generated by operating
activities 1 243 218 358 16 253 135 391
Net interest received (11) 6 810 7 636 12 848
Dividends paid – (62 000) (62 000)
Taxation paid (6) (26 154) (27 770) (40 363)
Cash flows from operating activities (402) 199 014 (65 881) 45 876
Cash flows from investing activities 253 (18 363) (30 152) (46 239)
Cash flows from financing activities (27 947) – (28 571)
Increase in cash resources 259 152 704 (96 033) (28 934)
Cash resources at the beginning
of the period (16) 151 956 180 890 180 890
Cash resources at the end of
the period 259 304 660 84 857 151 956
10 ARB Holdings Limited Unaudited interim results for the six months ended 31 December 2020CONDENSED GROUP STATEMENT OF CHANGES IN EQUITY
Accumu- Non-
Share Revaluation lated controlling
capital and reserve profit interests Total
premium (R000’s) (R000’s) (R000’s) (R000’s)
Balance at 30 June 2019
(audited) 116 174 75 178 831 120 133 691 1 156 163
Impact of adopting IFRS 16 – – 279 (2 467) (2 188)
Balance at 30 June 2019
(restated) 116 174 75 178 831 399 131 224 1 153 975
Total comprehensive income – – 77 242 7 332 84 574
Dividends paid – – (58 750) (3 250) (62 000)
Balance at 31 December
2019 (unaudited) 116 174 75 178 849 891 135 306 1 176 549
Total comprehensive income – (4 449) 6 228 2 088 3 867
Balance at 30 June 2020
(audited) 116 174 70 729 856 119 137 394 1 180 416
Total comprehensive income – – 96 404 12 639 109 043
Dividends paid – – – – –
Balance at period end
(unaudited) 116 174 70 729 952 523 150 033 1 289 459
ARB Holdings Limited Unaudited interim results for the six months ended 31 December 2020 11SUMMARISED GROUP SEGMENT REPORT
Electrical Lighting Corporate Inter-Co Total
(R000’s) (R000’s) (R000’s) (R000’s) (R000’s)
Six months to 31 December 2020
Segment revenue 1 090 259 419 006 39 245 (54 706) 1 493 804
Depreciation and amortisation 25 343 5 338 803 (18 762) 12 722
Operating profit/(loss) 94 676 54 213 27 271 (6 926) 169 234
Change in put option liability – – (859) (20 000) (20 859)
Profit before interest and tax 94 676 54 213 26 412 (26 926) 148 375
Net interest (paid)/received (4 369) (12 608) 8 617 11 100 2 740
Profit before tax 90 307 41 605 35 029 (15 826) 151 115
Segment assets 1 085 353 634 326 639 098 (554 560) 1 804 217
Segment liabilities (473 040) (385 384) (100 942) 444 608 (514 758)
Net segment assets 612 313 248 942 538 156 (109 952) 1 289 459
Enterprise-wide disclosure
(geographical)
Exports (mainly sub-Saharan
Africa) 75 104 27 643 – – 102 747
12 ARB Holdings Limited Unaudited interim results for the six months ended 31 December 2020Electrical Lighting Corporate Inter-Co Total
(R000’s) (R000’s) (R000’s) (R000’s) (R000’s)
Six months to 31 December 2019
Segment revenue 1 038 585 395 940 41 269 (57 768) 1 418 026
Depreciation and amortisation 30 006 2 924 825 (18 406) 15 349
Operating profit/loss 58 847 27 817 26 512 (6 889) 106 287
Change in put option liability – – (897) 6 897 6 000
Profit before interest and tax 58 847 27 817 25 615 8 112 287
Investment income – – 39 250 (39 250) –
Net interest (paid)/received (3 725) (13 858) 7 560 12 767 2 744
Profit before tax 55 122 13 959 72 425 (26 475) 115 031
Segment assets 1 055 576 573 077 534 010 (495 857) 1 666 806
Segment liabilities (519 380) (359 060) (30 327) 418 510 (490 257)
Net segment assets 536 196 214 017 503 683 (914 367) 1 176 549
Enterprise-wide disclosure
(geographical)
Exports (mainly sub-Saharan
Africa) 74 872 23 423 – – 98 295
Operating segments are reported in a manner consistent with the internal reporting provided to
the chief operating decision maker. The chief operating decision maker, who is responsible for
allocating resources and assessing performance of the operating segments, has been identified as
the chief executive officer (“CEO”).
ARB Holdings Limited Unaudited interim results for the six months ended 31 December 2020 13NOTES TO THE FINANCIAL STATEMENTS
BASIS OF PREPARATION AND ACCOUNTING POLICIES
These unaudited condensed consolidated interim financial statements for the six months ended
31 December 2020 have been prepared in accordance with International Financial Reporting
Standards (“IFRS”), IAS 34: Interim Financial Reporting, the SAICA financial reporting guides as
issued by the Accounting Practices Committee, financial pronouncements issued by the Financial
Reporting Standards Council, the requirements of the South African Companies Act, and the
JSE Listings Requirements. These condensed interim financial statements do not include all the
information required in annual financial statements and should be read in conjunction with the
30 June 2020 group annual financial statements. This report was compiled under the supervision
of Grant Scrutton CA(SA) (group chief financial officer). The full board takes responsibility for the
preparation of these financial results.
All accounting policies applied by the group in the preparation of these interim financial statements are
consistent with those applied by the group in its audited consolidated financial statements as at and for
the year ended 30 June 2020 and for the unaudited results for the six months ended 31 December 2019.
The group measures its properties at fair value; this fair value is determined annually and accordingly
no fair value adjustment was made for the interim period. For more information on the annual fair value
adjustments, please refer to the annual financial statements for the year ended 30 June 2020.
The group has adopted standards IFRS 3: amendments to the definition of a business, and IAS 1 and IAS 8
definition of materiality (all effective 1 January 2020), neither of which had a material effect on the group.
The judgements and estimates are consistent with those disclosed in the annual financial statements
for the year ended 30 June 2019.
REVENUE SEGMENTAL ANALYSIS
December December June
R000’s 2020 2019 2020
Revenue by customer type
Wholesale 259 676 266 507 278 561
Retail 206 665 188 867 325 147
Cash 255 756 255 934 433 852
Mining and industry 602 193 576 992 928 350
Exports 102 747 98 295 145 868
Other 66 767 31 431 241 217
1 493 804 1 418 026 2 352 995
14 ARB Holdings Limited Unaudited interim results for the six months ended 31 December 2020December December June
R000’s 2020 2019 2020
Revenue by product type
Power cable and wire 517 756 452 189 698 943
OHL cable and products 155 247 141 018 288 584
Lighting 356 591 374 929 616 983
Low voltage and general products 464 210 449 890 748 485
1 493 804 1 418 026 2 352 995
Revenue by business segment is disclosed in the segmental report above.
RIGHT-OF- USE LEASE LIABILITIES
December December June
R000’s 2020 2019 2020
Balance at 1 July 80 411 – –
Arising on initial recognition – 94 888 94 888
Additions 4 329 5 007 5 041
Finance costs 3 929 4 731 8 956
Lease payments (11 651) (13 396) (28 474)
Derecognition and other adjustments (3 120) – –
Total right-of-use liability 73 898 91 230 80 411
– Short-term liability (14 526) (19 952) (15 898)
Long-term liability 59 372 71 278 64 513
Lease gross lease commitments
Greater than five years 22 071 32 479 22 991
13 months to 59 months 63 711 65 007 56 419
12 months and less 18 360 29 027 38 754
Gross value of the lease 104 142 126 513 118 164
Net present value adjustment (30 244) (35 283) (37 753)
Total right-of-use liability 73 898 91 230 80 411
These lease agreements are in respect of third party right-of-use leases used for warehousing,
offices and branch trading activities. These leases are generally for three to five-year lease terms
with options to renew at market-related rentals. Annual escalations of 6% to 8% are common to
these leases and no leases have contingent rentals.
ARB Holdings Limited Unaudited interim results for the six months ended 31 December 2020 15NOTES TO THE FINANCIAL STATEMENTS continued
FAIR VALUE OF FINANCIAL INSTRUMENTS
Financial liabilities measured at fair value in the statement of financial position are categorised, in
IFRS, into the three levels of the “fair value hierarchy” based on the basis of the lowest level input
that is significant to the fair value measurement in its entirety. ARB’s level 3 liabilities are the put
option liabilities:
December December June
R000’s Level 2020 2019 2020
CraigCor – non-current 3 5 000 20 000 4 000
Eurolux – current 3 60 000 54 000 40 000
65 000 74 000 44 000
Put option liability reconciliation
Balance at the beginning of the period 44 000 79 000 79 000
Put options exercised during the period – – (2 277)
Realised gain on early settlement of
put option – – (4 848)
Unwinding of put option discounting 141 1 000 280
Unrealised revaluation of put option
liability 20 859 (6 000) (28 155)
Balance at the end of the period 65 000 74 000 44 000
There have been no transfers between levels. The fair value of the put option financial liabilities
disclosed under level 3 has been determined in accordance with the predetermined contractual
valuation method.
Financial assets and liabilities that are sensitive to re-measurement are limited to the put option
liabilities, the fair value of which are calculated in terms of a contractual formula. Eurolux options are
currently exercisable and use the average of Eurolux’s past three years’ results (unobservable data)
multiplied by 60% of the company’s price/earnings multiple as determined by the 120 days volume
weighted average share price on the JSE (subject to a cap of 7.5x and a floor of 4.0x) (observable
data). The CraigCor options are calculated on the same basis as Eurolux except that because the
options can only be put after 1 March 2023, the calculation uses the average of CraigCor’s projected
last three years’ results prior to the first date the option can be put These calculations are most
sensitive to changes in the company’s share price.
In this valuation, the significant inputs which are unobservable from market data are Eurolux’s
average past three years’ results amounting to R23.1m (30 June 2020: R23.0m) and for CraigCor, it is
the average projected last three years’ results prior to the first date the option can be put amounting
to R4.5m (30 June 2020: R4.5m), its projected average growth rate of 8% (2019: 8%) and the discount
rate of 7.25% (2020: 7.25%).
16 ARB Holdings Limited Unaudited interim results for the six months ended 31 December 2020CHANGES TO THE BOARD
There were no changes in the board of directors during the period under review.
FINANCIAL ASSISTANCE TO RELATED OR INTER-RELATED COMPANIES (s45)
The holding company has provided financial guarantees and cessions of loan accounts to the group’s
bankers on behalf of its subsidiary companies as security for facilities granted to them.
SUBSEQUENT EVENTS
The Covid-19 pandemic continues to have a significant influence on our economy, with the second
wave being experienced at the moment, and while a third wave is mooted, hopefully this will be
countered by the roll-out of vaccines worldwide. While it is expected that trading operations and
results will continue to be negatively impacted in the future, it is not possible to reliably estimate
the duration and severity of these consequences, as well as the impact on the financial position and
results of the group for future periods.
The directors are not aware of any other material event or circumstance arising since the end of the
reporting period and up until the date of this report, not otherwise disclosed in these consolidated
financial statements which significantly affect the financial position, results or cash flows of the
group.
DIVIDENDS
ARB’s policy is to distribute a single annual dividend for the full year up to a maximum of 40% of net
profit after taxation attributable to ordinary shareholders. In line with this policy, no interim dividend
has been declared.
APPRECIATION
The directors and management once again would like to acknowledge and thank our customers,
suppliers, business partners, advisors, shareholders and staff for their continued support.
For and on behalf of the board
Ralph Patmore William (Billy) Neasham
Chairman CEO
10 February 2021
ARB Holdings Limited Unaudited interim results for the six months ended 31 December 2020 17NOTES 18 ARB Holdings Limited Unaudited interim results for the six months ended 31 December 2020
CORPORATE INFORMATION

Directors                 Sponsor
RB Patmore#* (Chairman)   Grindrod Bank
JS Dixon#*                Grindrod Tower
ST Downes#*               8a Protea Place
WR Neasham (CEO)          Sandton
GM Scrutton (CFO)
                          Company Secretary
* Non-executive
                          M Louw
# Independent
                          17 Poplar Crescent
Auditors                  Lords View
T Marti-Warren            Midrand
PKF Durban
12 on Palm Boulevard
Gateway
4319
ARB HOLDINGS LTD
Tel: +27 31 910 0150 Fax: +27 31 910 0252 Email: info@arbhold.co.za
www.arbhold.co.zaYou can also read