Cutting through Touchpoints Clutter: Presentation Workshop - Automobile Category Updated 25 February 2019 - Publisher Research Council
←
→
Page content transcription
If your browser does not render page correctly, please read the page content below
Cutting through Touchpoints Clutter:
Presentation Workshop
Automobile Category
Updated 25 February 2019

“Most of the moments of our life
– and there are around 600 million of them
- don't leave a trace.”

                        Daniel Kahneman
“In this digital age we’re producing
thousands of new ads, posts, tweets,
every week, every month, every year.
We eventually concluded all we were
doing was adding to the noise.”

Marc Pritchard, CMO P&G,
ANA Masters of Marketing Conference

The implication: Do fewer things, but do them perfectly
Typically, 20% of touchpoints generate 80% of the impact

                                                                                     80%
          20%
                                                                                         Impact
         Touchpoints

                                        Source: Kantar TNS, mehr als 400,000 Touchpoint Bewertungen   4
Today we’ll be discussing …

1. Overview of the approach
2. The automotive category landscape
3. Concluding thoughts

                                       5
1
Overview of the approach

Do reading touchpoints provide a higher quality of messaging than other media?

                                    The Publisher Research Council (PRC) represents the interests of
                                    all major Newspapers, Magazines and their websites in South
                                    Africa. An annual quality survey is conducted to assess the
                                    intrinsic strengths of the written word, vs. broadcast and other
                                    competitive media types.
                                    In order to grow print media sales in South Africa, the PRC needs
                                    to provide evidence that R1 invested in its publications or websites
                                    works better (with regards to noting, engagement, recall) and
                                    delivers a higher ROI (sales) than money spent on other media.
                                    Essentially that reading touchpoints convey a higher quality of
                                    communication than other media.
                                    This will contribute to the PRC’s overall strategy to sell its medium
                                    singularly or in conjunction with Television.

                                                                                                            7
Study methodology and approach
How were the interviews conducted?

     What?                                                            When?

               Robust quantitative study n=1000                                  Interviews conducted:
                                                                                 01 November – 6 December 2018

     Where?                                                           How?
                              Urban: 7 major metro areas –                    Face-to-face Computer Aided Personal
                              Johannesburg, Pretoria, Cape Town,              Interviews on tablets (enables greater
                   GP
                              Durban, East London, Port Elizabeth &           interaction and engagement)
              FS
                              Bloemfontein
                        KZN
                                                                              20 minutes interview duration
                              Random suburb sampling
             EC
                              (geo-demographic sampling)                      The data is unweighted, as the sample
       WC
                                                                              is representative of the automobile
                                                                              category as per Establishment Survey
                                                                              Jul’17-Jun’18

                                                                                                                       8
Who did we interview?
All respondents were 18 years and older in metro areas, with quotas placed on race and gender
They further qualified by having bought a new car in the past 5 years
The sample universe was derived from the Establishment Survey (Jul 2017 to Jun 2018, metro only, have car
in home)

                       Automotive          Bought a new car in the past 5 years

                                           Approximate size of category: 6.1m (have any car in
                                           the home)

                                                                                                            9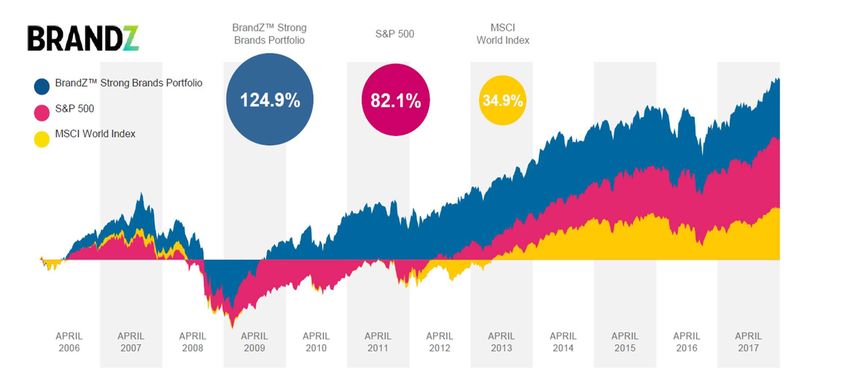
Our approach utilised Kantar TNS’s Connect methodology which helped us to unpack how
reading touchpoints (Print and online ads) perform relative to other touchpoints and how Print
investment could be optimised

             Performance                            Optimisation

            How do reading touchpoints perform     How can Print advertising spend be
            compared to other touchpoints?         optimised?

             • Which touchpoints deliver most       • What is the ROI of Print and how can a
               impact on brand strength?              brand optimise marketing spend?
             • How can touchpoint performance be    • What mix of media touchpoints is most
               improved?                              powerful to accompany Print?

                                                                                               7   6
The reason for developing this solution is because increasingly, technology has changed the
way consumers experience brands. Each moment in people’s lives is an opportunity for a
brand to connect
Developments in technology have created multiple new ways to communicate, interact and behave. Therefore, consumers
experience brands in more ways than ever before, and every experience has the potential to change their attitude and behaviour
towards brands.
11Connect identifies all relevant touchpoints along the customer journey
… and evaluates them all with the same measures to create a single currency for marketers – e.g. impact of Sponsorship vs.
the impact of a Service Hotline
1. Attention phase 2. Orientation phase 3. Buying phase 4. Usage phase 5. Loyalty phase
Ad on Internet Promotions/ Tutorial Retailer
Facebook search Coupons online Video newsletter
Sponsorship Expert Retailer Own SMS/
event endorsement website usage MMS
Web Social Media Brand Service Branded email
ads brand page website Hotline newsletter
TV Online blog/ In-store Product Replacement
ads forum Salesperson Manual service
Radio Product demo In-store Customer Brand events/
ads video displays Service fairs
Print Product review Pop-up Service Member/ loyalty
ads site stores Website club
Outdoor Friends/ family In-store Connected Customer
ads spoken demonstration App Magazine
… … … … …
12In the Automotive category we included the following 23 touchpoints – the key places in which
consumers can come into contact with an auto brand/make
Media/Paid Owned Earned
Digital Digital Digital
• Online advertising (e.g. banner • Online video ad (e.g. YouTube) • Social media (e.g. Facebook)
ads, pop ups)
• Car website • Online sales (e.g. AutoTrader,
Cars.co.za, Gumtree)
Traditional Traditional
• Outdoor advertising (e.g. • Online websites
billboards, street signs) • Call centre
Traditional
• Print advertising (e.g. • Car dealer staff • News coverage
newspapers, magazines, inserts)
• Dealer showroom Other
• TV advertising • Word of mouth conversation
• Catalogues and leaflets
• Radio advertising • Recommendation from family and
• Test report friends
• Sponsorship
Other • Personally drive
• Moving vehicles (e.g. taxis, • Test drive
buses) • Seen car on street
13How do touchpoints relate to brand equity?
Our brand equity measure is from the ConversionModel, a globally validated model that captures a brand’s
position in the market. Connect dives into this, identifying how much of a brand’s equity is driven by recent
touchpoint experiences
Brand C
Brand stock
Brand B Brand equity
before recent touchpoint
Brand experiences
equity Brand A
13.5%
12.0
Touchpoint Impact
Brand equity from recent
11.1
10.7 1.5 touchpoint experiences
Data for illustration purposes only
14But what is brand equity?
Brand equity is another name for brand love or brand desire i.e. how much people want to be using a brand if all
market barriers were removed
At Kantar TNS we use a validated approach* to measure brand equity through asking two simple questions,
which are then modelled based on the latest behavioural economics thinking:
1. Brand satisfaction 2. Brand engagement
“When you take into account everything you look “To what extent do you agree or disagree? ‘This
for in a car, how do you rate each make?” make of car connects with who I am and with the
things in life that I really care about’”
Each make of car in the consumer’s consideration Each make of car in the consumer’s consideration
set is then rated on a scale of 1 = “Terrible” set is then rated on a scale of 1 = “Strongly
through to 10 = “Perfect”. disagree” through to 7 = “Strongly agree”.
* ConversionModel 15BrandZ clearly shows that brands with strong brand equity have the best growth
Source: BrandZ 2018 16The literature is full of examples that show that campaigns that are designed to build brand
equity are more impactful and will have a longer term return on investment than short-term
activation campaigns – so we must include a measure that goes beyond using a brand
Research shows that campaigns with a short term sales approach alone are insufficient to grow the brand in the
long term. For it to be impactful, they need to be coupled with long term brand equity building efforts
Increase
in sales
Tipping Brand building
Point messages
long-term attitude
change effect on sales
The Long & the Price- and
Short of It, product messages
Binet & Field, short-term activation
IPA 2013: 996 of sales
campaigns, 700
brands in 83
categories time
17The central premise behind our touchpoint questions is about asking about the memory of an
experience with a touchpoint – and that is why we ask about the past 3 months
Added value of recalled experience to asking ‘in-the-moment’
• Most decisions are made based on memories of experiences (Daniel Kahneman)
• ‘In the moment’ approaches tend to overestimate the impact of recent experiences
because other relevant touchpoint experiences are neglected
• Distinguishing between relevant and irrelevant experiences is best done after some time
when a “natural relevance filtering” has already occurred
“We actually don’t choose
As an example, people will between experiences, we
still recall seeing Cremora on choose between memories of
TV, even though the ad experiences…”
hasn’t flighted in years …
Daniel Kahneman
SOURCE: Daniel Kahneman (2010): The riddle of experiences versus memory; 18We measure the impact of the experience with each touchpoint on brand equity
We separate the impact into two elements – recall and quality of experience
impact = recall x quality
How many people recall experiencing How does this experience impact
the touchpoint? consumers’ attitude towards the
brand?
19We use a combination of innovative survey flow & respondent level data modelling to account
for human irrationality, giving us better data
TOUCHPOINT TOUCHPOINT EXPERIENCE EXPERIENCE
RECALL RECALL EFFECT IMPACT
General per Brand Quantitative Data modelling
1 2 3 refinement 4
At which of the following Within the last 3 months, which To what extent has your Linear effects from survey
touchpoints did you come into car makes did you recognize at experience at each (experience quality) are
contact with car makes in the the following touchpoints? touchpoint changed your transformed to non-linear effects of
last 3 months? [implicit: response latency] attitude toward the car make? human heuristics known from
Behavioral Economics.
20The full 20 minute questionnaire was structured as follows…
1. Screening questions 4. Activities and SEM
Previous participation & security Readership daily activities
Region, gender, race, age SEM
Unaided and aided awareness
Regular brand usage for category
Behaviour questions
2. Brand assessments 5. Closing Demographics
Other brand consideration Education
Market share proxy (share of spend) Working status
Current brand satisfaction and engagement Monthly Household Income
ratings Home language
Category importance
Brand satisfaction 3 months ago
3. Touchpoints and Associations
Market factors
Touchpoint recall overall and per brand
Touchpoint evaluation
Calibration questions
Imagery attribute association
212 The automotive category landscape
Sample profile Automotive (max 6.1m): personal demographics
  18 years or older, metro, drive a car bought new in past 5 years

*Metro area:        54%                                                            *Gender:                                     *Race:         (9%)

               (58%)                                                                                                                                             (46%)
                                                                                                                                                   9
                                                                                                                                 (15%)                               Black
                                    GP                                            47%          53%                                       15
                                                  5%                                                                                                                 White
                                FS                (2%)                                                                                                      46
                                         KZN
                                                                                                                                                                     Coloured
                                                                                                                                                                     Indian/Asian
                                                 12%                                                                             (30%)        30
                               EC                (12%)
               WC                    6%                                          (47%)         (53%)
   22%                               (6%)
   (22%)
                                                                                                                       Language:

               Age:                                                                                     English                                        33
                                                                                                       Afrikaans                         22
                                                                                                    IsiZulu/Zulu                   16
               6          32                        48                14
                                                                                                IsiXhosa/Xhosa              8

               18-24 years      25-34 years     35-49 years   50+ years            Sesotho/Southern Sotho/Sotho             8
                                                                                          Sepedi/Northern Sotho         6
                                                                                                                                45% vernacular
                   Average age (mean) = 39 years                                              Setswana/Tswana          5
                                                                                               Xitsonga/Tsonga     1

                                    *Based on the Establishment Survey metro car owners profile (Jul’17-Jun ‘18). ES metro car owners profile (18 yrs+)                             23
                                    %s in pink text
Sample profile Automotive: socio-economic demographics
New car owners are working, educated with high incomes. Nine in 10 are SEM SG4 and SG5
Work status: 1 1 2 Working Monthly household Income:
51% >R20K
Student
Retired 13 30 40 11 15
Other non-
98 working Less than R6k R6k-R10k R10k-R20k R20-R40k R40k+ DK/refused
Average (mean) = R27K
Education: 5 Supergroup SEM:
Other post-
11
12 matric
Post- 41
22 graduate
18 Some
university +
48
Matriculated
52% post-matric 44
Some high Supergroup 3 (31-65)
school Supergroup 4 (66-85)
4
Supergroup 5 (86-100)
24Automotive market landscape: behavioural context
Volkswagen and Toyota dominate
Top of mind awareness Currently, personally driving % Total consideration set %
1. Volkswagen 19% (1.1 avg.) (2.6 makes avg.)
2. Toyota 19%
3. BMW 13% Volkswagen 23 Volkswagen 40
Toyota 22 Toyota 38
Ford 10 BMW 27
Hyundai 9 Ford 23
Type of car current driving BMW 8 Audi 22
Kia 6 Hyundai 20
(%) Audi 4 Mercedes Benz 16
47 Mazda 4 Kia 13
Renault 4 Mazda 10
35 Nissan 4 Nissan 9
Mercedes Benz 4 Renault 7
Opel 3 Best rated at Land Rover 6
Honda 3 Honda 5
Suzuki 1
9.2/10 Opel 5
9 Volvo 1 Volvo 4
5
2 2 1 1 1 Land Rover 1 Jaguar 3
Peugeot 1 Suzuki 3
Datsun 1 Datsun 1
Jaguar 0 Peugeot 1
Other 3 Other 4
Base: n=1000 25Automotive market: Media landscape – P7D reach
Almost two-thirds are reading newspapers on a weekly basis; four in ten reading magazines – compared to 52%
and 24%, respectively in Establishment Survey Jul17 - Jun18
Past 7 Day media reach
99
90 90 88
64
42
Watched TV Listened to radio Read or paged Read or paged Accessed the Went onto social
through a through a internet media
Source: Establishment Survey Jul17-Jun18
newspaper on magazine on
paper OR online paper OR online
Base: n=1000 26Automotive market landscape: brand equity drivers (emotional)
Being value for money and having high safety standards are the key drivers of brand equity in the auto market,
supplemented by trust, comfort as well as badge effect. Consumers consider advertising to be less important in
driving equity/brand desire
Is good value for money
Most important to
Has very high safety standards
drive brand equity
Never lets you down
Is exciting
Make comfortable cars for all passengers
Is for people like yourself
Makes cars with distinctive style
You are proud to be seen driving
Makes technologically advanced cars
Is environmentally responsible
Is innovative in introducing new ideas
Is for people on their way up in life
Is becoming more popular
Is recommended by your friends and family
Sponsors things of interest to you
Their advertising provides you with important information
Their advertising is entertaining
Least important to
Their advertising is relevant and useful to you
drive brand equity
Base: n=1000 27Automotive market landscape: brand equity drivers – brand performance
Toyota and Audi are not being perceived as offering any of the top drivers
Mercedes
Attributes based on importance Volkswagen Toyota BMW Audi Ford Hyundai Benz Kia
Is good value for money
Has very high safety standards
Never lets you down
Is exciting
Make comfortable cars for all passengers
Is for people like yourself
Makes cars with distinctive style
You are proud to be seen driving
Makes technologically advanced cars
Is environmentally responsible
Is innovative in introducing new ideas
Is for people on their way up in life
Is becoming more popular
Is recommended by your friends & family
Sponsors things of interest to you
Their advertising provides you with nb info 18 20 14 5 7 9 8 6
Their advertising is entertaining
Their advertising is relevant & useful to you
Strong Average Weak Benchmark: Brand equity
SAMPLE SIZE: n. 1000 // CUSTOM FILTERS APPLIED: None // Benchmark for Performance: Brand equity
28Automotive market landscape: media investment by brand
Toyota, Mercedes and Ford were the highest spenders in print in August-November 2018
Rand
120000000
*Media Spend by Brand
100000000
Print
FORD R2 750 394
80000000 Other
VOLKSWAGEN R685 155
Out of Home
HYUNDAI SA R95 566
60000000
Print
RENAULT R371 217
Radio
TOYOTA R7 298 170
TV
40000000
AUDI R1 468 782
KIA MOTORS R844 485
20000000 MAZDA R578 806
MERCEDES BENZ R5 740 637
0
FORD VOLKSWAG HYUNDAI RENAULT TOYOTA AUDI KIA MAZDA MERCEDES
EN SA MOTORS BENZ
* Adex August-November 2018 29Automotive market landscape: Print ads
Combination of emotional messaging, direct targeting, styling and price
30Automotive market landscape – major print titles*
Specialist interest titles and supplements top the titles list for August-November 2018
R17m R13m
BUSINESS DAY MOTOR NEWS R3 098 322 CAR R1 874 660
THE STAR MOTORING (THUR) R1 758 216 GO! DRIVE&CAMP R861 168
SUNDAY TIMES R1 306 800 WEG RY&SLEEP R777 067
SUNDAY TIMES BUSINESS TIMES R951 210 MEN'S HEALTH R766 608
RAPPORT MAINBODY R870 375 CARAVAN & OUTDOOR LIFE R710 245
THE STAR MF R555 632 TOYOTA CONNECT R514 020
CAPE TIMES MON-FRI R512 880 GQ SOUTH AFRICA R473 100
CITY PRESS R469 558 GETAWAY MAGAZINE R411 830
CITIZEN MF R466 993 WEG R365 766
*Adex August-November 2018 31Automotive market landscape – major TV campaigns*
Weddings feature in 2 of the major auto campaigns
Ford Ranger Hyundai i20 VW Tiguan
1107ARs 640ARs 354ARs
https://www.youtube.com/watch?v=JT6Wqe https://www.youtube.com/watch?v=HfFimV https://www.youtube.com/watch?v=A-lDlIV6mLQ
slNuA 3Wujg
+ Toyota Hilux 887ARs https://www.youtube.com/watch?v=CxozxiSJDu
‘Introducing the new face of
Y&index=2&list=LLbdZjWzvTF8LJsZBcqkgCpA&
tougher-er’ t=0s
*Post Campaign August-November 2018 R16K+ HHI 32What does the modelling reveal in the automotive category?
Reminder of the 23 touchpoints – all the ways where consumers can come into contact with an
auto brand/make
             Media/Paid                                       Owned                                    Earned
 Digital                                        Digital                                      Digital
            • Online advertising (e.g. banner             • Online video ad (e.g. YouTube)                 • Social media (e.g. Facebook)
              ads, pop ups)
                                                          • Car website                                    • Online sales (e.g. AutoTrader,
                                                                                                             Cars.co.za, Gumtree)
 Traditional                                    Traditional
           • Outdoor advertising (e.g.                                                                     • Online websites
             billboards, street signs)                    • Call centre
                                                                                             Traditional
            • Print advertising (e.g.                     • Car dealer staff                               • News coverage
              newspapers, magazines, inserts)
                                                          • Dealer showroom                  Other
            • TV advertising                                                                               • Word of mouth conversation
                                                          • Catalogues and leaflets
            • Radio advertising                                                                            • Recommendation from family and
                                                          • Test report                                      friends
            • Sponsorship
                                                Other                                                      • Personally drive
            • Moving vehicles (e.g. taxis,                • Test drive
              buses)                                                                                       • Seen car on street

                                                                                                                                          34
Connect modelling: What proportion of brand equity is due to recent touchpoint experience?
In the automotive market, a very high 22.0% of brand equity is driven by recent touchpoint experiences
Relative impact of recent
touchpoint experiences
Brand stock
Brand equity before recent touchpoint experiences
78.0
Touchpoint Impact
22.0 Brand equity from recent touchpoint experiences
35What is touchpoint impact on specific brands’ equity?
Suzuki, Mercedes and Nissan are benefiting most from recent touchpoint experience
Impact by brand
(Ranked on relative impact)
17,4
16,8 Average impact = 22%
3,9 3,6
10,5
2,3 8,3
7,9 7,5
6,3 1,6
1,8 13,5 1,7 13,2
5,3
1,7
3,3 1,3
8,2 3,0 2,6
6,1 5,9 6,7 1,9 2,0
0,8 1,7 0,6 1,8
0,9 4,7 1,1 4,0 0,4
0,9 0,3 0,3 0,4
2,5 0,4 2,4 2,2 0,3 0,3
0,4 0,3 1,4 0,2 1,6 1,5 1,5
0,5 0,9 0,7 0,0
0,2 0,0
0,3
Mercedes Volks- Land
Suzuki Benz Nissan Volvo Kia Audi wagen Hyundai BMW Toyota Rover Mazda Ford Jaguar Honda Renault Opel Datsun Peugeot Other
40% 26% 25% 24% 24% 23% 22% 22% 22% 22% 22% 21% 19% 18% 17% 15% 15% 14% 5% 23%
Relative Touchpoint impact
Brand experience Brand stock
36What are the key touchpoints driving the automotive category?
Top 10 touchpoints contribute 71% of overall impact on brand equity. Print is number 9 overall. Most of the top 10
are Earned touchpoints. Social media is the only Digital touchpoint in the top 10
1 Car on street Media/Paid
2 TV ad Owned
3 Personally drive Earned
4 Word of mouth
71%
5 Recommendation
6 Test drive
7 Showroom
8 Car dealer staff
9 Print ad
10 Social media
37What are the key touchpoints driving the automotive category?
Print is the second highest Media/Paid touchpoint after TV, whereas Online ads in this category are the weakest
touchpoint. Combined – Media accounts for 27% of the impact, similar to all Owned touchpoints. Overall, Digital
is low
Automotive touchpoints Combined relative %
Car on street 14,8%
TV ad 10,3% Media/Paid 27%
Usage - car 8,2%
WOM 7,9% Owned 25%
Recommendation 7,2% Earned 48%
Test drive 5,6%
Showroom 4,9%
Car dealer staff 4,6% Traditional 44%
Print ad 4,5%
Social media 3,4% Digital 13%
Outdoor ad 3,3% Other 44%
Radio ad 3,2%
News coverage 2,6%
Catalogues 2,6% TV/Print 15%
Online sales 2,3% Read: Seeing a ‘car on the
Call centre TV/Radio 14%
2,2% street’ yields the greatest
Online websites - Auto 2,0% TV/Outdoor 14%
Test report 1,9% impact on brand equity in the
Print/Online ads 6%
Moving vehicle (Taxi/ Bus) 1,8% Automotive category at 14.8%
Sponsorship 1,7% share of impact”
Car website 1,7%
Online vid ad 1,6% Of note: Impact of Auto Print in SA is
Online ad 1,6%
higher than global norm of 2.5%
38Proving effectiveness: Print in synergy with other touchpoints
TV ads 17% more impactful in combination with print
+17% +25%
Index – TV
only at 100
39What are Media/Paid touchpoint synergies with TV and Online?
TV+Print+Online delivers a 25% incremental impact to TV alone, whereas TV+Print (no Online) yields a 17%
uplift. This compares to only 12% for TV+Radio (no Online).
Most notably, TV+Online (no Print) yields weaker results than TV on its own – indicating a TV to digital strategy in
this category without Print is ineffective.
Synergies: TV/Print/Online (Indexed) Synergies: TV/Radio/Online (Indexed)
125
117 119
112
100 100 105
Read: TV and Print (no 84
Online) indexes at 117
compared to TV only (no
Print or Online) at 100
TV only, no TV and Print, TV and TV and Print TV only, no TV and TV and TV and
Print or no Online Online, no and Online Print or Radio, no Online, no Radio and
Online Print Online Online Radio Online
40What is the relative impact of Media/Paid touchpoints per brand?
Across the top 5 brands, Print performs better than Radio and Outdoor
Volkswagen Toyota BMW Ford Hyundai
% Relative Impact (19% share) (17% share) (9% share) (9% share) (8% share)
11,6 10,1
TV ad 10,3% 9,1% 10,0%
% %
Print ad 5,2% 4,5% 5,4% 4,4% 3,3%
Outdoor ad 3,7% 3,9% 3,0% 1,9% 1,4%
Radio ad 3,4% 3,8% 2,0% 3,1% 2,6%
Moving vehicle 2,0% 4,1% 1,2% 1,8% 0,8%
Sponsorship 1,6% 2,2% 2,0% 1,7% 2,2%
Online ad 1,2% 1,7% 1,8% 1,0% 1,2%
% relative impact (netts)
TV/Print 15.5% 13.6% 15.4% 16.0% 13.4%
TV/Radio 13.7% 12.9% 12.0% 14.7% 12.7%
TV/Outdoor 14.0% 13.0% 13.0% 13.5% 11.5%
41How does Print perform across brands? – Relative impact within brands
On a relative basis, print has the greatest impact for Land Rover and Peugeot, followed by Honda, BMW,
Volkswagen and Suzuki
% Relative impact by brand Print Ad Average
Land Rover 8
Print Spend* Print share of
Peugeot 6,7 Aug-Nov brand media
Honda 5,7 2018 spend*
BMW 5,4
LAND ROVER R134,162 1%
Volkswagen 5,2
Suzuki 4,9 PEUGEOT SA R1,079,939 15%
Mercedes Benz 4,6 HONDA R283,693 50%
Nissan 4,5
Toyota 4,5 Read: Print ads contribute BMW R1,409,658 10%
Ford 4,4 8.0% of all recent touchpoint VOLKSWAGEN R685,155 1%
Audi 4,3 impact for Land Rover
SUZUKI SA R636,779 3%
Jaguar 4,1
Mazda 4
Volvo 3,9
Kia 3,8
Hyundai 3,3
Datsun 2
Opel 1,8
Renault 1,3 Print Ad Impact
SAMPLE SIZE: n. 1000
*Adex August-November 2018 42Proving effectiveness: Print Return of Investment
Investment is 5 x more efficient in comparison to radio (5:1 vs 1:1 Ratio)
% of total spend % of total touchpoint
in market impact
TV
45
Radio 78
14
Print
x5 20
Out of
Home 14 22
4 4
R689 million
Note: All spend levels are rate card from Nielsen’s Adex and * Adex August – November 2018 Excludes Cinema and Direct Mail
43
may not represent actual (discounted) spend by marketersWhich brands are enjoying relative efficiency of investment in print ads?
Hyundai, Volkswagen and Land Rover are greatly over-indexing on their relative investment
Share of Print ads impact Share of Print ads REMI (Relative efficiency
on Brand Equity (%) investment (%) of marketing investment)
Hyundai 5,6% 0,4%
14,7
Volkswagen 20,2% 2,7%
7,5
Land Rover 3,0% 0,5%
5,6
Jaguar 0,6% 0,2% 2,9
BMW 12,7% 5,6% 2,3
Volvo 1,1% 0,6% 1,9
Honda 1,9% 1,1% 1,7
Kia 4,8% 3,3% 1,4
Audi 7,7% 5,8% 1,3
Mazda 2,6% 2,3% 1,1
Print ad impact share Print ad investment share 1.00
REMI > 1.00
44Which brands are suffering from not receiving relative efficiency of investment
in print ads?
Peugeot, Mercedes, Renault and Opel are receiving poor ROI for their print advertising
Share of Print ads impact Share of Print ads REMI (Relative efficiency
on Brand Equity (%) investment (%) of marketing investment)
Peugeot 0,1% 4,3%
0,03
Mercedes Benz 7,8% 22,7%
0,34
Renault 0,5% 1,5%
0,35
Opel 0,5% 1,4%
0,35
Toyota 16,5% 28,8%
0,57
Ford 7,2% 10,9%
0,66
Suzuki 1,8% 2,5%
0,70
Nissan 3,8% 5,4%
0,70
Print ad impact share Print ad investment share 1.00
45What brands have higher efficiency in Print vs. other media?
Five brands have more efficient print investment than radio currently, including BMW
Low REMI High REMI
Read: “BMW has a higher REMI
for Print than it does for Radio”
46+
What is the contribution of Media/Paid touchpoints to market share and brand equity?
Print continues to be the second highest Media touchpoint behind TV that drives both brand equity as well as
sales (market share)
Direct impact on Market Share (average impact)
3 Sales drivers Sales + Brand drivers
2,5
2
TV ad
1,5
1 Print ad
Outdoor ad
0,5 Radio ad
Moving vehicle
Sponsorship
Online ad
Brand drivers
0
No drivers
0 0,5 1 1,5 2 2,5 3 3,5
Direct impact on Brand Equity (average impact)
47Proving effectiveness: Efficiency of print investment for Toyota
Toyota is largest spender – but generates comparatively little impact with print
VOLKSWAGEN TOYOTA BMW
% of total print investment in 3% 29% 6%
market
% of total print impact in market 20% 17% 13%
Ratio – Impact vs Investment 7,5 0,6 2,3
48What is driving print ads’ impact per brand? Quality of the experience or recall?
Suzuki and Land Rover lead on the quality of their print ad impact. Volkswagen enjoys both high recall and high
quality. Toyota has high recall but falls down on the ads resonating with consumers
Quality vs. recall of print ads by brand
2,5
Highest Quality
2,0 Suzuki Print ad
Suzuki
Land Rover Mercedes BMW
Quality of touchpoint experience
Land Rover
Nissan
1,5 Volkswagen
Honda Other Brands Volkswagen
Honda
1,0 Mercedes Benz
Best in Class
Nissan
0,5 BMW
Audi
0,0
0% 2% 4% 6% 8% 10% 12% 14% 16%
Bubble size = recall x
quality
-0,5
Recall of touchpoint
49How to improve Print’s assets? Recall or quality?
On a total touchpoint level, Print ad’s impact is largely driven by recall.
Quality of the experience is generally lower for Print than Radio across all brands with the exception of BMW and
Mercedes. What are they doing right?
Quality vs. recall of all touchpoints – total category
2,5
Increase Recall Maintain
Car on street
2,0
Brand:
Quality of touchpoint experience
TV ad
Usage - car
Total
WOM
Test drive Recommendation
1,5 Call centre
Radio ad Showroom
News coverage Social Media Car dealer staff
Print ad
Online websites - Auto
Test report Online sales Outdoor ad
1,0 Moving vehicle
Online ad Catalogues
Online vid ad Sponsorship
Car website
0,5
De-Prioritize Increase Quality
0,0
0% 20% 40% 60% 80% 100% 120% 140% 160% 180%
Recall of touchpoint
50Recent BMW ads
51Recent Mercedes Benz ads
52Land Rover and Suzuki
53Learnings about print advertising creative
Best practices for print advertising
Hook readers with a visual impact
Get them that has a link to brand and
hooked message
Ensure creative is relevant to brand
Ensure message
is relevant & message and is not confusing
Keep it Keep it simple and clutter-free
simple
Keep it fresh via changing the copy
Keep it
fresh over time to avoid wear-out
Create synergy and consistency
Synergy & across print ads and with other
Consistency
media
Source: Kantar Millward Brown Communication Learnings Across Media April 2018 541. Get them hooked: Notice, Stop, Engage, Branded Memories 2. Ensure message is relevant: Not confusing
Source: Kantar Millward Brown Communication Learnings Across Media April 2018 553. Keep it simple: And clutter-free 4. Keep it fresh: Avoid wear out
Source: Kantar Millward Brown Communication Learnings Across Media April 2018 565. Synergy and consistency: Aids branding & awareness Best Practice: Impact vs. Persuasion
Source: Kantar Millward Brown Communication Learnings Across Media April 2018 57What do we need to do to increase investment in reading touchpoints in the Automotive
category?
Some thought starters …
• Need to leverage the relatively high ROI vs. Radio
• Need to leverage the TV+Print+Online synergies and ensure
consistency across these touchpoints
• Need to have targeted brand discussions about maximising
effectiveness around allocation of media mix
• Need to have targeted brand discussions with some brands
around the quality of the creative, and with others about
increasing recall
• Need to leverage the key drivers of brand equity, especially
badge effect and value
583 Some concluding thoughts
Some questions to consider for 2019 and beyond?

 •   Is TRUST indeed the word of 2019?
 •   Beyond the auto category (which has a high SEM profile)
     are we effectively segmenting by SEM Supergroups?
 •   Are individual brands maximising reading touchpoints
     effectively and efficiently within the media mix?
 •   Can magazines be utilised more to drive consumer
     relationships with higher SEM groups?
 •   Do creative agencies actually know how to make
     resonating print ads? Online ads?
 •   In SA, are we doing enough to innovate within this
     industry?

                                                               60
Key Learnings
Focusing on three key points, tailored to suit each brand‘s story
1 2 3
Opportunities for individual
Print is the second-most Print boosts the impapt of TV - brands
impactful paid touchpoint in it is especially impactful in
automotive – and offers great combination with TV and - Greater investment to boost
ROI Online contacts/ recall?
- Re-allocate budget from less-
effective touchpoints?
- Improve quality?
61You can also read