Twitter-Derived Measures of Economic Uncertainty
←
→
Page content transcription
If your browser does not render page correctly, please read the page content below
Twitter-Derived Measures of Economic Uncertainty
              Scott R. Baker,a Nicholas Bloom,b Steven J. Davisc and Thomas Renaultd

                                             May 13th 2021

Abstract: We construct daily, weekly, and monthly Twitter Economic Uncertainty (TEU) indicators from
2011 onwards based on counts of tweets about the "economy" and "uncertainty.” We use geotagged tweets
and users’ location inference based on friendships to construct a TEU index based on tweets sent by users
located in the United States. Our TEU indicator behaves similarly to the newspaper-based Economic Policy
Uncertainty index of Baker, Bloom and Davis (2016), which suggests that Twitter users and journalists
have similar perceptions about the evolution of economic uncertainty.

JEL Codes: G12, G17, E58, E62
Keywords: Twitter, economic policy uncertainty
Acknowledgements: We gratefully acknowledge the National Science Foundation for financial support.

a
        Kellogg School of Management, Northwestern University and NBER
b
        Stanford University and NBER
c
        Chicago Booth School of Business, Hoover Institution, and NBER
d
        Centre d'Économie de la Sorbonne (CES), Université Paris 1 Panthéon-Sorbonne

                                                                                                       1
1 - Introduction
The COVID-19 pandemic triggered an extraordinary surge in economic uncertainty and stock market
volatility (Altig et al., 2020 and Baker et al., 2020). Especially in a crisis, the real-time tracking of
(perceptions about) economic uncertainty can serve as useful inputs into the design of policy and
assessments of whether policy actions diminish or intensify perceived uncertainty. Motivated by these
observations, we develop a measure tracking perception about economic uncertainty using text messages
transmitted on the Twitter social network.
Twitter data offer some attractive features for our purposes. First, the volume of available tweets is
enormous: 22% of US adults have used Twitter and about 500 million messages are sent per day on the
platform1. Second, Twitter lets us capture the beliefs and opinions of a broad cross-section of social media
users rather than, say, journalists or experts. Third, tweets come with a precise timestamp and cannot be
revised or edited. This last feature is especially useful in constructing high-frequency indicators and in
relating tweet-based measures to near contemporaneous developments and financial market responses.
Fourth, the influence or the relevancy of each message can be captured by its number of retweets and allows
the construction of weighted indicators of uncertainty.
Twitter data also have drawbacks. First, Twitter was created in 2006, and the volume of tweets was small
before 2010. Thus, our Twitter-based indicators span roughly a decade rather than the several decades or
even centuries covered by some newspapers. Second, Twitter users are not representative of the US
population: they skew younger and more towards Democrats than the public. Third, tweets are very short
(280 characters maximum) and more informal than newspaper articles, regulatory filings, Federal Reserve
Beige Books, and earnings conference calls – all of which have been used to quantify concepts related to
economic uncertainty and stock market volatility. See, for example, the use of newspapers and Beige Books
in Baker, Bloom and Davis (2016), earnings calls in Hassan et al. (2019), and regulatory filings in Baker et
al. (2019). Last, social networks like Twitter are susceptible to manipulation by online bots (automated
message posting) and the diffusion of false information (Allcott and Gentzkow, 2017, Allcott et al., 2019,
Bovet and Makse, 2019, and Cinelli et al., 2020).
To better understand how the pros and cons of Twitter data can influence derived metrics of uncertainty,
we propose in this paper a comparison of Twitter-based uncertainty indicators with newspaper-based
uncertainty indicators. We construct a database of more than 14 million tweets that contain a keyword
1
https://www.pewresearch.org/fact-tank/2019/04/10/share-of-u-s-adults-using-social-media-including-facebook-is-
mostly-unchanged-since-2018/
2related to “uncertainty” that were sent on Twitter between June 1st, 2011 and March 1st, 2021. We take
advantage of the recent change on the Twitter platform and the opening - in January 2021 - of access to the
full history of public conversation for academic researchers.2
Since the location of all users is not available on Twitter, we implement an inference method based on
friendships to construct country-level indices. We train a Random Forest Classifier on 20,000 users with a
known location - derived from geotagged tweets - to predict the location of all non-tagged users in our
sample. Then, we analyze the evolution of the number of messages containing both a keyword related to
the economy and a keyword related to uncertainty to construct our daily Twitter Economic Uncertainty
(TEU-USA) indicator for the United States. We also construct a retweet-weighted variant of the indicator
and a scaled-index to consider the variation in Twitter usage over time.
We find a high correlation between our TEU-USA indicator and the US Economic Policy Uncertainty of
Baker et al. (2016) based on the Newsbank newspapers. The correlation is equal to 0.73, 0.87, and 0.90 at
a daily, weekly, and monthly frequency, respectively. The broadly consistent movements in uncertainty
measures based on tweets, newspapers, financial markets, and business surveys reassure us that our
quantification of Twitter messaging content yields informative uncertainty indicators.
The remainder of the paper is organized as follows. Section 2 presents the data and methodology. Section
3 presents the results and Section 4 concludes.
2 - Methodology and data
In January 2021, Twitter opened its full tweet archive to academic researchers. We use the Twitter API to
extract all tweets - in English - containing one keyword related to uncertainty (U). We consider the four
following keywords: “uncertain”, “uncertainly”, “uncertainties”, “uncertainty”. For each tweet, we extract
the tweet content, the date of the tweet, the name of the user, the number of likes, and the number of
retweets. We end up with a database of 14,440,856 original tweets (without retweets) sent by a total of
4,828,235 distinct users from June 1st, 2011 to February 28th, 2021. Figure 1 presents the evolution of the
total number of tweets in our sample. The month with the highest number of tweets (520,533 tweets) is
March 2020 at the beginning of the COVID-19 pandemic in the United States.
2
https://blog.twitter.com/developer/en_us/topics/tools/2021/enabling-the-future-of-academic-research-with-the-
twitter-api.html
3Figure 1 - Number of uncertain* tweets
Notes: Monthly number of tweets containing the keywords “uncertain” and variants.
Our database includes all tweets in English, including English language tweets from uses outside the United
States (e.g. Canada, UK, Australia, India etc). To prevent our indicator from being biased by important
events outside the United States (such as Brexit), we infer the location of each message based on user
relationships as in Davis & al. (2011).
Only a small proportion of tweets are geotagged as users must opt-in to add location information to their
tweets. According to the Twitter FAQ, “This feature is off by default and you will need to opt in to use it.
This allows Twitter to collect, store, and use your precise location, such as GPS information.” However,
this sample of geolocalized tweets can be used to train a supervised classification algorithm to infer the
location of users who do not opt in to add location information to their tweets by examining who they
follow. The intuition of this approach is that users from the same country are more likely to follow particular
accounts on Twitter. For example, for US geocoded users the five most common accounts that are followed
over this period were Barack Obama, Joe Biden, The New York Times, Kamala Harris and Alexandria
Ocasio-Cortez. In comparison for UK users the top five were BBC Breaking News, Barack Obama, BBC
News (UK), Stephen Fry and The Guardian.
4We use the Twitter API to extract the localization information for all geotagged tweets in our sample. We
find that 2.7% of the tweets are geotagged: 47% of the geotagged tweets were sent by users located in the
United States, 18% by users located in Great Britain and the remaining in other English-speaking countries
(e.g. Canada, Australia, New Zealand, and India). Appendix A presents the 50 most represented locations
(city or states) in our sample of geotagged tweets.
We select randomly 20,000 users with a known location, and we split our sample into a training (in sample)
dataset of 16,000 users and a testing (out of sample) dataset of 4,000 users. For all those users, we use the
Twitter API to extract the list of accounts that each user is following. The median number of users followed
is 610. We remove accounts of users with less than 50 accounts followed (4% of all accounts). Appendix
B presents the 50 most followed accounts by Twitter users in the USA and in the UK.
We then consider the 10,000 most followed accounts as our features (independent variables) and we train
a Random Forest classifier to predict the location of each user. We consider a binary classifier: the two
classes are “US” and “NON-US”. We train the classifier on our training dataset and we use the model to
classify users in the testing dataset. We compute the accuracy of the classification as the percentage of users
correctly classified in the out-of-sample dataset. Table 1 presents the confusion matrix.
Table 1 - Confusion Matrix
Actual class
NON-US US
Predicted NON-US 1648 205
class
US 220 1765
Notes: This table shows the confusion matrix on the testing dataset of 3,838 users (162 users were removed
as they follow less than 50 accounts). A total of 3,413 users (1648+1765) were classified correctly.
5The accuracy of the classifier on the training dataset is equal to 88.9%. This result - and the analysis of the
confusion matrix - confirms that location can be inferred from the user's relationships with a reasonable
level of confidence.3
To construct our TEU-USA indicator, we utilize the following methodology. We first tokenize and
lowercase all tweets in our sample. Then, we count the frequency of tweets containing a keyword related
to the economy (E) and uncertainty (U). We use the following list of words:
(E) : ['economic', 'economical', 'economically', 'economics', 'economies', 'economist', 'economists',
'economy']
(U) : ['uncertainty', 'uncertain', 'uncertainties', 'uncertainly']
After removing duplicate tweets, we end up with a total of 317,112 tweets containing an (E)+(U)
combination. Then, for each user who sent a (E)+(U) tweet, we use the Twitter API to extract the list of
accounts they are following, and we use our Random Forest classifier to infer the location of his tweets (US
or NON-US). We filter out NON-US tweets and we aggregate the data at a daily frequency (US/Eastern
time zone). We rescale each series to a mean of 100 from June 1st, 2011 to December 31st, 2019.
Twitter Economic Uncertainty
Figure 1 presents our TEU-USA indicator at a monthly frequency and compares it to the Economic Policy
Uncertainty (EPU-USA) index of Baker et al. (2016), which derives from article counts in daily US
newspapers archived by the Access World News NewsBank service. Here and throughout the paper, we
renormalize the EPU-USA and other measures to a mean of 100 from January 2011 to December 2019 to
facilitate comparisons to our Twitter-based measures.
3
Even for users for which we infect the wrong geocode – for example a user in the UK who mainly follows US
Twitter accounts – the error may not be so problematic for our analysis. This example user would be more likely to
be US focused, for example a US citizen living in the UK, so their tweets are likely relatively more informative
about the US economic situation that the typical tweet from a UK user.
6Figure 1 – TEU-USA versus the EPU-USA – Monthly
Notes: Monthly TEU-USA and EPU-USA indexes from June 2011 to February 2021. Indexes are
renormalized to a mean of 100 from January 2011 to December 2019.
The TEU-USA indicator rose sharply during the US debt ceiling crisis in summer 2011, around the Brexit
referendum in June 2016, when US-China trade conflicts intensified in 2018-19, and – most dramatically –
as the COVID-19 crisis escalated in March 2020. Compared to the EPU-USA index, the TEU-USA measure
exhibits larger peaks during those periods. The time-series correlation between the monthly TEU-USA and
EPU-USA measures is 0.90.
We also analyze the evolution of the TEU-USA indicator at a daily frequency before and after the COVID
pandemic. To consider the intra-week seasonality - the volume of uncertain* tweets is on average two times
lower during the weekend than during the weekdays - we scale our daily index by the average number of
tweets for each day of the week during the year 2019. Figure 2 compares the daily TEU-USA and the daily
EPU-USA from January 2019 through February 2021.
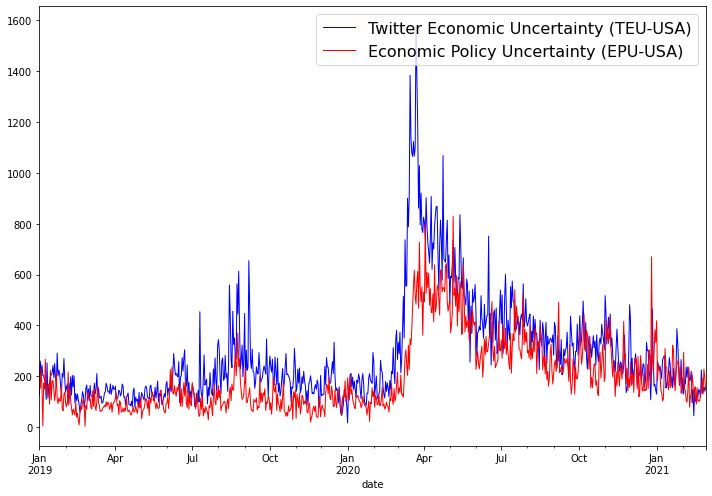
7Figure 2 - TEU-USA versus the EPU-USA – Daily
Notes: Daily TEU-USA and EPU-USA indexes from January 2019 to February 2021. Indexes are
renormalized to a mean of 100 from January 2011 to December 2019.
The TEU-USA indicator begins its sharp rise in late February, weeks after the pandemic erupted in China.
TEU-USA peaked in the week of 16 March 2020. Both time series are currently - in February 2021 - close
to their pre-COVID level of Uncertainty in January 2020. However, the TEU-USA indicator exhibits a
larger spike in early and mid-March, and there are some clear differences in how the two measures move
in 2020. The time-series correlation between the monthly TEU-USA and EPU-USA measures is 0.73 (in
the full sample period).
Variants of the TEU-USA indicator
We also propose three variants of the TEU-USA indicator. First, to consider the variation in the total number
of tweets during our sample period, we propose a scaling index based on the evolution of the number of
tweets - in English - containing the keyword “have” during a one second period on each day between June
1st, 2011 and February 28th, 2021. As reported in a Washington Post article, Twitter sees record number of
8users during the COVID pandemic, and the increase in the number of tweets might bias our indicator. 4
Second, we propose a weighted TEU index by considering the number of retweets of each message (1 +
log(1+ retweets)).5 The number of retweets of a message can be considered as a measure of influence (Cha
et al., 2011)6. Last, we also present our indexes when we consider all messages in English (and not only
messages from users located in the US). We call those indexes respectively TEU-SCA (scaled index), TEU-
WGT (weighted index) and TEU-ENG (index based on all English tweets).
Table 2 presents the correlation - at a daily frequency - between the EPU-USA, the TEU-USA, the TEU-
SCA, the TEU-WGT and the TEU-ENG.
The maximum correlation with the EPU-USA is achieved by the TEU-USA index. This result holds when
we consider data at a weekly frequency and at a monthly frequency. Our methodology to derive user’s
location from followership increases the correlation between EPU-USA and TEU-USA by about 8
percentage points compared to the TEU-ENG (based on all English tweets regardless of user location). All
indexes are available on the website: https://www.policyuncertainty.com/
Table 2 - Correlation Matrix
EPU-USA TEU-USA TEU-SCA TEU-WGT TEU-ENG
EPU-USA 1 0.73 0.37 0.73 0.68
TEU-USA 0.73 1 0.58 0.99 0.93
TEU-SCA 0.37 0.58 1 0.48 0.49
TEU-WGT 0.73 0.99 0.48 1 0.93
TEU-ENG 0.68 0.93 0.49 0.93 1
Notes: Correlation matrix of the EPU-USA with four variants of our Twitter-based uncertainty index.
4
https://www.washingtonpost.com/business/economy/twitter-sees-record-number-of-users-during-pandemic-but-
advertising-sales-slow/2020/04/30/747ef0fe-8ad8-11ea-9dfd-990f9dcc71fc_story.html
5
We do not consider the number of likes per message due to a change on Twitter policy in 2015 when Twitter
"favorite" function was renamed "like" causing a change in the behavior of users.
6
We use the logarithm of the number of retweets as the correlation with the EPU-EPU was much higher (0.73) than
when we use the raw number of retweets (0.25).
9Conclusion
We construct simple measures of economic uncertainty using tweets (short text messages) transmitted over
the Twitter social media network. Our Twitter-based measures move broadly in line with conceptually
similar measures derived from newspapers, financial markets, and business surveys. That gives confidence
that our Twitter-based measures offer a useful window into perceptions of economic uncertainty and their
evolution over time.
Unlike most other uncertainty measures, Twitter-based measures reflect the perceptions and expressed
views of a broad cross-section of social media users, which can differ from those of journalists, experts,
business leaders, and financial market participants. In this regard, Twitter-based uncertainty measures may
behave more similarly to measures derived from household surveys. We plan to investigate whether
Twitter-based measures can substitute for and enhance measures of economic uncertainty, anxiety and
related concepts that are traditionally derived from household surveys. See, for example, Guiso et al. (1996),
Dominitz and Manski (1997), Manski (2006), Giavazzi and McMahon (2012), and Itzhak et al., (2018).
Compared to measures derived from household surveys, Twitter-based measures offer potentially large
advantages in volume, timeliness, and lower data collection costs.
Other avenues for future research include the usefulness of Twitter-based indicators for nowcasting and
real-time prediction and the construction of uncertainty measures for groups of Twitter users defined by
political leanings and other characteristics.
10References
Allcott, Hunt, Matthew Gentzkow and Chuan Yu, 2017. “Social Media and Fake News in the 2016
Election,” Journal of Economic Perspectives, 31, no. 2, 211-236.
Allcott, Hunt, Matthew Gentzkow and Chuan Yu, 2019. “Trends in the Diffusion of Misinformation on
Social Media,” Research and Politics, 6, no. 2 (April), 1-8.
Altig, Dave, Scott Baker, Jose Maria Barrero, Nick Bloom, Phil Bunn, Scarlet Chen, Steven J. Davis, Julia
Leather, Brent Meyer, Emil Mihaylov, Paul Mizen, Nick Parker, Thomas Renault, Pawel Smietanka
and Gregory Thwaites, 2020. “Economic Uncertainty Before and During the COVID-19 Pandemic,”
Journal of Public Economics, forthcoming.
Baker, Scott R., Nicholas Bloom and Steven J. Davis, 2016. "Measuring economic policy uncertainty,”
Quarterly Journal of Economics, 131, no. 4, 1593-1636.
Baker, Scott R., Nicholas Bloom, Steven J. Davis and Kyle Kost, 2019. “Policy news and stock market
volatility,” NBER working paper no. 25720.
Baker, Scott R., Nicholas Bloom, Steven J. Davis, Kyle Kost, Marco Sammon, and Tasaneeya Viratyosin,
2020. “The Unprecedented Stock Market Reaction to COVID-19,” Review of Asset Pricing Studies,
forthcoming.
Bovet, Alexandre and Hernan A. Makse, 2019. “Influence of fake news in Twitter during the 2016 US
presidential election,” Nature Communications, 10, no. 1, 1-14.
Cha, M., Haddadi, H., Benevenuto, F., & Gummadi, K. (2010, May). Measuring user influence in twitter:
The million follower fallacy. In Proceedings of the International AAAI Conference on Web and Social
Media (Vol. 4, No. 1).
Cinelli, Matteo, Walter Quattrociocchi, Alessandro Galeazzi, Carlo Michele Valensise, Emanuele Brugnoli,
Ana Lucia Schmidt, Paola Zola, Fabiana Zollo and Antonio Scala, 2020. “The COVID-19 Social
Media Infodemic,” working paper, 10 March.
Davis Jr, C. A., Pappa, G. L., De Oliveira, D. R. R., & de L. Arcanjo, F. (2011). Inferring the location of
twitter messages based on user relationships. Transactions in GIS, 15(6), 735-751.
Dominitz, Jeff and Charles F. Manski, 1997. “Using expectations data to study subjective income
expectations,” Journal of the American Statistical Association, 92, no. 439, 855-867.
Giavazzi, Francesco and Michael McMahon, 2012. “Policy Uncertainty and Household Savings,” Review
of Economics & Statistics, 94, no. 2 (May), 517-531.
Guiso, Luigi, Tullio Jappelli and Daniele Telizzese, 1996. “Income Risk, Borrowing Constraints, and
Portfolio Choice,” American Economic Review, 86, no. 1 (March), 158-172.
11Hassan, Tarek A., Stephan Hollander, Laurence van Lent and Ahmed Tahour, 2019. “Firm-Level Political
Risk: Measurement and Effects,” Quarterly Journal of Economics, 134, no. 4 (November), 2135-2204.
Itzhak, Ben-David, Elyas Fermand, Camelia M. Kuhnen and Geng Li, 2018. “Expectations Uncertainty and
Household Behavior,” 2018. NBER Working Paper 25336.
Manski, Charles F. 2004. “Measuring expectations,” Econometrica, 72, no. 5, 1329-1376.
12Appendix A - Most common places across geotagged tweets
Place State/Country Number of tweets
Manhattan NY 3767
Los Angeles CA 2872
Washington DC 2158
Chicago IL 1875
Toronto Ontario 1824
London England 1549
Florida USA 1374
Paris France 1325
Houston TX 1243
Sydney New South Wales 1231
San Francisco CA 1206
Brooklyn NY 1187
Melbourne Victoria 1139
Georgia USA 1052
California USA 1045
Seattle WA 1027
Texas USA 995
Bombay India 982
Philadelphia PA 982
Boston MA 919
Austin TX 919
New Delhi India 860
Pennsylvania USA 832
City of London London 829
San Diego CA 809
Queens NY 774
South East England 758
Manchester England 757
New York USA 742
Johannesburg South Africa 727
Notes: Number of geotagged uncertain* tweets by places (top 30 places).
13Appendix B - Most commonly followed accounts by country
United States United Kingdom
Barack Obama BBC Breaking News
Joe Biden Barack Obama
The New York Times BBC News (UK)
Kamala Harris Stephen Fry
Alexandria Ocasio-Cortez The Guardian
The Associated Press Keir Starmer
Hillary Clinton Laura Kuenssberg
CNN Breaking News UK Prime Minister
CNN Robert Peston
The Washington Post Gary Lineker
Michelle Obama Boris Johnson
President Obama Andrew Neil
President Trump 45 Archived Jon Snow
NPR Sky News
The Wall Street Journal Mayor of London
Elizabeth Warren Jeremy Corbyn
Stephen Colbert Nick Robinson
Elon Musk ALASTAIR CAMPBELL
Elizabeth Warren Joe Biden
The White House 45 Archived James O'Brien
NASA NHS Million
Ellen DeGeneres The Economist
Bernie Sanders Channel 4 News
jimmy fallon Sky News Breaking
Bernie Sanders Brian Cox
Rachel Maddow MSNBC BBC News (World)
BBC Breaking News Faisal Islam
Bill Clinton Ed Miliband
Bill Gates Carole Cadwalladr
Notes: Top 30 most commonly followed Twitter accounts by users located in the US and in the UK - based
on our sample of uncertain* tweets.
14You can also read