PTV margin determination in conformal SRT of intracranial lesions
←
→
Page content transcription
If your browser does not render page correctly, please read the page content below
JOURNAL OF APPLIED CLINICAL MEDICAL PHYSICS, VOLUME 3, NUMBER 3, SUMMER 2002

PTV margin determination in conformal SRT
of intracranial lesions
       Brent C. Parker,1,* Almon S. Shiu,1,† Moshe H. Maor,2,‡
       Frederick F. Lang,3,§ H. Helen Liu,1,储 R. Allen White,4
       and John A. Antolak1
       1
         Department of Radiation Physics, The University of Texas M. D. Anderson Cancer
       Center, 1515 Holcombe Boulevard, Houston, Texas 77030
       2
         Department of Radiation Oncology, The University of Texas M. D. Anderson Cancer
       Center, 1515 Holcombe Boulevard, Houston, Texas 77030
       3
         Department of Neurosurgery, The University of Texas M. D. Anderson Cancer Center,
       1515 Holcombe Boulevard, Houston, Texas 77030
       4
         Department of Biomathematics, The University of Texas M. D. Anderson Cancer Center,
       1515 Holcombe Boulevard, Houston, Texas 77030
       共Received 15 October 2001; accepted for publication 26 February 2002兲
       The planning target volume 共PTV兲 includes the clinical target volume 共CTV兲 to be
       irradiated and a margin to account for uncertainties in the treatment process. Un-
       certainties in miniature multileaf collimator 共mMLC兲 leaf positioning, CT scanner
       spatial localization, CT-MRI image fusion spatial localization, and Gill-Thomas-
       Cosman 共GTC兲 relocatable head frame repositioning were quantified for the pur-
       pose of determining a minimum PTV margin that still delivers a satisfactory CTV
       dose. The measured uncertainties were then incorporated into a simple Monte Carlo
       calculation for evaluation of various margin and fraction combinations. Satisfactory
       CTV dosimetric criteria were selected to be a minimum CTV dose of 95% of the
       PTV dose and at least 95% of the CTV receiving 100% of the PTV dose. The
       measured uncertainties were assumed to be Gaussian distributions. Systematic er-
       rors were added linearly and random errors were added in quadrature assuming no
       correlation to arrive at the total combined error. The Monte Carlo simulation writ-
       ten for this work examined the distribution of cumulative dose volume histograms
       for a large patient population using various margin and fraction combinations to
       determine the smallest margin required to meet the established criteria. The pro-
       gram examined 5 and 30 fraction treatments, since those are the only fractionation
       schemes currently used at our institution. The fractionation schemes were evaluated
       using no margin, a margin of just the systematic component of the total uncertainty,
       and a margin of the systematic component plus one standard deviation of the total
       uncertainty. It was concluded that 共i兲 a margin of the systematic error plus one
       standard deviation of the total uncertainty is the smallest PTV margin necessary to
       achieve the established CTV dose criteria, and 共ii兲 it is necessary to determine the
       uncertainties introduced by the specific equipment and procedures used at each
       institution since the uncertainties may vary among locations. © 2002 American
       College of Medical Physics. 关DOI: 10.1120/1.1474308兴

       PACS number共s兲: 87.53.Kn, 87.53.Ly

       Key words: margin, PTV, conformal stereotactic radiotherapy, intracranial

I. INTRODUCTION
The goal of radiotherapy is to deliver a prescribed dose to the clinical target volume 共CTV兲 while
minimizing the dose to neighboring normal tissues. This is especially important in treating brain
lesions because of the functional importance of brain tissues and structures, and the possibility of

176    1526-9914Õ2002Õ3„3…Õ176Õ14Õ$17.00                         © 2002 Am. Coll. Med. Phys.    176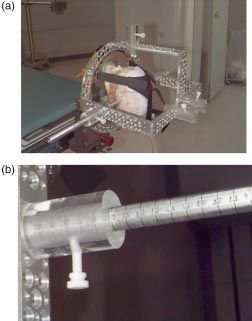
177 Parker et al.: PTV margin determination in . . . 177
neurological complications when they are irradiated.1 Achieving this goal requires an understand-
ing of the uncertainties inherent in the treatment planning and delivery process to generate a
planning target volume 共PTV兲 margin.2,3 By identifying and quantifying these uncertainties, it may
be possible to determine the required margin to ensure adequate treatment of the CTV while
minimizing toxicity to nearby normal tissues. This work examines the potential uncertainties for
conformal stereotactic radiotherapy 共SRT兲 procedures for intracranial lesions.
The Gill-Thomas-Cosman 共GTC兲 noninvasive frame is utilized for SRT patient repositioning in
order to minimize positional variations between fractions. Previous studies have shown that the
repositioning uncertainty is approximately 0.4 mm.4,5 The miniature multileaf collimator 共mMLC兲
was designed to improve small field dose conformation, especially in cases of irregularly shaped
lesions.6,7 The manufacturer has given a leaf positioning accuracy of ⭐0.5 mm, but this uncer-
tainty should be verified prior to clinical use. Image fusion, which combines the CT and MRI
images into a single image, offers the combination of improved target visualization of MRI with
the superior spatial accuracy of CT.8 –10 However, previous studies have reported that the uncer-
tainty in the CT-MRI fusion process may be as large as 1.0 mm.11
The purpose of this work was to quantify uncertainties in mMLC leaf precision, GTC head
frame reproducibility, and spatial localization of the image fusion software, and to use Monte
Carlo calculations for various margin and fraction combinations for a large patient population
from which we could recommend a minimum PTV margin for conformal SRT.
II. MATERIALS AND METHODS
A. Leaf positioning
The precision of mMLC leaf positioning was measured relative to the axis of collimator
rotation. A sheet of XV film 共Eastman Kodak, Rochester, NY兲 was placed at isocenter perpen-
dicular to the beam with 1.5-cm solid water for buildup. This setup was used to provide enough
buildup to reach electronic equilibrium without significantly blurring the field edges. Lines were
drawn on the film jacket corresponding to profiles under leaf pairs 2, 9, 16, 23, and 30 and marked
for later use in film scanning and profile measurements.
The photon jaw opposing the leaf bank to be tested was set to ⫹5.0 cm from the central axis
共CAX兲, while the photon jaw on the same side as the leaves was set to ⫺0.1 cm. The film was
exposed for 20 monitor units 共MU兲 because the XV film response is approximately linear in
low-dose regions. Therefore, 50% dose was approximately the same as 50% optical density 共OD兲,
which implied that a dose response curve for the film was not needed.
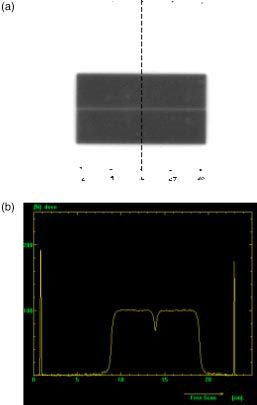
The collimator was then rotated 180° without moving either photon jaw or the film, and the
field was exposed for another 20 MU. The films were scanned and each profile was normalized to
its maximum dose. An example film image and measured profile are shown in Figs. 1共a兲 and 1共b兲.
The average full width half maximum 共FWHM兲 was determined as the distance between the 50%
dose points. Half of the FWHM was used as the photon jaw offset from the collimator axis of
rotation. The uncertainty in measurement of the profile width was 0.1 mm as determined previ-
ously by repeated measurements on a fixed field width. This process was performed four times to
determine the average measured photon jaw offset.
The photon jaw positioned at ⫺0.1 cm was then fully retracted while leaving the ⫹5.0 cm
photon jaw fixed. Another film jacket with profiles marked was placed at isocenter and the leaf
bank opposite the set photon jaw was set to ⫹5.0 cm. The film was exposed for 20 MU and the
profile width for each leaf pair was measured. The photon jaw offset previously measured was
subtracted from this profile width to give the leaf position relative to the axis of rotation. This
procedure was repeated for both mMLC leaf banks at 1 cm increments across the full range of
motion.
To evaluate the effect of gravity, leaf positioning measurements were made with the gantry at
90° and 270°. This placed the direction of leaf travel parallel to the gravitational field. A me-
Journal of Applied Clinical Medical Physics, Vol. 3, No. 3, Summer 2002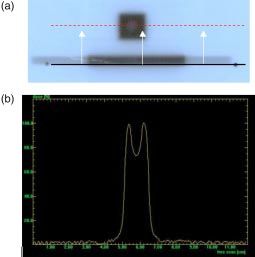
178        Parker et al.: PTV margin determination in . . .                                                             178

FIG. 1. 共Color兲 Jaw offset measurement for determining leaf position. 共a兲 Film used in a jaw offset measurement. The
profile alignment points are clearly visible. The dotted line denotes the profile shown in 共b兲. 共b兲 Profile from leaf pair 23
in the film. The leaf position being measured can be referenced to the photon jaw position to determine position relative to
the collimator axis of rotation.

chanical isocenter stand 共MIS兲 was used to verify laser alignment to isocenter prior to stereotactic
radiosurgery and radiotherapy procedures. The MIS consists of a rigid metal pole that is secured
to the floor and is capable of holding an alignment insert. The MIS was attached to the floor, and
a stereotactic radiopaque target ball was placed at isocenter. The stereotactic quality assurance
共QA兲 film holder was attached to the bottom of the mMLC. The setup for these measurements is
shown in Figs. 2共a兲 and 2共b兲. The holder is designed to hold a small piece of film, approximately
5 cm⫻15 cm, below the target ball for QA measurements. When the film and target ball are
exposed to radiation, the location of the target ball within the mMLC field can be determined.
   With the gantry at 0°, the mMLC was set to a 1.2⫻1.2 cm2 field. One leaf pair outside of the
square field was opened to use as an alignment reference. To help align the film with the mMLC
leaf, a line was drawn on the jacket of a piece of film. This line was placed parallel to the edge of
the open leaf pair and then translated so that it passed through the center of the target ball. This
ensured that the profile passed under the center leaf of each bank. By evaluating the location of the
target ball with respect to the field, the repositioning of the leaves with the gantry at 90° could be
measured. An example film image and profile through the target ball are shown in Fig. 3.
   A piece of film was placed in the holder and exposed for 20 MU. The gantry was then rotated
to 90° without moving the mMLC leaves. A new piece of film was placed in the film holder and
again exposed for 20 MU. Changes in the position of the target ball with respect to the field from
this profile compared to the position of the target ball in the first profile would be dependent only
on the gantry sag. The mMLC was fully opened, the field reformed, and another film exposed. The
position of the target ball with respect to the third field was now dependent solely on leaf posi-

Journal of Applied Clinical Medical Physics, Vol. 3, No. 3, Summer 2002
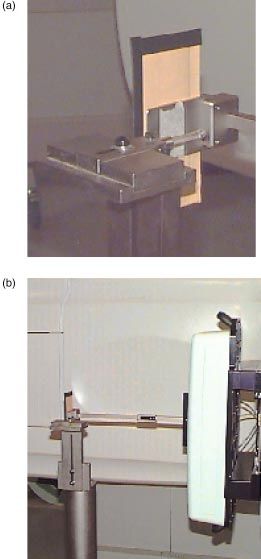
179        Parker et al.: PTV margin determination in . . .                                                          179

FIG. 2. 共Color兲 Measurement setup for gravitational effects on leaf positioning showing 共a兲 the radiopaque target ball and
film holder and 共b兲 relation of the apparatus to the mMLC and gantry.

tioning when compared to the second film. The gantry was then returned to 0° and the mMLC
field retracted and reset. Another film was exposed. This process was repeated for a gantry angle
of 270°. The difference between films #2 and #3 represented leaf position error due to gravity.
This was also true for films #1 and #4.

B. Image fusion software
   The Radionics Image Fusion Software 共version 2.0兲 was used to determine the uncertainty in
the target coordinates determined by the image fusion process. During this evaluation, spatial
uncertainty in the CT scan was also determined. We used a skull phantom supplied by Radionics
for the purpose of evaluating the spatial localization accuracy of the imaging systems. The phan-
tom, shown in Fig. 4 with the top removed, contains four geometric structures 共cone, cylinder,

Journal of Applied Clinical Medical Physics, Vol. 3, No. 3, Summer 2002
180         Parker et al.: PTV margin determination in . . .                                                                  180

FIG. 3. 共Color兲 共a兲 Film used to measure gravitational effects on leaf positioning. The open leaf pair at the bottom is used
to align the scanner profile. The profile is then shifted to the center leaf pair to pass under the target ball. 共b兲 The dip in the
center is caused by the target ball. Gravitational effects on leaf positioning can be determined by locating the target ball
with respect to the field edges at gantry positions of 0°, 90°, and 270°.

sphere, and cube兲 located at fixed positions within the phantom. Radionics supplies the stereotactic
coordinates for the top center of each of the objects to compare with the calculated coordinates
from the imaging system.
   Ten CT scans of the phantom were acquired on n PQ5000 CT scanner 共Marconi Medical
Systems, Cleveland, Ohio兲 with 1.5-mm slice spacing and thickness, 32-cm FOV, and 512⫻512
matrix, resulting in a pixel size of 0.63 mm⫻0.63 mm. The scan range was chosen to entirely
cover the geometric structures within the phantom. A MRI scan of the phantom was made and
fused with the multiple CT scans. Initial fusion alignment was performed using user-selected
points on each of the scan data sets. The final image fusion was performed using an intensity-
matching algorithm. The MRI scan was performed with a T1 weighted spin echo sequence,
1.5-mm slice spacing and thickness, 25-cm FOV, and a 256⫻256 matrix, resulting in a pixel size
of 0.98 mm⫻0.98 mm.
   We began the image fusion process by selecting four corresponding landmark points on one CT
image set and one MRI image set. Once the points were selected, the software aligned the
landmarks to use as a starting point in the final fusion. Once the landmark alignment was selected,
the images were fused. The initial selection of points is only used as a starting point in the fusion
process and the transformation required to align the selected points is provided to the user before

 FIG. 4. 共Color兲 QA phantom used in the image fusion evaluation. The internal geometric structures are clearly visible.

Journal of Applied Clinical Medical Physics, Vol. 3, No. 3, Summer 2002
181        Parker et al.: PTV margin determination in . . .                                                       181

FIG. 5. 共Color兲 共a兲 MDACC alignment frame and 共b兲 one of the depth measurement rods. The frame uses five tattoo points
to align patient anatomy for treatment. The depth rods are marked with a millimeter resolution scale for depth measure-
ments to evaluate patient positioning reproducibility.

the final fusion is performed. Thus, the transform required to align the user selected points can be
compared to the final fusion transform provided by the software. It should be noted, based on
evaluation at our institution, that with the intensity-matching algorithm, the initial selection of
points has little effect on the final transform used to fuse the image sets. Although this evaluation
is performed in the idealized situation of a phantom, it at least gives an initial quantitative estimate
of the uncertainty introduced by the fusion process.
    Six points were chosen for evaluation—tip of the cone, top center of the cube, left-anterior-
superior corner of the cube, top center of the sphere, center of the sphere, and top center of the
cylinder. Coordinates for points not provided by Radionics were determined by opening the
phantom and measuring the dimensions of each structure. The unknown coordinates could then be
determined relative to the known coordinates. With the fusion complete, the fused image set was
evaluated in XPlan, a commercial treatment planning system for geometric conformal stereotactic
radiosurgery and radiotherapy. Each of the points chosen for evaluation was identified, and the
coordinates of each point were recorded. The point selection was evaluated by three different
qualified users to determine if there was a user dependence. There was no measurable difference
in the point coordinates obtained by the three different users. This process was repeated until the
MR image set had been fused with each CT image set. The mean and standard deviation of the
distribution were determined from the measured coordinates in each direction 共AP, LAT, and
VERT兲 for all six points.
    The coordinates for each of the points were then determined on the 10 CT image sets alone.
The mean and standard deviation of the distribution were determined from the measured coordi-
nates in each direction for all six points. The CT coordinates were compared to the given stereo-
tactic coordinates, uncertain how to determine the CT scan. The mean coordinate and standard
deviation of each corresponding point-direction combination from the two measured distributions
共fused and CT alone兲 were then compared. The difference in the means was determined, and the
standard deviations were added in quadrature. The measured difference was the result of a com-
bination of the spatial inaccuracy of the MR scanner and the image fusion process. Since the local

Journal of Applied Clinical Medical Physics, Vol. 3, No. 3, Summer 2002
182 Parker et al.: PTV margin determination in . . . 182
spatial inaccuracy for a particular MR scanner is not known, an evaluation must be performed for
each MR scanner used in treatment planning. In other words, the margin applied to the CTV will
depend on the scanner used in the imaging process.
C. GTC frame reproducibility
Reproducibility of the GTC frame was determined using a method described by Kooy et al.5
The measured uncertainty in GTC repositioning is a combination of two quantities: 共1兲 the actual
repositioning uncertainty and 共2兲 the uncertainty in the measurement itself. Our institution’s in-
house alignment frame and depth-measurement rod are shown in Fig. 5. The frame is attached to
the GTC frame and is used to mark five alignment points on the patient’s skin using a metal rod
with a felt-pen marker at the end. There are two superior points, one anterior point, and two lateral
points. Once it has been determined that there are no problems with the placement of the frame
with respect to the target, permanent tattoos are placed at each point and the alignment frame is
removed. The patient then undergoes CT imaging. These tattoos are used for repositioning before
each treatment fraction. For each subsequent setup, pointed rods are used to align the tattoos with
the alignment frame. Alignment of the points with the frame corrects for both translation and
rotation of the patient anatomy. The alignment rods fit snugly into the guide holes assuring highly
accurate and reproducible positioning. Each rod is marked with a millimeter resolution scale to
measure the depth to the patient surface. This allows for the reproducibility to be quantified
compared to the standard clinical practice of just aligning the points.
Similar to the Radionics depth confirmation helmet, commonly used in SRT patient reposition-
ing, the MDACC alignment frame has two laterally opposed measurement points. A lateral shift of
the cranium would cause the lateral measurements to change coherently. Because the cranial width
remains constant, the sum of the lateral measurements should remain constant. Therefore, the
uncertainty in the sum of the left and right measurements ( L⫹R ) depends only on the measure-
ment uncertainty ( M ) and not the positioning uncertainty of the patient. This can be assumed
since the uncertainty in the sum of the left and right measurements ( L⫹R ) is the standard
deviation of the distribution of the sum of the left and right lateral measurements. The measure-
ment uncertainty is the uncertainty in the sum of the lateral measurements divided by the square
root of two 共i.e., M ⫽ L⫹R /&). 5 It is assumed that the measured uncertainty of each position is
the quadrature sum of the positioning uncertainty and the measurement uncertainty. The measure-
ment uncertainty can then be separated from the total measured uncertainty in each point to find
the positioning uncertainty. The positioning uncertainty is given by
p ⫽ 冑 tot
2
⫺ 2M , 共1兲
where p is the positioning uncertainty for a particular point, tot is the measured total uncertainty
for that point, and M is the measurement uncertainty.
The evaluation of the GTC frame was performed on a patient undergoing treatment. Measure-
ments for each of the points were made during setup for each of 14 fractions.
D. Monte Carlo calculation for target coverage
Evaluating the effects of margin selection on CTV dose for a large patient population would
require randomly shifting the CTV based on the measured uncertainties in each direction and then
evaluating the CTV dose/volume relation. It would be impractical to perform measurements on a
large number of ‘‘patients’’ using standard dosimetry techniques since a 3D dose distribution
would be required for each CTV shift. Therefore, the Monte Carlo program was written to evalu-
ate the margin and fraction combinations for a large number of patients.
The simulation makes a number of basic assumptions that differ to some extent from physical
reality. However, the simplified target geometry and dose distribution will still provide useful
information on the effects of margin and fraction combinations. We assumed that any point within
Journal of Applied Clinical Medical Physics, Vol. 3, No. 3, Summer 2002183 Parker et al.: PTV margin determination in . . . 183
the PTV received 100% of the prescribed dose, and that the dose outside of the PTV fell off
linearly to zero dose. Outside of this falloff region the dose was assumed to be zero. We also
performed the calculations based on a 4-cm diameter spherical CTV. All of the measured uncer-
tainties determined for each of the components considered in this work were combined to generate
an overall uncertainty in each of the three independent directions. The random uncertainties were
assumed to follow Gaussian probability distributions and were therefore added in quadrature,
assuming no correlation, to arrive at the final uncertainty to be applied to the PTV margin. The
systematic errors were added linearly in each direction.
The number of fractions to be simulated is selected at the start of the CTV coverage evaluation.
A number of points are then randomly selected within the CTV to approximate the CTV. A
variable margin is applied to the CTV in each direction to generate a PTV. A random shift is
generated, based on measured uncertainties, in each direction and applied to each CTV point. The
dose to each point is then calculated. Points located within the PTV are assigned a dose value of
1 for that particular fraction. Points located outside of the dose falloff region are assigned a dose
value of 0 for that particular fraction. Points located in the dose falloff region are assigned a dose
value dependent on their distances from the surface of the PTV. A dose gradient of 20% mm⫺1
exterior to the PTV was used since it is approximately the same dose gradient as the mMLC
penumbra.
The region enclosed by the PTV, and therefore the volume of 100% dose, is approximated as an
ellipsoidal volume defined by the equation
x2 y2 z2
⫹ ⫹ ⭐1, 共2兲
a2 b2 c2
where x, y, and z are the coordinates of the CTV point after the random shifts are applied and a,
b, and c are the CTV radius plus the margin along the x, y, and z axes, respectively. Points with
coordinates satisfying this equation are assigned a dose value of 1 for that particular treatment
fraction.
The region of zero dose is defined as the space of points whose coordinates satisfy the equation
x2 y2 z2
⫹ ⫹ ⭓1, 共3兲
共 a⫹1/g 兲 2 共 b⫹1/g 兲 2 共 c⫹1/g 兲 2
where g is the dose gradient. Thus, 1/g is the distance between the region of 100% dose and the
region of zero dose. Points with coordinates satisfying this equation are assigned a dose value of
zero.
If the point coordinates do not satisfy either of the above conditions, then the point lies in the
region of the linear dose falloff. The point coordinates approximately satisfy an equation of the
form
x2 y2 z2
⫹ ⫹ ⫽1, 共4兲
共 a⫹d 兲 2 共 b⫹d 兲 2 共 c⫹d 兲 2
where d is the distance from the surface of the volume of 100% dose to the surface satisfied by the
point coordinates. The dose at this point can be calculated as
dose⫽1.0⫺d * g. 共5兲
A bisection method was used to determine the value of d that was used in Eq. 共4兲.
The CTV shift was resampled for each fraction in the ‘‘treatment’’ and the dose to each point
for that fraction was calculated. The dose for each point was summed over the total number of
fractions and then divided by the number of fractions in the treatment. This resulted in the average
dose for each point being a percentage of the intended PTV dose. The dose information was then
Journal of Applied Clinical Medical Physics, Vol. 3, No. 3, Summer 2002184 Parker et al.: PTV margin determination in . . . 184
FIG. 6. 共Color兲 Measured ‘‘A bank’’ leaf positioning errors.
used to generate a cumulative dose volume histogram 共cDVH兲 for the CTV. This represented a
treatment simulation of a single patient. The entire process 共excluding the random sampling of
target points兲 was repeated 1000 times, representing the treatment of 1000 patients.
The cDVH’s were used to determine a mean cDVH and confidence intervals for the mean
cDVH. The cDVH’s were also used to create histograms of the dose/coverage relationship. One
histogram plots the distribution of frequencies of deviations from 100% target coverage 共i.e., CTV
dose where target coverage drops below 100%兲. The other histogram plots the distribution of
frequencies of target volume covered by 100% of the PTV dose. The mean cDVH, confidence
intervals, and histograms show CTV coverage in a population of patient treatments over a number
of combinations of PTV margin and number of treatment fractions.
III. RESULTS AND DISCUSSION
A. Leaf positioning
Figures 6 and 7 show the measured positioning errors versus set position for leaves on the A
and B banks, respectively. Positive set position numbers indicate leaf positions on the same side of
the central axis 共CAX兲 as the leaf bank being examined. The positioning error for the A bank of
leaves exceeded the manufacturer’s stated positioning accuracy for positions greater than 1 cm
across the central axis. The B bank of leaves met the manufacturer’s specifications at all positions
within the range of motion.
The full range of mMLC leaf motion was divided into three regions: 共1兲 fully extended to
⫺2.00 cm, 共2兲 ⫺2.00 cm to ⫹2.00 cm, and 共3兲 ⫹2.00 cm to fully retracted. A leaf calibration
factor can be applied independently to each of these regions. Therefore, adjustments can be made
in the regions where the positioning error exceeds the manufacturer’s specifications without af-
fecting regions where the positioning error meets the specifications. Since these modifications
must be made by the manufacturer, and the manufacturer will only guarantee a positioning uncer-
FIG. 7. 共Color兲 Measured ‘‘B bank’’ leaf positioning errors.
Journal of Applied Clinical Medical Physics, Vol. 3, No. 3, Summer 2002185 Parker et al.: PTV margin determination in . . . 185
TABLE I. Measured uncertainties for image fusion.
Structure AP LAT VERT
Top of cube ⫺0.4⫾0.2 mm 0.0⫾0.2tmm ⫺0.3⫾0.7 mm
Corner of cube 0.0⫾0.3 mm ⫺0.4⫾0.2 mm ⫺0.2⫾0.5 mm
Cylinder ⫺0.5⫾0.2 mm 0.0⫾0.1 mm ⫺0.1⫾0.8 mm
Cone ⫺0.5⫾0.2 mm ⫺0.2⫾0.2 mm 0.9⫾0.9 mm
Top of sphere 0.0⫾0.3 mm 0.2⫾0.2 mm 0.8⫾0.7 mm
Center of sphere ⫺0.2⫾0.2 mm 0.1⫾0.2 mm ⫺0.4⫾0.7 mm
Average ⫺0.2⫾0.1 mm 0.0⫾0.1 mm 0.1⫾0.3 mm
tainty of ⫾0.5 mm, it can be assumed that the post-modification positioning error will be
⭐0.5 mm. Assuming worst case scenario, the leaf positioning uncertainty was incorporated in the
Monte Carlo calculations as a systematic error of 0.5 mm and an additional random error uni-
formly distributed between 0.0 and 0.14 mm. The random error accounts for the positioning
uncertainty at nonzero gantry angles and the uncertainty in the measurements themselves.
B. Image fusion software
The measured coordinates of the selected points within the QA phantom were compared to the
known coordinates for each of the points. Table I shows the measured uncertainties 关mean ⫾1
standard deviation 共SD兲兴 between the fused image sets and the CT image sets for each point in
each direction along with the average measured uncertainty in each direction. The average value
in each direction was determined by summing the values in that direction for each point and
dividing by the number of points. The standard deviations were added in quadrature assuming no
correlation. The average values were used in the Monte Carlo calculations.
C. GTC frame reproducibility
Table II shows the measurements for a patient under treatment over four weeks. The resulting
measurement error was 0.74 mm. The results show positioning errors 共after removing the mea-
TABLE II. Measured GTC repositioning uncertainties.
# Anterior Left Right Left vert Right vert Left⫹right
1 9.5 cm 12.7 cm 14.1 cm 14.5 cm 14.8 cm 26.8 cm
2 9.5 cm 12.9 cm 14.1 cm 14.5 cm 14.8 cm 27.0 cm
3 9.5 cm 12.9 cm 14.0 cm 14.5 cm 14.8 cm 26.9 cm
4 9.6 cm 12.8 cm 14.0 cm 14.4 cm 14.8 cm 26.8 cm
5 9.6 cm 12.9 cm 14.2 cm 14.5 cm 14.7 cm 27.1 cm
6 9.6 cm 12.8 cm 14.2 cm 14.5 cm 14.8 cm 27.0 cm
7 9.5 cm 12.9 cm 14.1 cm 14.5 cm 14.7 cm 27.0 cm
8 9.5 cm 12.9 cm 14.2 cm 14.5 cm 14.8 cm 27.1 cm
9 9.5 cm 12.9 cm 14.0 cm 14.5 cm 14.7 cm 26.9 cm
10 9.5 cm 12.9 cm 14.0 cm 14.6 cm 14.8 cm 26.9 cm
11 9.6 cm 13.0 cm 14.0 cm 14.4 cm 14.8 cm 27.0 cm
12 9.6 cm 12.9 cm 14.0 cm 14.5 cm 14.7 cm 26.9 cm
13 9.6 cm 13.0 cm 14.1 cm 14.5 cm 14.7 cm 27.1 cm
Standard deviation 0.052 cm 0.080 cm 0.083 cm 0.049 cm 0.051 cm 0.104 cm
( L⫹R)
Measurement error 0.074 cm
( M)
Position error 0.00 cm 0.03 cm 0.04 cm 0.00 cm 0.00 cm
Journal of Applied Clinical Medical Physics, Vol. 3, No. 3, Summer 2002186 Parker et al.: PTV margin determination in . . . 186
TABLE III. Summary of measured individual and combined uncertainties.
AP LAT VERT
Component systematic⫾1 SD systematic⫾1 SD systematic⫾1 SD
Leaf positioning 0.5⫾0.14 mm 0.5⫾0.14 mm 0.5⫾0.14 mm
GTC repositioning 0.0⫾0.35 mm 0.0⫾0.35 mm 0.0⫾0.35 mm
CT 0.3⫾0.1 mm 0.3⫾0.0 mm 0.1⫾0.2 mm
Image fusion 0.2⫾0.1 mm 0.0⫾0.1 mm 0.0⫾0.3 mm
Total uncertainty 1.0⫾0.4 mm 0.8⫾0.4 mm 0.6⫾0.5 mm
FIG. 8. 共Color兲 Mean DVH 共blue兲, ⫾1 interval 共pink兲, and ⫾2 interval 共yellow兲 for five fractions with no margin and
the systematic error plus one standard deviation margin.
FIG. 9. 共Color兲 Minimum target dose histograms for five fraction treatment with no margin 共black兲, systematic error margin
共red兲, and systematic error plus one standard deviation margin 共blue兲.
FIG. 10. 共Color兲 Histograms of target volume receiving 100% of PTV dose for five fraction treatment with no margin
共black兲, systematic error margin 共red兲, and systematic error plus one standard deviation margin 共blue兲.
Journal of Applied Clinical Medical Physics, Vol. 3, No. 3, Summer 2002187 Parker et al.: PTV margin determination in . . . 187
FIG. 11. 共Color兲 Mean DVH 共blue兲, ⫾1 interval 共pink兲, and ⫾2 interval 共yellow兲 for 30 fractions with no margin and
the systematic error plus one standard deviation margin.
FIG. 12. 共Color兲 Minimum target dose histograms for 30 fraction treatment with no margin 共black兲, systematic error margin
共red兲, and systematic error plus one standard deviation margin 共blue兲.
FIG. 13. 共Color兲 Histograms of target volume receiving 100% of PTV dose for 30 fraction treatment with no margin
共black兲, systematic error margin 共red兲, and systematic error plus one standard deviation margin 共blue兲.
TABLE IV. Summary of Monte Carlo results for five fractions.
Min. dose 99th %tile Target vol. 99th %tile
Margin range dose range vol.
None 69%–91% 71% 86%–94% 88%
Systematic 87%–99% 88% 94%–100% 95%
Systematic⫹1SD 94%–100% 95% 96%–100% 97%
TABLE V. Summary of Monte Carlo results for 30 fractions.
Min. dose 99th %tile Target vol. 99th %tile
Margin range dose range vol.
None 77%– 86% 78% 84%–91% 85%
Systematic 93%–98% 93% 93%–98% 94%
Systematic⫹1SD 97%–100% 98% 96%–100% 97%
Journal of Applied Clinical Medical Physics, Vol. 3, No. 3, Summer 2002188 Parker et al.: PTV margin determination in . . . 188 surement error兲 in only the lateral dimensions with magnitudes of 0.3 mm and 0.4 mm on the left and right sides, respectively. These results agree well with the results of Kooy et al.5 who deter- mined a measurement error of 0.71 mm and a lateral positioning uncertainty of 0.35 mm. The recommendations of this work are based on measurements made on a single patient. However, the results agree well with measurements made by Kooy et al.5 on a larger sample of subjects. As a conservative measure, the positioning error measured for the lateral dimension will be applied to all three dimensions as a random error in the determination of the PTV margin. D. Monte Carlo calculation Table III shows the quantified uncertainties for each component and the total uncertainty for each MRI unit. The total uncertainty was used in the Monte Carlo calculations. The Monte Carlo calculations were used to evaluate CTV coverage for a number of PTV margins and treatment fractionation schemes. Calculations were made for 5 and 30 fraction treat- ments, and each fractionation scheme was evaluated using no margin, just the systematic error margin, and the systematic margin plus one standard deviation random uncertainty. The tests were performed with no margin to demonstrate the reduction in CTV coverage if the measured uncer- tainties are not taken into account. These two fractionation schemes were chosen since these are the only two currently used in SRT treatments at our institution. Single-fraction treatments were not addressed since the GTC frame is not used for those treatments. The results of the Monte Carlo simulations are shown in Figs. 8 –13. A satisfactory dose/volume relation is considered a minimum CTV dose of greater than or equal to 95% of the PTV dose while delivering 100% of the PTV dose to greater than or equal to 95% of the CTV. Even if a 5% dose inhomogeneity 共i.e., a minimum dose that is at least 95% of the prescribed dose兲 is specified in the inverse planning software, the calculated inhomogeneity is generally greater than that due to constraints on normal tissue doses and limitations of the plan- ning system. The 5% inhomogeneity criterion allows for the planning system to generate a plan with an inhomogeneity greater than 5% that is still acceptable. Tables IV and V show summaries of the Monte Carlo results for 5 and 30 fractions, respec- tively. Examination of the 99th percentile values for minimum CTV dose and fraction of CTV receiving the PTV dose shows that a margin of the systematic uncertainty plus one standard deviation in each direction results in a satisfactory CTV dose/volume relation for both 5 and 30 fraction treatments. This means that there is a 99% confidence that the minimum CTV dose is ⭓95% of the PTV dose and that ⭓95% of the CTV receives the full PTV dose. IV. CONCLUSIONS The purpose of this work states that it is possible to quantify uncertainties in the image fusion software, mMLC leaf positioning, and GTC frame repositioning and combine these uncertainties to determine a PTV margin so that the entire CTV receives clinically acceptable coverage. How- ever, it is necessary for each institution to quantify these uncertainties. The CTV dose was evaluated for a number of margin and fractionation scheme combinations using a simple Monte Carlo simulation. Based on the Monte Carlo calculations, a margin of the systematic uncertainty plus one standard deviation in each direction is recommended for treat- ments of both 5 fractions and 30 fractions. This margin would be sufficient to achieve a minimum CTV dose greater than 95% of the PTV dose, while delivering 100% of the PTV dose to greater than 95% of the CTV. This work confirms that it is possible to quantify uncertainties in the treatment planning and delivery process and combine these uncertainties to generate a PTV margin such that the CTV receives the prescribed dose. However, the application of these results is dependent on the phy- sician evaluating the results. Satisfactory dose/volume relations will depend on the physician to determine the necessary margin and resulting CTV dose for a particular fractionation scheme. Journal of Applied Clinical Medical Physics, Vol. 3, No. 3, Summer 2002
189        Parker et al.: PTV margin determination in . . .                                                               189

*Email address: bcparker@mdanderson.org
†
  Email address: ashiu@mdanderson.org
‡
  Email address: mmaor@mdanderson.org
§
  Email address: fflang@mdanderson.org
储
 Email address: hliu@mdanderson.org
  1
    L. A. Nedzi, H. Kooy, E. Alexander, R. S. Gelman, and J. S. Loeffler, ‘‘Variables associated with the development of
    complications from radiosurgery of intracranial tumors,’’ Int. J. Radiat. Oncol., Biol., Phys. 21, 591–599 共1991兲.
  2
    ICRU Report 50, Prescribing, Recording, and Reporting Photon Beam Therapy, International Commission on Radiation
    Units and Measurements, Bethesda, MD 共1993兲.
  3
    J. A. Antolak and I. I. Rosen, ‘‘Planning target volumes for radiotherapy: How much margin is needed?’’ Int. J. Radiat.
    Oncol., Biol., Phys. 44, 1165–1170 共1999兲.
  4
    S. S. Gill, D. G. T. Thomas, A. P. Warrington, and M. Brada, ‘‘Relocatable frame for stereotactic external beam
    radiotherapy,’’ Int. J. Radiat. Oncol., Biol., Phys. 20, 599– 603 共1991兲.
  5
    H. M. Kooy, S. F. Dunbar, N. J. Tarbell, E. Mannarino, N. Ferraro, S. Shusterman, M. Bellerive, L. Finn, C. V.
    McDonough, and J. S. Loeffler, ‘‘Adaptation and verification of the relocatable Gill-Thomas-Cosman frame in stereo-
    tactic radiotherapy,’’ Int. J. Radiat. Oncol., Biol., Phys. 30, 685– 691 共1994兲.
  6
    A. S. Shiu, H. M. Kooy, J. R. Ewton, S. S. Tung, J. Wong, K. Antes, and M. H. Maor, ‘‘Comparison of miniature
    multileaf collimation 共mMLC兲 with circular collimation for stereotactic treatment,’’ Int. J. Radiat. Oncol., Biol., Phys.
    37, 679– 688 共1997兲.
  7
    K. J. Antes, Comparison of Miniature Multileaf Collimation (mMLC) with Circular Collimation for Stereotactic Radio-
    surgery and Radiotherapy, M.S. thesis, University of Texas Health Science Center Graduate School of Biomedical
    Sciences, Houston, TX 共1996兲.
  8
    P. D. Barnes, P. D. Lester, W. S. Yamanashi, R. E. Woosley, and K. K. Wheatley, ‘‘Magnetic resonance imaging in
    childhood intracranial masses,’’ Magn. Reson. Imaging 4, 41– 49 共1986兲.
  9
    A. F. Thornton, Jr., H. M. Sandler, R. K. Ten Haken, D. L. McShan, B. A. Fraass, M. L. La Vigne, and B. R. Yanke,
    ‘‘The clinical utility of magnetic resonance imaging in 3-dimensional treatment planning of brain neoplasms,’’ Int. J.
    Radiat. Oncol., Biol., Phys. 24, 767–775 共1992兲.
10
    H. M. Kooy, M. van Herk, P. D. Barnes, E. Alexander III, S. F. Dunbar, N. J. Tarbell, R. V. Mulkern, E. J. Holupka, and
    J. S. Loeffler, ‘‘Image fusion for stereotactic radiotherapy and radiosurgery treatment planning,’’ Int. J. Radiat. Oncol.,
    Biol., Phys. 28, 1229–1234 共1994兲.
11
    M. van Herk and H. Kooy, ‘‘Automatic three-dimensional correlation of CT-CT, CT-MRI, and CT-SPECT using chamfer
    matching,’’ Med. Phys. 21, 1163–1178 共1994兲.

Journal of Applied Clinical Medical Physics, Vol. 3, No. 3, Summer 2002
You can also read