GLOBAL ECONOMIC OUTLOOK - TO IMMUNITY AND BEYOND! EDC Economics June 29, 2021 - Export Development Canada
←
→
Page content transcription
If your browser does not render page correctly, please read the page content below

GLOBAL
ECONOMIC
OUTLOOK
TO IMMUNITY AND BEYOND!

EDC Economics
June 29, 2021
Insights on the world’s key economies,
GDP growth, commodity prices,
interest rates and exchange rates.
EXECUTIVE SUMMARY
    GLOBAL ECONOMIC OUTLOOK: TO IMMUNITY AND BEYOND!
    By Peter Hall
    Vice-President and Chief Economist
    It’s an appropriate moment to adapt Buzz Lightyear’s signature cry to the              The dynamics of this growth are evident in EDC Economics’ new Global
    economy and to declare: “To immunity and beyond!” The statistics on vaccine            Economic Outlook. We have revised up growth for 2021 in the U.S. economy to
    distribution seem to be improving just about everywhere, and as a more                 a whopping 7.1%. At 4.6% growth, the Eurozone isn’t as aggressive, but is still
    generalized reopening seems imminent, companies and individuals are gearing            well above its long-term trend rate, and is expected to repeat this pace in 2022.
    up for a surge of activity. If that’s really what’s in the works, what will the        Emerging economies will see explosive growth as they recover from last year’s
    journey look like?                                                                     drubbing, and as the revival in the industrialized world feeds global demand for
    First off, it’s going to be a rocket-launch. In fact, ignition is already behind us,   goods and services. Collectively, emerging market growth will reach 6.5% this
    but the G-force is going to increase considerably as we move into the second           year and will accelerate further to 6.8% growth in 2022. As such, world growth
    half of the year. First, we have the regular recovery of sectors that are still in     will hit an outsized 6.3% for 2021 followed by a very impressive 5.7% next year.
    the abyss, brough on as more countries zero in on herd immunity. Second,               The rocket-ride won’t be particularly smooth. What the pandemic has shown us
    there’s ongoing public stimulus—primarily the US$1.9-trillion plan currently           is that we can turn off an economy pretty quickly—we just have to say the
    unfolding in the United States. And third, pent-up demand will reinforce               word. Getting it going again is a different matter—we can declare it open, but
    growth, aided greatly by the massive pileup of business and consumer cash in           it’s then up to the return-to-work decisions of businesses and labour, which
    demand deposit accounts in the U.S., Europe, Canada and elsewhere.                     aren’t necessarily synchronized and linear.

2
EXECUTIVE SUMMARY (continued)
    GLOBAL ECONOMIC OUTLOOK: TO IMMUNITY AND BEYOND!

    That’s showing up in current prices. Rapid growth has led to shortages of key       The rise in global demand will be the main driver in Canada’s near-term
    industrial inputs, including wood products, foodstuffs, base metals and             growth. This is evidenced by the surge in EDC’s Trade Confidence Index, which
    semiconductors. As such, prices are rising at a monthly pace that at the very       strongly suggests that Canada’s exporters are arming themselves for a roaring
    least is concerning. Upstream producer prices in the U.S. are red-hot, and the      second half of the year. All told, Canada is forecast to grow by a stunning 6.1%
    effects are immediate on final prices. Canada is following suit, while Europe is    this year and an impressive 4% in 2022.
    a bit more stable. Central banks are united in their belief that this is
    temporary, but they are taking different policy positions—with the European         Until this point, downside risks to forecasts have predominated. While it’s still
    Central Bank and the U.S. Federal Reserve Board standing pat, and the Bank of       possible that infection rates rise and recovery is delayed, there’s now a greater
    Canada signalling tightening. We believe that price growth will moderate            chance that in our exuberance, we overdo it a bit. There’s certainly enough
    through 2022, and that’s reflected in our commodity price projections.              pent-up pressure for this to occur, and given local capacity constraints, there’ll
                                                                                        likely be more than enough business for everyone to chime in on.
    Even so, there’s a significant risk that inflation expectations will rise. Labour
    markets keep tightening, and industry is once again flagging skilled labour         The bottom line?
    shortages, which will only be exacerbated if sidelined money flows into the
                                                                                        Our global forecast may seem optimistic; it’s not. As more businesses are
    economy soon, not to mention the impact on existing physical capacity
                                                                                        realizing, it’s aggressive, but quit realistic. Optimists have good reason to
    constraints. If so, monetary policy might find itself in catchup mode, which
    isn’t a pleasant prospect. As things stand, we can expect financial market          boost even our outsized numbers. Either way, the best business strategy is to
    volatility to persist during the uncertain transition period before prices and      make sure you can capture as much of the coming activity as possible. It’s
    exchange rates settle down into 2022. Canada’s exchange rate is expected to         going to be one of the most exhilarating economic rides we have see in a long
    average US$0.81 in 2021 and US$0.82 next year.                                      time.

3
COVID-19 CASES CRESTED, SOME RESTRICTIONS RELAXING
     Another global wave of COVID-19 cases crested in April 2021; this time driven by India. Some G7 economies, such
     as the U.S. and U.K. who’ve been leaders in terms of fully-vaccinated adults, have started relaxing restrictions.

     Global confirmed new COVID-19 cases                                                  Stringency of government restrictions for G7 countries
     Daily change, thousands, five-day average                                            Index value, maximum=100
    1,400
                                                                                          100
    1,200

     U.S.                                                                                     80                                                          Germany
    1,000                                                                                                                                                  Canada
    29.5M
                                                                                                                                                           Italy
     800                                                                                      60                                                           U.K.
                                                                                                                                                           France
                                                                                                                                                           Japan
     600                                                                                                                                                   U.S.
                                                                                              40
     400

                                                                                              20
     200

        0                                                                                      0
      January-20       May-20       September-20       January-21        May-21               January-20   May-20    September-20   January-21   May-21

      Sources: EDC Economics, Johns Hopkins Coronavirus Resource Center, Oxford University.
4
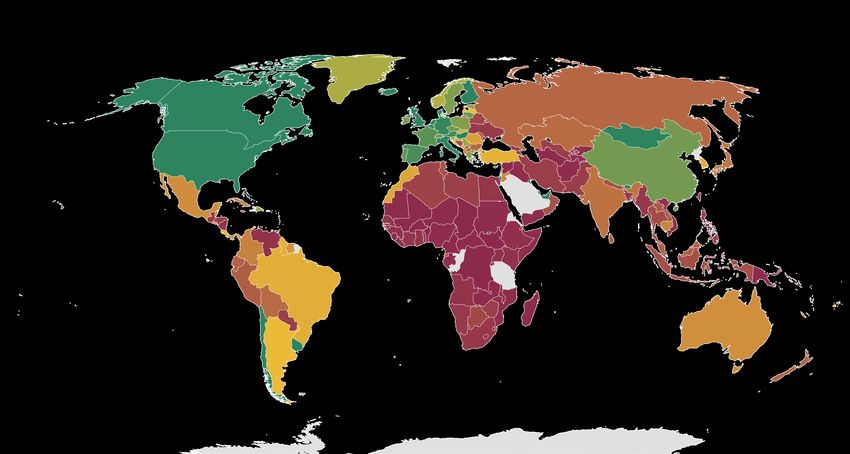
MUCH VACCINE PROGRESS, BUT HIGHLY UNEQUAL
    There’s been a rapid and impressive vaccination rollout across the world. But there’s also a large disparity in progress
    between advanced economies and emerging markets, notwithstanding recent commitments
    from the former to increase supply for the latter.
    Recent share of population vaccinated                                                                   Coverage
    % of total population with at least one dose, as of June 15, 2021
                                                                                                               50% +
                                                                                                               31-50%

                                                                                                               0-30%

                                                                                                               No data available

    Sources: EDC Economics, Our World in Data.
5
MASSIVE LABOUR MARKET DISRUPTION
At the start of the pandemic, unemployment claims in the U.S. were 10 times higher than in past recessions.
Labour markets have improved significantly in the past year, but as claims slow, large adjustments are still ongoing.
U.S. initial unemployment claims
Millions per week
7
6
5
4
3
2
1
0
2000 2005 2010 2015 2020
6 Source: U.S. Department of LaborVARIED JOB IMPACTS BY SECTOR
While services that can be delivered online (such as professional, finance, education and public administration) are
now above pre-pandemic employment levels, in-person jobs in restaurants, retail and recreation have yet to recover.
U.S. employment Canadian employment
% change since February 2020 May 2021, changes since February 2020, thousands of jobs by sector
0
Professional, scientific and technical
-5 Finance, insurance, and real estate
-4
Rest of economy Educational services
-10 Public administration
Forestry, fishing, mining, oil and gas
-15 -12 Health care and social assistance
Utilities
-20 Vulnerable services* Manufacturing
Agriculture
-25 Transport and warehousing
Construction
-30 Business, building and other services
Information, culture and recreation
-35 Other services
Retail and wholesale trade
-40 Accommodation and food services
January-20 May-20 September-20 January-21 May-21 -400 -300 -200 -100 0 100 200
*Restaurants, hospitality, arts, entertainment, recreation, other personal services
7 Sources: EDC Economics; U.S. Bureau of Labor StatisticsUNPRECEDENTED GLOBAL POLICY RESPONSE
To address COVID-19, rapid central bank interest rate cuts and large-scale asset purchase programs were followed
by massive expansions in direct support for households and businesses to maintain liquidity. In March, U.S.
President Joe Biden passed the third major American fiscal support package, making this total support the largest
among the G7.
Monetary policy G7 Direct Fiscal Measures to COVID-19
As of March 17, 2021, % of GDP
U.S. Federal Reserve
150 bps rate cuts to effective lower bound (ELB) of 0.0-0.25%
Bank of Canada
150 bps rate cuts to ELB of 0.25%
European Central Bank
Operating at ELB of -0.5%
Bank of England
65 bps rate cuts to ELB at 0.1% 25.5
Bank of Japan
Already operating at ELB at -0.1% 16.2 15.9 14.6
People’s Bank of China 11.0
8.5 7.6
Various term lending rates cut to ease financial conditions
Central bank asset purchases grew rapidly, and in G7 countries United United Japan Canada Germany Italy France
were more than three times larger than the 2008-2009 global States Kingdom
financial crisis.
8 Sources: EDC Economics; IMF COVID-19 policy tracker.BUOYANT FINANCIAL MARKETS
Aided by massive policy support, equity markets have been buoyant, running well above pre-pandemic levels, but
with large variation across sectors. Corporate borrowing costs and emerging market bond spreads fell from distressed
levels early in the pandemic, but started inching up in March due to rising inflation concerns in the U.S.
Global stock markets Global debt markets
% change since Jan. 1, 2020 %
50% 14 7
40% 12 6
30%
10 5
20%
10% 8 4
0% 6 3
-10%
4 2
-20%
-30% 2 1
-40% 0 0
January-20 May-20 September-20 January-21 May-21 January-20 May-20 September-20 January-21 May-21
S&P 500 Emerging Markets TSX U.S. Corp. Yield: B Rated (%, lhs) EM Bond Spread (bps, rhs)
9 Sources: Haver Analytics, EDC Economics; EDC Global Financial Markets.HEALTHY U.S. HOUSEHOLD FINANCES
Aggregate personal income in the U.S. increased during the pandemic, thanks to government transfers, which more
than offset the declines in wage earnings. With higher incomes, and spending constraints on some in-person
services, household have accumulated a significant amount of savings.
Monthly change in personal income Personal income, spending, and savings
Trillions of dollars Trillions of dollars
5 20 U.S. households built up $2.5T
in additional savings during the pandemic,
4 19 representing 19% of pre-pandemic annual
3 consumer spending!
18
2
17
1
0 16
-1 15
-2
14
-3
-4 13
January-20 April-20 July-20 October-20 January-21 April-21 2018 2019 2020 2021
Personal consumption Personal savings Disposable personal income
Wages Government transfers Personal income
10 Source: U.S. Bureau of Economic Analysis Note: Relative to the five-year pre-pandemic averages.SIMILAR CONSUMER DYNAMICS IN OTHER ADVANCED ECONOMIES
Much like in the U.S., retail sales fell sharply in other countries during the initial lockdowns, but activity shifted
online and spending quickly recovered. With increased government transfers and limited ability to spend on high-
contact services, savings rates spiked, and high-income households’ large cash reserves will support future spending.
Retail sales Savings rates
% change from January 2020 % of disposable income
30 30
20
U.S.
25
Canada
10
20
Euro
0
Euro Area 15 Area
-10
10 U.S.
-20
-30 5
Canada
-40 0
January-20 April-20 July-20 October-20 January-21 April-21 2007 2009 2011 2013 2015 2017 2019 2021
11 Sources: Haver Analytics, EDC EconomicsFALLING CORPORATE BANKRUPTCIES
Unlike the previous recessions, in the COVID-19 recession, because of significant policy support, corporate
bankruptcies in advanced economies didn’t rise, they fell. This atypical trend may eventually reverse when central
banks tighten monetary policy and governments withdraw fiscal supports.
Number of corporate bankruptcies
% change*
100
80
60
40
20
0
-20
-40
-60
United States Japan Germany Canada Italy France United Kingdom
COVID-19 Global financial crisis
*Percent change in corporate bankruptcies during the COVID-19 pandemic (2019Q4 to May 2021) and the global financial crisis (2008Q1 to respective peaks between 2008Q2
and 2009Q4). Canada’s numbers includes bankruptcies of sole proprietorships.
12 Source: OECD Economic OutlookGLOBAL GOODS TRADE REBOUND
Global goods trade has rebounded much faster than most expected at the start of the pandemic. With such a surge
in activity, attention has now turned to growing supply chain bottlenecks and capacity and price pressures.
Global merchandise trade volumes
Annual % change
20%
15%
10% +10%
5%
0%
-5%
-10%
-15%
-20%
2007 2008 2009 2010 2011 2012 2013 2014 2015 2016 2017 2018 2019 2020 2021
13 Sources: CPB Netherlands Bureau for Economic Policy Analysis, World Trade Organization.ADVANCED ECONOMY TRADE DYNAMICS
While goods exports rebounded quickly, services trade has been hit
much more persistently due to restrictions on cross-border travel.
Merchandise exports Services exports
% change since January 2020 % change since January 2020
15 5
10
0
5
0 -5
-5 -10
-10
-15
-15
-20 -20
-25
-25
-30
-35 -30
January-20 April-20 July-20 October-20 January-21 April-21 January-20 April-20 July-20 October-20 January-21 April-21
U.S. Canada Euro Area U.S. Canada Euro Area
14 Sources: Haver Analytics, EDC EconomicsCOMMODITY PRICES RISING
Commodity prices grew steadily from early pandemic lows. Lumber prices soared, supported by strong housing
demand, but have since come down from record highs. Agriculture demand has also been resilient. Metals, and
more recently, energy prices have benefited from the stronger-than-expected global economic recovery.
EDC commodity indices
Index 2017 = 100
450
400
350
300
250
200
150
100
50
0
2018 2019 2020 2021
Forestry EDC Commodity Index Metals Agriculture Energy
15 Sources: Haver Analytics, EDC Economics The Commodity TrackerOIL PRICES HAVE RISEN SIGNIFICANTLY
Oil prices have enjoyed a period of sustained growth into 2021, given growing evidence of recovering demand and
some restraints to-date on supply from key producers.
Oil prices June: OPEC+ reaffirms
intent to increase
$USD per barrel January 2020: First supply in mid-July
80 COVID-19 cases confirmed
March 7: OPEC+ agreement
falls apart and Saudi Arabia
increases production
60
40
20
0
April 20: Settlement date for May oil
-20 futures contracts. Lack of demand and
limited storage capacity temporarily
caused negative prices.
-40
July-19 October-19 January-20 April-20 July-20 October-20 January-21 April-21
West Texas Intermediate Western Canada Select
16 Sources: Haver Analytics, EDC EconomicsPURCHASING MANAGERS’ INDICES
Manufacturing orders fell first in China but bounced back once the pandemic came under control there. The rebound
in Asia was followed by the U.S. and Europe. The U.S. has recently led the way as its manufacturing sector gears up.
Purchasing managers’ indices
50+ = expansion
70
60
50
40
Canadian jobs in
30
“high-COVID-risk”
sectors
20
10
2018 2019 2020 2021
U.S. Euro Area China
17 Sources: Haver Analytics, EDC EconomicsREBOUNDING CONFIDENCE
Canadian business and consumer confidence measures have risen above their levels prior to the pandemic.
Business and consumer confidence indices
70 Business
60 Consumer
50
40 Canadian jobs in
“high-COVID-risk”
sectors
30
20
2014 2015 2016 2017 2018 2019 2020 2021
Sources: Nanos Canadian consumer sentiment index, CFIB business barometer
18FEDERAL RESERVE POLICY
The Fed has a dual mandate of both stable prices and maximum employment. In August 2020, the first pillar was
adjusted to “average inflation targeting”, which allows for the over-shooting of inflation we are now experiencing,
after a period of undershooting. At the same time, U.S. labour markets still have considerable ground to make up.
U.S. Inflation U.S. employment
Year-over-year % change in consumer prices Millions
10 million jobs below
6 165 pre-pandemic trend
5
160
4
155
3
2 150
1 7.1 million
145
jobs below
0 pre-pandemic
140
-1 level
135
-2
-3 130
2007 2009 2011 2013 2015 2017 2019 2021 2007 2009 2011 2013 2015 2017 2019 2021
Total CPI CPI (excluding energy and food)
Note: CPI = Consumer Price Index
Note: Relative to the five-year pre-pandemic averages.
19 Sources: U.S. Bureau of Economic Analysis, U.S. Bureau of Labor StatisticsCANADIAN ECONOMIC RECOVERY TRACKER
Canadian economic recovery experienced another setback during the third wave of COVID-19 cases.
Financial markets, sentiment, housing and spending remain the bright spots in the recovery.
CERT index combines 13 high-frequency indicators Percent change versus pre-COVID-19 baseline, week ending June 18
% change from pre-COVID-19 baseline
January-20 May-20 September-20 January-21 May-21
COVID-19
0%
-9% FINANCIAL
June 18 MARKETS
-10%
TRANSPORTATION
-20% AND MOBILITY
SENTIMENT
-30%
HOUSING,
-40% SPENDING AND
EMPLOYMENT
-50% -100% -80% -60% -40% -20% 0% 20% 40%
20 Source: EDC EconomicsGLOBAL
ECONOMIC
OUTLOOK
212021 GROWTH OUTLOOK
6.3%
Real GDP growth, %
World
6.1 3.7
7.1
5.5
9.6 2.7 5.9%
10.6*
Developed
6.4
5
6.5%
Emerging
* India’s 2021 FY = Q2 2021 – Q1 2022
22 Source: EDC Global Economic Outlook, June 20212022 GROWTH OUTLOOK
5.7%
Real GDP growth, %
World
4 4.7
4
4.3
7.8 2.4 4%
13.3* Developed
3.9
2.3
6.8%
Emerging
* India’s 2022 FY = Q2 2022 – Q1 2023
23 Source: EDC Global Economic Outlook, June 2021REAL GDP GROWTH
Global Economic Outlook
(Annual % change)
2020 2021* 2022*
Developed countries -4.7 5.9 4.0
Canada -5.3 6.1 4.0
United States -3.5 7.1 4.0
Eurozone -6.7 4.6 4.4
Germany -5.1 3.7 4.7
France -8.0 5.5 4.3
Japan -4.7 2.7 2.4
Emerging countries -2.2 6.5 6.8
China 2.0 9.6 7.8
India 3.2 10.6 13.3
Brazil -4.4 5.0 2.3
Mexico -8.5 6.4 3.9
Total World -3.3 6.3 5.7
Note: * denotes the forecast period. India’s forecast based on fiscal year (2021 FY = Q2 2021 – Q1 2022, 2022 FY = Q2 2022 – Q1 2023)
Source: EDC Global Economic Outlook, June 2021
24CHANGES FROM PREVIOUS FORECAST
Global Economic Outlook
2021* 2022*
Real GDP Growth (percentage point change)
Developed countries 0.8 0.0
Canada 0.6 -0.1
United States 0.8 0.1
Eurozone 0.3 0.0
Germany 0.1 0.3
France -0.1 0.2
Japan -0.3 -0.1
Emerging countries -0.5 0.6
China -1.2 0.4
India -2.7 3.9
Brazil 0.9 -0.4
Mexico 0.8 -0.1
Total World -0.1 0.3
Note: * denotes the forecast period. Green shading denotes upward adjustments; red shading denotes downward adjustments.
Source: EDC Global Economic Outlook, June 2021 relative to April 2021.
25CURRENCIES AND INTEREST RATES
Global Economic Outlook 2020 2021* 2022*
Currencies Exchange Rate
U.S. dollar USD per CAD 0.75 0.81 0.82
Euro USD per EUR 1.14 1.21 1.21
Euro CAD per EUR 1.53 1.49 1.48
Interest Rates, annual average
Bank of Canada, Overnight Target Rate 0.56 0.25 0.35
U.S. Federal Reserve, Fed Funds Target Rate (Upper limit) 0.39 0.10 0.10
European Central Bank, Policy Interest Rate 0.00 0.00 0.00
Note: * denotes the forecast period. The first interest rate hike forecasted for the Bank of Canada is September 2022; the Federal Reserve is
June 2023; and the European Central Bank is Q1 2024.
Source: EDC Global Economic Outlook, June 2021
26COMMODITY PRICES
Global Economic Outlook 2020 2021* 2022*
Brent Crude Spot, USD / bbl 41.76 66.02 62.39
West Texas Intermediate, USD / bbl 39.27 63.02 59.29
Western Canada Select, USD / bbl 27.82 50.46 46.79
Natural Gas, USD / MMBtu 2.02 3.00 2.88
Gold, USD / troy ounce 1,770 1,779 1,730
Copper, USD / tonne 6,170 9,117 8,303
Note: * denotes the forecast period.
Source: EDC Global Economic Outlook, June 2021
27KEY FORECAST ASSUMPTIONS
COVID-19 Financial conditions
Vaccines distribution has made significant progress so far in 2021. We Central banks around the world are expected to continue to provide
assume vaccines will be widely adopted in most advanced economies by extraordinary liquidity, at least over the next year, in order to maintain
the second half of 2021, but notably later in some emerging economies. market functioning and overall financial stability. The tightening of policy
interest rates is expected to proceed relatively gradually and smoothly in
EDC Economics’ base case forecast doesn’t assume an additional a return to neutral levels.
significant wave of new COVID-19 cases across systemically-important
economies in the second half of 2021. However, we do not rule out The base case forecast doesn’t include any systemic financial crises
several additional outbreaks in various locations. Our forecast assumes resulting from the COVID-19 pandemic. However, our outlook doesn’t
government responses to restrict economic activity will be more rule out the potential for localized debt defaults in some sectors and
decentralized and location-specific than the economy-wide lockdowns amongst some emerging markets during the later stages of the recovery
used earlier, and that there’ll be less economic disruption. as debt overhangs are worked out.
This is because in the first wave, companies were forced to adapt on the
fly, changing how they do business in an environment of significant
distress and uncertainty. As we have seen, in subsequent waves of
infections, many companies and households have applied these lessons
to mitigate the economic impacts.
28KEY RISKS TO THE FORECAST
Given rapidly changing global events, there’s a higher-than-usual degree of uncertainty
around this forecast, which incorporates information available as of June 9, 2021.
Key upside risks Key downside risks
• The unprecedented government support provided across advanced • The emergence of new variants of the COVID-19 virus which are
economies, alongside reduced ability to spend on some services, has highly-contagious and much more resistant to existing vaccines, could
led to a large accumulation of household savings in many countries. lead to further spikes in COVID-19 cases, hospitalizations and
As vaccines rollouts progress and economies re-open, the drawing mortality, leading governments to reimpose strict lockdowns.
down of these savings could result in a strong-than-expected recovery
releasing significant “pent-up demand” into the economy, as supply • Given the highly unequal nature of the COVID-19 shock across sectors,
struggles to keep pace. labour market “scarring” could reduce labour force participation for
those in some of the hardest hit sectors, and eventual insolvencies of
• The rapid adoption of new technologies and shift of economic activity SMEs and other adjustment costs of reallocating capital and labour
online due to COVID-19 lockdowns, includes e-commerce, remote across sectors could significantly slow the recovery, even after the
work, automation and more. These changes could spark a productivity pandemic is under control.
revival leading to a virtuous cycle of improved consumer, business and
financial market confidence, stronger spending and investments, and
Forecast probabilities
a prolonged period of growing financial wealth due to strengthening
asset prices in equities and housing. Upside 20%
Base case 65%
Downside 15%
29DISCLOSURE
Ce document est également disponible en français.
This document isn’t intended to provide specific advice and shouldn’t be relied on as such. It’s intended as an
overview only. No action or decision should be taken without detailed independent research and professional
advice concerning the specific subject matter of such action or decision. While Export Development Canada
(EDC) has made reasonable commercial efforts to ensure that the information contained in this document is
accurate, EDC doesn’t represent or warrant the accurateness, timeliness or completeness of the information
contained herein. This document or any part of it may become obsolete at any time. It’s the user’s responsibility
to verify any information contained herein before relying on such information. EDC isn’t liable in any manner
whatsoever for any loss or damage caused by or resulting from any inaccuracies, errors or omissions in the
information contained in this document. This document isn’t intended to and doesn’t constitute legal or tax
advice. For legal or tax advice, please consult a qualified professional. EDC is the owner of trademarks and
official marks. Any use of an EDC trademark or official mark without written permission is strictly prohibited.
All other trademarks appearing in this document are the property of their respective owners. The information
presented is subject to change without notice. EDC assumes no responsibility for inaccuracies contained herein.
Copyright © 2021 Export Development Canada. All rights reserved.
30You can also read