Basic Demand Projection - 13th April 2021 - TITLE TO GO HERE - CCREEE
←
→
Page content transcription
If your browser does not render page correctly, please read the page content below

TITLE TO GO HERE
TEXT TO GO HERE

Basic Demand Projection

 Click to edit Master title style
13 April 2021
 th
 Click to edit Master text styles
 Second level
 Third level
 Fourth level
 Fifth level

 1

Presenters

 Prof. Chandrabhan Sharma Dr. Sanjay Bahadoorsingh
 Dept. Electrical and Computer Dept. Electrical and Computer
 UWI, St. Augustine UWI, St. Augustine
 2

Overview

● Introduction
● Loads
● Load Forecasting
● Factors to Consider
● Demand Projection Techniques
● Closing Remarks

 3

Questions

What is the probability of a coin toss being heads or tails? 50%
What is the probability that you will always get it correct? 0%
Why is the forecast different from the actual? avoid
Why does the forecast fail to capture these features from the actual? encourage

 Many decision making processes today are still difficult to
 capture in a probabilistic form.
 4

Introduction

 1
History

● Forecasting is a necessary and important
 function in any industry.

● The first oil crisis of the 1970s caught the
 attention of policymakers.

 6

Introduction to Load Forecasting

● Energy/demand forecasting is the first step in the energy planning
 process.

● Who needs/uses it:
 ● Electric Utilities
 ● Policy Makers
 ● Manufacturers and Suppliers

 7

Introduction to Load Forecasting

● Demand and consumption are also used instead of load.

● Energy (MWh, kWh) and power (MW, kW).

● Demand forecast - To determine capacity of generation, transmission
 and distribution required.

● Energy forecast - To determine the type of generation facilities
 required.
 8
Linking to the IRRP

 9
UNEP Collaborating Centre on Energy and Environment
Load Forecasting Objective

● Objective is to minimize errors.

● Consider the plethora of risks facing the utility and
 the sector.

 From a planning perspective demand forecasts
 should be slightly higher.
 10
Uses of Load Forecast

● Cost of Service - to determine full costs of providing electricity for all
 customers. Used by utility and regulator.
● Development of Rate Design - requires a projection of the kWh
 consumption in each rate class over a horizon of about one or two
 years.
● Demand Response - consumers incentivized to participate in grid
 management modifying their consumption profile.
● Energy Efficiency - managing and restraining the growth in energy
 consumption.
 11
Loads

 1
Load Profile

 13

Lawrence Berkeley National Laboratory
Definitions

● Demand:
 ○ Load averaged over a specific time.
 ○ Load can be kW, kVAr, KVA or A.
 ○ Time interval important (usually 15 minutes)
● Maximum Demand:
 ○ Largest demand over time period.
 ○ Must state demand interval, period and units
 e.g. 15 mins. Max kW demand for week =
 150kW
● Average Demand:
 ○ Average of the demands over a specific period
 (day, week, month).

 14
Definitions

● Demand Factor:
 ○ Ratio of maximum Demand to total connected load.
● Diversity Factor:
 ○ = Max. non-coincident Demand / Max. diversified Demand
● Load Factor:
 ○ = Avg. Demand of any individual (or group) customers / Max.
 Demand for the same period

 15
Load Classification

 Domestic/Residential Commercial
 Demand factor: 70-100% Demand factor: 90-100%
 Diversity factor: 1.2-1.3 Diversity factor: 1.1-1.2
 Load factor: 10-15% Load factor: 25-30%

 Industrial Others
 Small-scale: 0-20 kW eg. Streetlights
 Medium-scale: 20-100 kW Demand factor: ~100%
 Large-scale: 100 kW and above Diversity factor: ~1.0
 - Demand factor: 70-80% Load factor: ~50%
 - Load factor: 60-65%
 16
Load Growth

 New Customers New Usage
● Increased electrification ● New appliances
 initiatives ○ Electric stove
● New construction ○ Air conditioning
 ○ Urbanisation (housing, ○ Electric vehicles
 commercial centres) ○ Energy storage
 ○ Industrial facilities ○ RE technologies
● Population movement
 ○ Relocation
 ○ In-land migration

 17
Load Forecasting

 1
Load Forecasting

 A systematic procedure for quantitatively defining future
 loads.
 19
Types of Load Forecasting

 Short Term Load Forecasting

 Medium Term Load Forecasting

 Long Term Load Forecasting

 No single forecast that can satisfy all of the needs of a utility.
 A common practice is to use different forecasts for different purposes.
 20
Short Term Load Forecasting

● This forecasting method is usually has period ranging from one hour to 1 to 2
 weeks. Workdays + weekends.
● Limited by horizon of temperature prediction.
● Mean Absolute Percentage Error (MAPE) < 5% acceptable.

● Short term forecasting is used to provide obligatory information for the system
 management of daily operations, security analysis, economic dispatch, fuel
 scheduling, system maintenance and unit commitment.

 Techniques: Time series analysis (AR, ARX, ARMA etc) | Multiple linear regression | Expert
 systems approach (neural networks, fuzzy logic, particle swarm optimization)
 21
Medium Term Load Forecasting

● This forecasting method has its period ranging from one week to one
 year.
● The forecasts for different time horizons are important for different
 operations within a utility company.

● Medium term forecasting is used for the purpose of scheduling fuel
 supplies, maintenance of the power system and unit management.

 22
Long Term Load Forecasting

● This forecasting method has its period which is longer than a year.

● It is used to supply electric utility company management with precise
 prediction of future needs for expansion, equipment purchase or staff
 hiring.

● Top-down | Bottom-up Load Forecasting

 Techniques: Trend Analysis | Linear multivariable regression | End use
 method | Scenario approach
 23
Factors for Consideration

 Horizon Weather Load Economy Data Collection

 Temperature Hourly Customer income Hourly
 Humidity Daily Population size Daily
 Wind speed Weekly Population growth Weekly
 Rainfall Peak GDP Yearly
 Cloud cover Average Weekdays
 Weekends/holidays
 Special events

 Short term X X

 Medium term X X X

 Long term X X
M. Mustapha, M. W. Mustafa, S. N. Khalid, I. Abubakar and H. Shareef, "Classification of electricity load forecasting based on the factors influencing the load
consumption and methods used: An-overview," 2015 IEEE Conference on Energy Conversion (CENCON), Johor Bahru, Malaysia, 2015, pp. 442-447. 24
doi: 10.1109/CENCON.2015.7409585
Top-down Load Forecasting

Efficient | Consistent | Business Oriented

● Developing weather indices e.g. hourly temperature, max/min daily temperature,
 max/min monthly temperature, average daily temperature, average monthly
 temperature, cooling degree days (CDD above 18 degC).
● Developing macroeconomic e.g. Gross Domestic Product (GDP), number of
 customers, population, price of electricity, interest rate.
● Developing model(s) for each revenue class e.g. residential load usually has a
 higher correlation with temperature variables than the industrial load.
● Developing scenarios e.g. weather conditions, economy projections, energy
 policies, revenue class (separately and collectively)

 25
Bottom-up Load Forecasting

● Aggregates forecast first at a lower level then vertically integrates to
 revenue level class.
● Conservative and often higher than necessary. Unrealistic extreme at
 the top level (over forecasting).
● Becomes inefficient, inconsistent and does not meet business needs
 when the geographical area is large enough to have variation with
 employed models, duplication of resources and many iterations to
 reduce conservativeness.

 26
Over Forecasting & Under Forecasting

 Over Forecasting Under Forecasting

Upgrading Infrastructure Increase spending Insufficient spending

Rates Increasing more than needed Decreasing more than needed

Gen | Tran | Dist More investment than needed Less investment than needed

Reliability Improve with higher $ Reduce with lower $

Cost of Service Higher Lower

Demand Response More load to be shifted with less Less load to be shifted with
 incentives less incentives

Energy Efficiency More investment than needed Insufficient than needed.
 Missed opportunities for new
 27
 technologies
Forecasting Horizon

● The forecast horizon should cover the planning horizon.

● The longer the forecast horizon, the more unpredictable the load.

● The data history should be two to three times of the forecast horizon.

● Access to longer than 30 years of load history is rarely available.

 28
Forecasting Horizon

There are two remedial methods to resolve the insufficient data issue in
long term load forecasting:
 ○ 1) Make the forecast updating cycle less than half of the length of the
 data history,
 ○ 2) Probabilistic load forecasts, to better describe the associated
 uncertainties.

 29
Forecasting Horizon

 Updating Cycle Forecast Horizon

Financial Planning 1 to 5 years 1 to 20 years

Generation Planning 1 to 2 years 5 to 30 years

Transmission Planning 1 to 2 years 5 to 30 years

Distribution Planning 1 to 2 years 1 to 20 years

Integrated Resources and 3 to 10 years 10 to 50 years
Resilience Planning

Renewable Energy Planning 1 to 2 years 1 to 30 years

 30
Long Term Demand Forecast

IDB Load Forecast of LAC (2017-2040)

 CAGR - Compound Annual Growth
 Rate

 31
Long Term Demand Forecast

 32
National Electric Reliability Council forecast vs. actual data
A Short Break
 Before we switch presenters

13th April 2021 Demand Side Projection 33
Factors to Consider

 1
Factors

● Class of customers (residential,
 commercial, industrial, agricultural, public,
 etc.)
● Special events (TV programmes, public
 holidays, etc.)
● Population
● Economic indicators (per capita income,
 Gross National Product (GNP), Gross
 Domestic Product (GDP), etc.)
● Electricity price
● Trends in using new technologies
 35
Factors

● Hours of the day (day/night)
● Day of the week (week day/weekend)
● Time of the year (season)
● Weather conditions (temperature and
 humidity)
● Application use

 36
Load Forecasting

● Customer Class
 ○ Domestic/Residential
 ○ Commercial
 ○ Industrial
 ○ Street Lighting
● Electric Vehicles
● Distributed Generation
 ○ Renewable Energy Generation + Energy Storage

 37
Building Blocks

 38

Adapted from CCREEE
Impact of Weather

Present condition of meteorological elements | two weeks

● Causes variations in domestic and commercial loads and public
 lighting
● Main weather variables that affect the load are:
 ○ Temperature affects
 ○ Cloud cover cooling ● Height of the cloud cover
 Visibility ● Thickness
 affects
 ○
 ● Cloud amount
 Precipitation
 lighting
 ○
 ● Time of occurrence and
 ○ Rainfall duration
 ○ Thunderstorm
 ○ Flooding
 ○ Wind speed 39
Including Weather Variables

● Weather variables used differently for short versus long term load
 forecasting.

● In short term load forecasting, weather forecasts throughout the
 forecasting horizon are used to produce load forecasts.

● Accuracy of weather forecasts affects the accuracy of load forecasts.

 Features presented by the data will guide inclusion.
 Importance of accurate dataset.
 40
Including Weather Variables

● In medium and long term load forecasting, weather simulation
 approach is preferred. Based on historical weather information.

● Create and generate scenarios based load forecasts.

● Resolution of weather data should have same or better resolution as
 load data.

 Studies to confirm validation of including variables other than temperature in long
 term load forecasting.
 41
Temperature

 ● Average temperature is the most significant on load variations.
 ● Temperature and load are non-linearly related. Heating and cooling.
 ● Non-linearity is further complicated by humidity. E.g. extended periods
 of extreme heat, air conditioning usage increased

https://www.ncdc.noaa.gov/sotc/global- 42

regions/202009#region-year-to-date
Temperature

 43

https://www.ncdc.noaa.gov/climate-monitoring/
Model Weather Variables

 To determine impact of weather variables (climate change) on load
 demand, it is essential to analyze data concerning different weather
 variables and calculate regression models for inclusion into the models.

 44

https://images.app.goo.gl/HfS1nD7mT2DuDgVK8
Load vs Temperature Relationship

 linear symmetrical asymmetrical

 Piecewise linear models 2nd order polynominal 3rd order polynominal
 regression model regression model
“Load Forecasting Case Study”, Tao Hong, University of North Carolina at Charlotte 45

and Mohammad Shahidehpour, Illinois Institute of Technology, 2015.
Load vs Temperature Relationship

 Piecewise linear models
 would yield the
 segments required for
 cooling only.

 10 degC 20 degC 30 degC
https://www.researchgate.net/figure/Relationship- 46
between-load-and-temperature_fig2_310834746
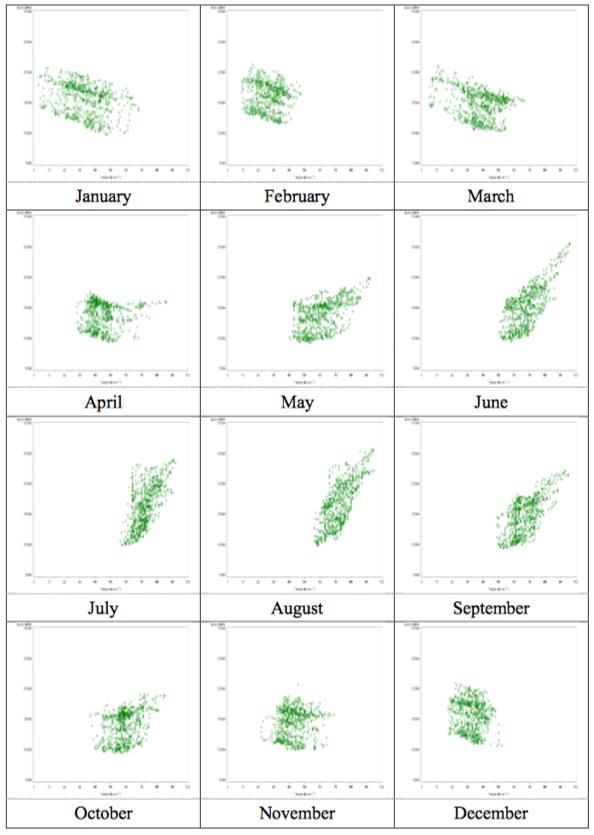
Monthly

 This example is cooling

“Load Forecasting Case Study”, Tao Hong, University of North Carolina at Charlotte 47

and Mohammad Shahidehpour, Illinois Institute of Technology, 2015.
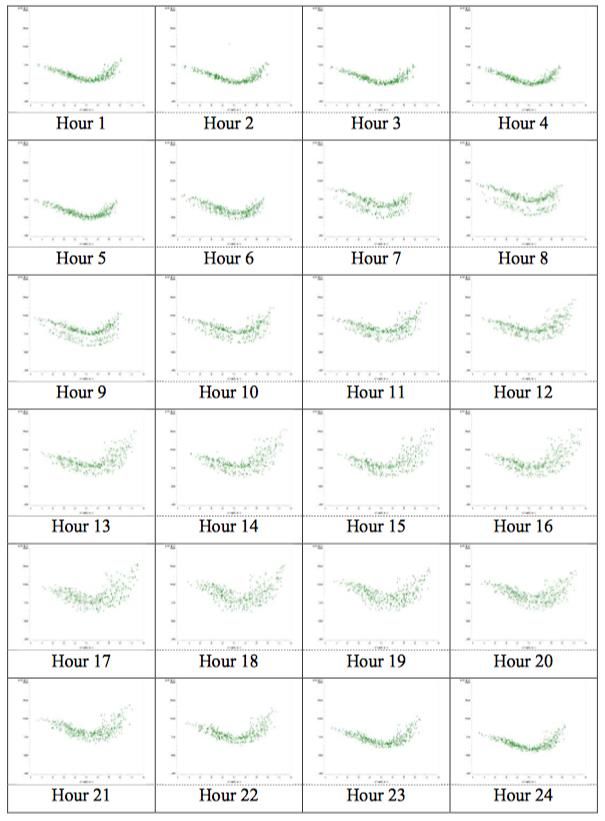
Hourly

 Recency Effect - temperatures of the current and
 preceding hours affect the load.

 This example is heating and cooling

“Load Forecasting Case Study”, Tao Hong, University of North Carolina at Charlotte 48

and Mohammad Shahidehpour, Illinois Institute of Technology, 2015.
Lagged Temperature Variables
 Temperature of
 hour t

 Exponentially weighted temperature to assign higher
Average temperature of the dth weights to the recent hour temperatures.
 24-hour period
 Where α is the base for the exponential weights with
 the typical range from 0.8 to 1.

 49
Correlation

 High correlation near 1

 Hourly Temperature and Hourly Load Hourly Wind Speed and Hourly Load
 R=0.8493 R=0.2538
Classification of electricity load forecasting based on the factors influencing the load consumption and methods used: An
 50
overview.
Econometric Model

● Econometric models are constructed from economic data with the aid of the
 techniques of statistical inference.
● Equations that are estimated from the data are usually derived from first-order
 conditions from an optimization problem (utilisation or profit maximization).
● The data on behaviour (purchases of goods) is used to infer the underlying
 structure of technology or tastes. Once the underlying structure is known, the
 model can be used to predict the quantity of a particular commodity that will be
 consumed at any set of relative prices and income or output.
● In other words, the entire schedule is inferred from a discrete set of
 observations on agent behaviour.

 51
Econometric Model Development - 5 Steps

Define likely explanatory
variables
 ● Customer segmentation
 defined.
 05 Test and validate model
 ● Determine error and plot
 ● Develop a list of the major forecasts in historical data
 events that cause them not period.
 to consume electricity.
 Identify at least 10
 01 04
 ●

 variables. Perform multiple regression
 analysis
Define functional ● Statistically determine which
relationship of driving variables are retained in
 the regression.
explanatory variables and
load demand
 Understand key
 ●
 Research time series of
 assumptions 02 03 these variables
 ● May have lags effects.
 ● Typically data for 20 years back
 collected to forecast 10 or 15
 years into the future.
 ● Be aware of changed market 52
 forces.
Domestic/Residential

 Energy Sales S(t), Influenced by Single family, duplex, apartment
 buildings, townhouses
time lagged

 ● Personal disposable income, PDI
 ● Price of electricity, P
 ● Number of customers, C
 ● Inflation
 ● People per household
 ● Air conditioning A real example: Multifactorial Approach | Econometric Model

 ● Appliance price index customer elastic (greatest
 impact)
 ● Fuel price most sensitive

 ● Technology (changes in energy logS(t)= -4.13 + 1.72logC(t)- 0.161logP(t-1) + 0.363logPDI(t-1)
 intensity) least sensitive and
 Correlation factor = 0.94 negative!
 Error = 1.4% 53
Survey based Social and
 forecast behaviour inputs

 Efficiency of end-
 use appliance

End-use forecast Economic activity
 Useful energy Final energy
 demand Demand

 Secondary energy
 mix

 Technological
 determinants

 54
End-Use Model

 ● AC Saturation (central/distributed) ● Saturation levels (water heater,
 ● AC efficiency appliances, lighting densities,
 ● Thermal efficiency plug loads)
 ● Home size ● Appliance efficiency
 ● Income ● Income
 ● Household size ● Household size
 ● Price ● Price

 Cooling Degree
 XCool XOther Billing Days
 Days

 Load(t) = a +bc*XCool(t) +bo*XOther(t) + e(t)
 XCool and XOther are structured variables that account for saturation levels, average
 efficiency levels, and usage trends of end-use categories in an econometric framework.

Itron white paper: Incorporating DSM into the Load Forecast 55
Data Requirements

Econometric Models will require:
● Historic and projected GDP
● Projected Electricity Price (usually assumed constant)
● Previous demand (recursive in nature)

End-user Model:
● Technology based (energy intensity)
● GDP
● Population growth
 Improper data selection and poor data analysis lead to low
 accuracy
 56
DSM Influence

 Adjust the load forecast by accounting for the amount and the continuing momentum of the historic
 DSM contained in the load forecast model

 57
Itron white paper: Incorporating DSM into the Load Forecast
Commercially Available Applications

SAS Energy Forecasting: https://www.sas.com/en_us/software/energy-forecasting.html

ITRON https://www.itron.com/it/solutions/product-catalog/metrixidr-system-operations

LoadSeer http://willdan.com/ServiceBrochures/IA%20Flyer_LoadSEER_v5.pdf

Etap https://etap.com/product/load-forecasting-software

EnFor https://enfor.dk/services/loadfor/

 58
Demand Forecasting Techniques

 1
Steps in Demand Forecasting

● Determine the use of the forecast
● Select the items to be forecast
● Determine the time horizon of the
 forecast
● Select the forecasting model(s)
● Gather the data
● Make the forecast
● Validate and implement results

 60
Forecasting Methods

 61
Quantitative Methods

 62
Let’s try an example - Moving Average

 63
Example - Moving Average

 Moving Moving Moving Moving
Year Actual Total Averge Year Actual Total Averge
 (n=3) (n=3) (n=3) (n=3)

2004 6 n/a n/a 2004 6 n/a n/a

2005 4 n/a n/a 2005 4 n/a n/a

2006 5 n/a n/a 2006 5 n/a n/a

 6+4+5 6+4+5
2007 7 15/3=5 2007 7 15/3=5
 =15 =15

2008 9 4+5+7 16/3 =
 2008 9
 = 16 5.333
2009 n/a
 2009 n/a 64
Example - Moving Average

 Moving Moving
 Year Actual Total Averge
 (n=3) (n=3)

 2004 6 n/a n/a

 2005 4 n/a n/a

 2006 5 n/a n/a

 6+4+5
 2007 7 15/3=5
 =15

 4+5+7 = 16/3 =
 2008 9
 16 5.333

 5+7+9 = Can add weights based on intuition to produce the weight
 2009 n/a 21/3 = 7
 21 moving average. 65
Disadvantages - Moving Average

● Increasing N makes forecast less sensitive to changes
● Do not forecast trend well due to the delay between actual outcome
 and forecast
● Difficult to trace seasonal and cyclical patterns
● Require much historical data
● Weighted Moving Average may perform better

 66
An Example - Exponential Smoothing

 2004 6
You’re a manager of a shop that sells
preserved fruit. You wish to forecast the sales 2005 4
of red mango for 2009 using single
 2006 5
exponential smoothing = 0.4.
 2007 7
 2008 9
 2009 ?

 67
Example - Single Exponential Smoothing

Year Actual Prediction

2004 6

2005 4 6

2006 5 5.2 6 + (4-6)*0.4

 5.2 + (5-
2007 7 5.12
 5.2)*0.4

 5.12 + (7-
2008 9 5.87
 5.12)*0.4

 5.87 + (9-
2009 n/a 7.13
 5.87)*0.4 68
Growth Rate

 69
Elasticity

 Average
 Elasticity
 0.73

 70
Models

 71
Which method do I choose?

●Depends on how expert one is in that method (time series analysis, expert
 systems and artificial intelligence).
●Optimum forecast performance
 ○ Applicability and accuracy
 ○ Availability of data
 ○ Size of population

 72
Closing Remarks

 1
Facts in Forecasting

● Main assumption: Past pattern repeats itself into the future.
● Forecasts are rarely perfect: Don't expect forecasts to be exactly equal
 to the actual data.
● The science and art of forecasting try to minimize, but not to eliminate,
 forecast errors. Forecast errors mean the difference between actual
 and forecasted values.
● No forecasting method is effective in all situations.
● Good judgment, intuition, commercial knowledge and experience to
 make a forecasting method effective.
 74
General Takeaways (1)

● Load forecasting is key for utility planning and financial survival.

● Ever changing risks including generation resource mix, environmental
 regulation, aging assets and infrastructure, the projected low cost of
 natural gas, decreasing costs of renewable technologies, new electric
 appliances.

● Accurate (as possible) load forecasts for resource planning, rate cases,
 designing rate structures and financial planning are required.
 75
General Takeaways (2)

● Installed smart grid technologies now contribute to granular big data.

● Many factors influence and each model is tailored for each utility, each
 year.

● Errors exist.

 76
Sources of Errors

● Data sources.

● Key information (usually about loads) not considered.

● Forecasts yield higher than physical limit of the end use.

 77
Forecasting Evolution

 78

Itron Integrated Energy Forecasting Framework White Paper
Thank You

13th April 2021 Demand Side Projection 79
References

 ● “Electric Power System Planning: Issues, Algorithms and Solutions”, Hossein Seifi and Mohammad Sadegh Sepasian, Springer-
 Verlag Berlin Heidelberg, 2011.
 ● “Electrical Power Systems Planning”, A.S. Pabla, Macmillan India Ltd.,1988.
 ● “Power System Planning”, R.L. Sullivan, McGraw-Hill International
 ● “Power Distribution Planning Reference Book”, H. Lee Willis, Marcel Dekker Inc.
 ● “Load Forecasting Case Study”, Tao Hong, University of North Carolina at Charlotte and Mohammad Shahidehpour, Illinois
 Institute of Technology, 2015
 ● Cai, Guowei & Wang, Wenjin & Lu, Junhai. (2016). A Novel Hybrid Short Term Load Forecasting Model Considering the Error of
 Numerical Weather Prediction. Energies. 9. 994.10.3390/en9120994.
 ● Itron’s Integrated Energy Forecasting Framework: Data-driven insights to take action in the era of Distributed Energy Resources
 ● Mustapha, Mamunu & Mustafa, Mohd & Abd Khalid, Saifulnizam & Abubakar, I. & Shareef, Hussain. (2015). Classification of
 electricity load forecasting based on the factors influencing the load consumption and methods used: An-overview. 442-447.
 10.1109/CENCON.2015.7409585.
 ● Itron white paper: Incorporating DSM into the Load Forecast

 80
You can also read