Meeting with Vinnies, SACOSS, PIAC and the EDPR Customer Forum

Page created by Regina Goodwin
 
CONTINUE READING
Meeting with Vinnies, SACOSS, PIAC and the EDPR Customer Forum
Meeting with Vinnies, SACOSS, PIAC
and the EDPR Customer Forum

18 October 2018
Meeting with Vinnies, SACOSS, PIAC and the EDPR Customer Forum
Agenda

Item   Topic

1      Safety topic

2      Objectives for today

3      Customer Forum status update

4      What we’ve heard from our customers

5      Improving customer experience

6      Life support customer initiatives

7      Revenue, demand, expenditures and RAB

8      DER integration

9      Network innovation

10     2022-27 TRR: Customer engagement approach

                                                   2
Meeting with Vinnies, SACOSS, PIAC and the EDPR Customer Forum
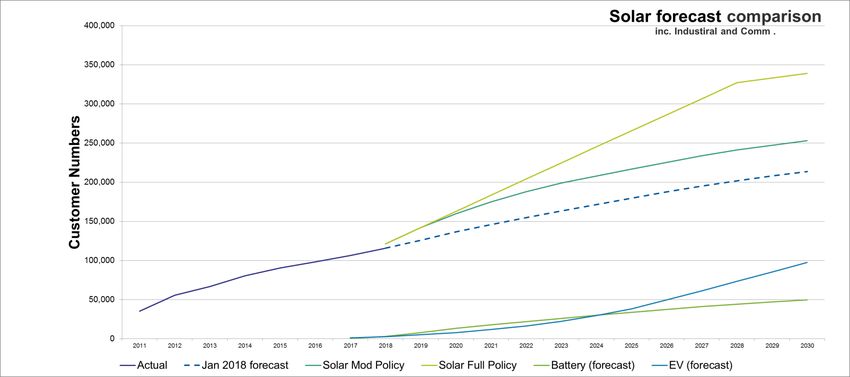
Safety topic – Stop for Safety 2018
 Company wide program to encourage                                Critical risks
  engagement and participation in safety
                                                   Key risks that can cause significant injuries or
  leadership at all levels
                                                                      fatalities
  › Target for minimum participation levels
    across the business of 90%                1.     Electrocution
                                              2.     Hit by object, plant or equipment
                                              3.     Motor vehicle
                                              4.     Fall from height
 Managers must set aside 1 hour during       5.     Customer aggression & working alone
  October to hold a Stop for Safety event     6.     Excavation, trenching, confined spaces & gas
  with their team                                    ignition
                                              7.     Fatigue
                                              8.     Catastrophic network asset failure
 The focus this year is on:                  9.     Personal wellbeing – mental health

  › Critical risks; or
                                                         Behaviour impacts on safety
  › Behaviour impacts on safety
                                                   5 states of mind which are often identified as
                                                          contributing factors in incidents
 Our team is focussing on Managing
  Pressure and Fatigue                                             D = Distraction
                                                                    R = Rushing
                                                                     F = Fatigue
                                                                   F = Frustration
                                                                  C = Complacency
                                                                                                    3
Meeting with Vinnies, SACOSS, PIAC and the EDPR Customer Forum
Objectives for today

 Provide an update on the outcomes so far of the Customer Forum
  negotiation process

 Listen to stakeholder views on key elements of our proposal (both in
  and out of the scope of negotiations), prior to publishing the draft in
  December 2018

 Opportunity for Customer Forum to privately test its negotiating
  positions and conclusions with stakeholders.

                                                                            4
Meeting with Vinnies, SACOSS, PIAC and the EDPR Customer Forum
Customer Forum status update
Meeting with Vinnies, SACOSS, PIAC and the EDPR Customer Forum
The scope of negotiations

     In-scope (AER               In-scope (AusNet           Out of scope / context
       endorsed)                     Services)
                                                            •   All other capital
•   Operating expenditure    •   Replacement                    expenditure
•   Augmentation                 expenditure - major        •   Rate of return
    expenditure - major          projects (i.e. station     •   Tax allowance
    projects (i.e. station       rebuilds)                  •   Opening RAB
    rebuilds)                •   DER integration            •   Pricing and tariffs.
•   Customer experience      •   Innovation expenditure
    and hardship             •   Metering
    arrangements             •   Price path
                             •   Overall ‘reasonableness’
                                 of proposal

                                                                                       6
Meeting with Vinnies, SACOSS, PIAC and the EDPR Customer Forum
Areas of preliminary agreement

   Most elements of opex forecasting approach (i.e. base, trend,
    regulation-driven step changes)

   Various customer initiatives for implementation by 2020

   An improved customer service incentive scheme from 2021

   Funding for network innovation projects

   Metering revenues (subject to a commitment to implement customer
    initiatives, and comparison with other Vic. DNSP forecasts)

Preliminary agreements reached will be reflected in the Draft Proposal
published in December, to be tested with wider stakeholders prior to
                                                                         7
lodgement of the formal proposal in July 2019
Outstanding matters

  Augex/repex major projects
   › The Forum is seeking further information (e.g. on non network
     alternatives, demand forecasting methodology, how we prioritise projects
     etc.) before negotiating on these topics in November

  DER integration
   › AusNet Services is currently working through impacts of Vic. Govt. Solar
     Subsidy policy
   › We have tested high level DER connection charging options with the
     Forum, and will consult on these in our draft proposal in December

  Price path
   › To be negotiated in November, once draft proposal revenues are finalised.

A second period of negotiations is scheduled for early-mid 2019, to test
propositions in more detail and address stakeholder feedback on the draft
                                                                                 8
proposal
Questions for attendees

 Do stakeholders have views on:
  › The areas of negotiation between AusNet Services and the Forum; and/or
  › The preliminary agreements reached.

                                                                             9
What we have heard from our
customers
Research highlights
                                                                          Of small businesses
Outages                                                      15%          have installed back-up
                7.8/10                                                    power generation
Consistent      Overall satisfaction
with views                                                   We still need to do better
                with supply                                  with our proactive
5 years ago,
majority of     Anecdotally, heightened concern about        communications around
                reliability, particularly amongst business
customers       customers, small and large.                  outages.
are satisfied                                                Customers want to know the reasons for
with                                                         outages.
                               Residential customers
reliability     63%            considered annual
                               blackouts were
                                                             The main reasons customers contact
                                                             AusNet Services is to get outage
                                                             information or tell us about an outage.
                               acceptable.
                               Businesses are less           Providing a reliable,
                               tolerant of outages.          continuous electricity supply
                                                             was rated as the most valued
                                                             service.
                                Small business
                 96%            customers considered
                                a reliable energy
                                                               “Lifeblood of
                                supply as very                  the house.”                        11
                                important
Research highlights

Affordability                                                         Many customers felt the
                    ~1/3           Customers thought their
                                   bills were poor or very poor       reason for bills increasing
                                   in terms of affordability.         was (at least partly) due to
Current
                                                                      profiteering by electricity
electricity costs                                                     retailers and distributors
and future price
rises are a
                    ~2/3           Residential customers
                                   believe that their electricity
concern for all                    provided poor value for
customers                          money.                             For vulnerable
                                   Small businesses believe           customers, we need to
                    ~1/3           that their electricity provided
                                   poor value for money.
                                                                      understand energy
                                                                      stress in the context of
                                                                      other pressures in their
                                                                      lives. A more holistic
                    ~2/3           of customers felt electricity
                                   bills have increased in the        approach to this
                                   past 2 years.                      segment is required.
                    For many business customers (small and large)
                    electricity prices are surpassing labour costs.

                    Voluntary demand management programs generally seen as a positive way
                    to reduce expensive network upgrades. Community education seen as
                    critical to driving participation.
Research highlights

                          of solar customers                    Customers said
 Control
An emerging
              ~80%        would be very             ~9%         they would
                          unhappy if their                      probably or
theme
                          energy exports were                   definitely go off-
amongst
customers                 restricted (time of day               grid in the next
is concern                or amount of energy)                  ten years.
about an
increasing    The ability to exercise choice is     Amongst C&I customers,
                                                    significant investment in
lack of       closely tied to perceptions of        capability to drive energy
control       control.                              independence.

              Complexity and lack of optimism       Network management
              about outcomes deter customers        strategies like demand
              from becoming engaged.                response and active
                                                    solar export limiting are
                          of customers try to       viewed by many
              >70%        reduce energy use, but    customers as a further
                          many are unaware that     loss of individual
                          smart meters can help.    control.
                                                                                 13
Research highlights

                              of non-solar customers     Solar is viewed as
  Interest in
     new
                   58%        are interested in
                                                         beneficial, as is the idea of
                                                         modernising the network to
                              installing solar           accommodate it.
 technology
                              of small business
Solar remains      21%        customers have installed
                                                         49% of customers think the
                                                         government should pay for
the dominant                  solar for their business   solar-related network upgrades.
area of interest
                              of customers are
and investment
                   ~1/2       interested in purchasing
                                                         Anecdotally, despite
                                                         understanding solar
Increasing                    a battery.                 cross-subsidies,
awareness of,                                            customers (incl.
and intent to                                            vulnerables) are prepared
                   Interest in electric vehicles was
purchase                                                 to pay for solar network
batteries and      relatively limited.
                                                         upgrades.
EVs
                   Interest in renewables is lower
                                                         Enablement of solar is
                   among businesses than residential
                                                         analogous to a public good,
                   customers, due to the high
                                                         so funding to accommodate
                   consumption and consequent long
                                                         solar should be shared.
                   pay back periods.
Research highlights

                   Bills, tariffs, retail offers and the   Customers want to
Information
                   industry itself are too                 know which
   needs           complicated for customers to            appliances/
                   navigate.
Apart from                                                 equipment
outage
                   Customers don’t trust the               consumes the most
information,
                   energy information they receive,        power –
customers are
looking for ways   as they see it as biased.               information to help
to reduce bills                                            understand how
and be more                         of customers           behaviour impacts
energy efficient   >70%             would like to be       bills.
                                    notified if their
                                    energy                 Preference for multi-
                                    consumption            channel approaches to
                                    was outside its        communications,
                                                           depending on nature of
                                    normal range
                                                           communications and
                                                           individual preferences.
                                                                                     15
Questions for attendees

 Do stakeholders consider the research findings are reflective of
  customer preferences and concerns?

                                                                     16
Improving customer experience
Improvements being made in the 2016-20 period
Several initiatives are underway to improve
customer experience by 2020

                                                         Collaborating with the community
1   Turning the organisation to face the customer
                                                     5

                                                         Making our organisation easier to deal with
2   Aligning our incentives with customer outcomes
                                                     6

    Building our understanding of our customers’         Taking care of our most vulnerable customers
3   needs                                            7

    Fixing customer pain points and improving the        Making our claims process easier for all
4   customer experience                              8   customers

                                                                                                       18
Questions for attendees

 Do stakeholder have views on the eight initiatives?

 Are there other initiatives that we should be considering?

                                                               19
Improving customer experience
An improved customer service incentive
scheme from 2021
Customer Satisfaction Incentive Scheme
 AusNet Services is proposing that a new Customer Satisfaction Incentive
  Scheme (CSIS) be introduced from 2021. This will encourage
  improvements in customer satisfaction regarding:
  › Connections
  › Planned outages
  › Unplanned outages
  › Complaint handling.

 AusNet Services has commissioned a quarterly survey of our residential
  and business customers satisfaction, where customers report their
  satisfaction on a scale between 0 and 10. We propose to use the average
  overall satisfaction score as the scheme parameters and measure this
  against target performance.

 Targets will be set on existing performance, so AusNet Services is rewarded
  for improving above existing levels and penalised if performance declines.
                                                                                21
Customer Satisfaction Incentive Scheme
 We propose a total of 0.5% revenue at risk (approximately $3.5million per
  annum) for this scheme. This would replace the existing telephone
  answering parameter in the STPIS (which we propose to remove).

    Scheme Parameter                            Revenue at Risk

    Satisfaction with Planned Interruptions                $1.0M
    Satisfaction with Unplanned Interruptions              $1.0M
    Satisfaction with Connections                          $1.0M
    Satisfaction with Complaints                           $0.5M
    Total                                                  $3.5M

                                                                              22
Questions for attendees

 Do stakeholder have views on the design of the proposed customer
  service incentive scheme, e.g.:
  › Replacing the STPIS telephone answering measure
  › The proposed performance measures
  › The proposed revenue at risk

                                                                     23
Life support customer initiatives
We are implementing changes to protect
our most vulnerable customers

 Improve restoration times for life support customers experiencing an
  outage. Utilise information received from smart meters to identify life
  support customers off supply and improve timeliness of reconnection of
  these customers.
  › Effective from 31 October 2018

 Consistent and “plain language” compensation and claims fact sheet
  that is easily accessible by customers.
  › Effective from 31 October 2018

 Enhance communications to vulnerable / life support customers.
 Enhance and expand communications to vulnerable and life support
 customers in advance of network events, to include SMS, social media and
 community messaging channels.
 › Effective from December 2018

                                                                            25
Questions for attendees

 What are stakeholder’s views on these initiatives?

 Are there other initiatives we should be considering to support and
  protect life support customers?

                                                                        26
Revenues, demand, expenditures
and RAB
Revenue and average bill forecasts
Revenue per customer (the average bill)

Revenue per customer is forecast to decline by 5% ($46) in 2021, and
by a further 2% ($19) by 2025

                                                                       28
Total revenue

Total revenue is forecast to be 3.2% higher than 2016-20 revenues, or
2% less if incentive payments are excluded

                                                                        29
Questions for attendees

 Do the revenue forecasts appear reasonable?

                                                30
Revenues, demand, expenditures
and RAB
Operating expenditure forecasts
Base year
We have made significant opex savings in the current period, lowering
prices from 2021
                                             •   Base year - 2018

                                             •   Negative adjustment for leases
                                                 ($6M) - change in the approach to
                                                 leases – these will be capitalised
                                                 from 1 April 2020 onwards and so
                                                 are removed from the base year

                                             •   Bottom-up forecasts of:
                                                   • GSL Payments ($49M) –
                                                      Forecast based on historical
                                                      GSL payments.
                                                   • Metering re-allocation from
                                                      ACS to SCS ($32M) – to
                                                      accurately reflect the usage
                                                      of these assets by the
                                                      distribution business.
                                                   • Debt raising costs ($12M) –
                                                      Forecast using AER’s
                                                      benchmark approach
                                                                                  32
Step changes
Step change expenditure is principally driven by regulatory change and
opex/capex trade-offs
                                               •   REFCLs ($9 million) – A
                                                   compliance-driven safety
                                                   program, this requires in
                                                   additional annual testing
                                                   requirements of the REFCL
                                                   equipment.

                                               •   IT cloud transition ($9 million)
                                                   – A move from on premises
                                                   solutions (capex) to cloud based
                                                   (opex) solutions. This is
                                                   increasingly the service delivery
                                                   option for all IT systems

                                               •   Security ($1 million) – Uplift in
                                                   IT security capabilities, driven by
                                                   emerging regulatory changes.

                                               •   Innovation ($3 million) – see
                                                   slide 46
                                                                                   33
Trend parameters
Our trend parameter forecasting approach is
largely in line with recent AER decisions
                                              •   Labour growth – Using average of
                                                  DAE and BIS reports as accepted
                                                  by the AER in Evoenergy draft
                                                  decision.

                                              •   Growth parameters – Using the
                                                  AER approach as applied in AusNet
                                                  Services 2016-2020 decision.
                                                  Modest growth in customer
                                                  numbers, circuit length forecast and
                                                  currently no growth in ratcheted
                                                  maximum demand.

                                              •   Productivity – zero productivity
                                                  applied in line with latest AER
                                                  decisions (noting AER review
                                                  recently commenced)

                                              •   Total of $59 million over the 2021-
                                                  25 regulatory period.
                                                                                     34
Questions for attendees

 Does the opex forecast appear reasonable?

                                              35
Revenues, demand, expenditures
and RAB
Demand forecasts
We only expect small pockets of maximum
 demand growth over 2021-2027

                                                                        Change in
                                                                       demand (MW)

       Doreen

          Clyde North

Driven by new estates in Melbourne’s growth corridors – particularly Clyde North and
Doreen. The bulk of our 2021-25 augmentation program is upgrades in these two areas.   37
However, demand profile is becoming
 ‘peakier’
Total customers are increasing, while energy consumption is declining

                        820,000                                                                           7,700

                        800,000
                                                                                                          7,600
                        780,000
                                                                                                          7,500
                        760,000
      Total Customers

                                                                                                          7,400

                                                                                                                  Energy (GWh)
                        740,000

                        720,000                                                                           7,300

                        700,000
                                                                                                          7,200
                        680,000
                                                                                                          7,100
                        660,000
                                                                                                          7,000
                        640,000

                        620,000                                                                           6,900
                                  2016   2017   2018   2019   2020   2021     2022   2023   2024   2025

                                                   Customers (LHS)          Energy (RHS)

                                                                                                                                 38
Revenues, demand, expenditures
and RAB
Capital expenditure forecasts
Total capex forecast

Total gross capex is forecast to be 9% lower over 2021-25, compared to
2016-20 actual/estimated capex

                                                                         40
Augmentation capex forecast

Augex is forecast to be 8% lower over 2021-25, compared to 2016-20
actual/estimated augex

                                                                     41
Major projects – probabilistic planning and
economic analysis approach

                                                                             Collateral damage
  Establish Baseline
         Risk           =   Safety risk      +       Supply risk       +     & Environmental
                                                                                    risk

 Formulate options to              OPTION              OPTION           OPTION           OPTION
    address risk                     1                   2                3                4

   Options Analysis                Conduct sensitivity analysis and test assumptions:
  compare to Baseline                     Discount rate, VCR, Asset failure rate, demand growth

        Select                             Conduct sensitivity analysis to determine
   Preferred Option                         economical timing of Preferred Option

                                                                                                  42
Augex major project – Clyde North case
                              study
                                            Economic analysis shows that the installation of a new
                                            transformer is justified by 2023

                                                        Supply risk vs. Annualised cost of augmentation ($M)                          •   This project will be subject
                                            1.6
                                                                                                                                          to RIT-D process (project
                                                                                                                                          cost of > $5M)
Supply Risk/Annual Augmentation Cost ($M)

                                            1.4
                                                                                                     Can non-                         •   Non-network options
                                            1.2                                                      network options
                                                  Can non-network options                            be used to defer                     report will explore
                                                  be used to address risk
                                            1.0   before augmentation is
                                                                                                     augmention?                          opportunities to defer
                                                                                   Network                                                network augmentation
                                                  justified?
                                            0.8                                    augmentation is
                                                                                   justified                                              through detailed economic
                                            0.6                                                                                           analysis.

                                            0.4

                                            0.2

                                            0.0
                                               2019          2020           2021       2022             2023            2024   2025

                                                                                       Year
                                                                Supply Risk ($M)      Annualised Augmentation Cost ($M)
                                                                                                                                                                43
Augex major project – Clyde North case
study cont.
 The preferred network option delivers the best reliability outcome
 The deferral and do nothing options reduce short term costs, but
  have significant reliability impacts
                                                                          Price reliability trade-off – Clyde North - Short term

                                                                                                    Clyde North
                                                       800
                                                                  1: Do nothing
       Total expected outage duration 2021-25 (mins)

                                                       700

                                                       600
                                                                                     7: DM +Agg +
                                                                                     Deferral to
                                                       500    4: 2 yr deferral       2026

                                                       400
                                                                      3: 1 yr deferral

                                                       300
                                                                                         5: Embedded                               6: Battery
                                                       200                               generation
                                                                    2: Preferred
                                                                    option
                                                       100

                                                        0
                                                             $-                     $1                 $2                 $3              $4    $5
                                                                                                    Revenue per customer 2021-25
                                                                                                                                                     44
Questions for attendees

 What are stakeholders’ views on the price/reliability trade-off
  framework used to compare and negotiate augex major project
  options?

 Does the augmentation capex forecast overall appear reasonable?

                                                                    45
Connections capex forecast

Net connections capex is forecast to be 14% lower in 2021-25, compared
to 2016-20 actual/estimated capex

                            Gross and net connections capex 2011-25 ($m, Real $2020)
           $140

           $120

           $100

           $80
      $M

           $60

           $40

           $20

             $0
                  2011   2012   2013     2014    2015   2016   2017   2018   2019   2020   2021   2022   2023   2024   2025

                                       Net connections capex      Contributions       Gross Allowance

                                                                                                                              46
We have recently implemented a more cost
reflective customer contributions policy

This has led to a fairer recovery of the connection costs of
residential land developments from 2018

                     2014-16 avg.                                        2018-20 avg. (forecast)
                                  12%                                                          77%

                                                                                23%
                       88%

    Average costs recovered from residential land developers   Average costs recovered from residential land developers
    Average costs recovered from other customers               Average costs recovered from other customers

                                                                                                                          47
Questions for attendees

 Does the net connections capex forecast appear reasonable?

                                                               48
Replacement capex overview

• Repex is forecast to be 28% higher in 2021-25, driven by higher
  expenditure on conductors, cables and poles
• Forecast remains lower than that produced by the AER’s Repex model

The majority of repex is not within the scope of negotiations, and will be tested
                                                                             49
with stakeholders in 2019 through deep dives
Replacement major projects: overview

 The repex forecast includes nine major station asset replacement
  projects, which are being negotiated with the Customer Forum
 These projects account for around 20% of repex and 20% of our total
  customers

                                                                  Direct capital cost
                                     Project             Timing
                                                                       $2020 M

                                     Thomastown          2021           $14.6
                                     Benalla             2022            $8.2
                                     Bayswater           2022           $11.1
                                     Maffra              2022           $16.5
                                     Traralgon Stage 2   2023            $8.7
                                     Watsonia            2023           $19.1
                                     Bairnsdale          2023            $5.9
                                     Warragul            2023           $11.3
                                     Newmerella          2024            $5.4

                                                                                   50
Replacement major projects:
price / reliability trade-offs (short term)
 Option 4 (deferring the three lowest risk projects) would give rise to
  modest price and reliability impacts in the short term, relative to the
  preferred portfolio
   Price-Reliability Trade-Off of Repex Portfolio Options (cost versus outage duration) – Short Term 2021-25

                                                                  140
                                                                             6: Defer all projects out of period
                  Total expected outage duration 2021-25 (mins)

                                                                  130

                                                                  120

                                                                  110
                                                                                 5: 1 yr deferal of
                                                                                 all projects
                                                                  100
                                                                                                          4: Three lowest risk
                                                                                                          projects defered              3: Three project
                                                                   90
                                                                                                          out of period                 deferals + Non
                                                                                                                                        network option
                                                                   80
                                                                                                                   2: Proposed timing
                                                                   70
                                                                                                                                                   1: Start all projects
                                                                   60                                                                              in 2021

                                                                   50
                                                                        $0              $1            $2           $3           $4                    $5              $6
                                                                                                 Average annual cost per customer 2021-25

                                                                                                                                                                           51
Replacement major projects:
price / reliability trade-offs (long term)
 In the long term, the cost of Option 4 is higher than the preferred
  option, and would result in worse reliability

     Price-Reliability Trade-Off of Repex Portfolio Options (cost versus outage duration) – Long Term

                                                          140
                                                                   6: Defer all projects out of period
                                                          130
          Total expected outage duration 2021-25 (mins)

                                                          120

                                                          110
                                                                         5: 1 yr deferal of all
                                                                         projects
                                                          100

                                                          90
                                                                                   4: Three lowest risk projects
                                                                                   deferred out of period
                                                          80                                                                       3: Three project
                                                                      2: Proposed timing                                           deferals + Non
                                                                                                                                   network option
                                                          70

                                                          60
                                                                               1: Start all projects in 2021

                                                          50
                                                           $100   $120            $140           $160            $180            $200         $220    $240
                                                                                           PV cost over 50 yr asset life per customer

                                                                                                                                                             52
Questions for attendees

 What are stakeholders’ views on the price/reliability trade-off
  framework used to compare and negotiate the repex portfolio options?

 Does the replacement capex forecast overall appear reasonable?

                                                                         53
Safety capex forecast

Safety capex is forecast to be 58% lower over 2021-25, compared to 2016-
20 actual/estimated safety capex

                                                                           54
Questions for attendees

 Does the safety capex forecast appear reasonable?

                                                      55
IT capex forecast

The IT capex forecast is broadly in line with 2016-20 actual/estimated
capex

                                                                         56
Questions for attendees

 Does the IT capex forecast appear reasonable?

                                                  57
Revenues, demand, expenditures
and RAB
Forecast RAB
Forecast real RAB growth per customer

Relatively flat RAB per customer is forecast from 2020

                        RAB per customer - $0's, real $2020
       $6,500
       $6,000
       $5,500
       $5,000
     $ $4,500

       $4,000
       $3,500
       $3,000
       $2,500
       $2,000
                2015   2016     2017     2018     2019    2020   2021   2022     2023    2024     2025
                       2015-17 - Actual excl Mandated Safety     2015-17 Actual - Mandated Safety
                       2018-20 - Expected excl Mandated Safety   2018-20 - Expected Mandated Safety
                       2021-25 - Forecast excl Mandated Safety   2021-25 - Forecast Mandated Safety

                                                                                                         59
Forecast real RAB growth
 RAB growth has been materially impacted by mandated
  bushfire safety programs
 This is forecast to continue in the 2021-25 period

                                     Closing RAB - $m, real $2020
      $5,000

      $4,500

      $4,000

   $M $3,500

      $3,000

      $2,500

      $2,000
                 2015      2016      2017     2018         2019   2020     2021      2022     2023         2024   2025

               2015-17 Actual RAB excl Mandated Safety            2015-17 Actual RAB - Mandated Safety
               2018-20 Expected RAB excl Mandated Safety          2018-20 Expected RAB - Mandated Safety
               2021-25 Forecast RAB excl Mandated Safety          2021-25 Forecast RAB - Mandated Safety
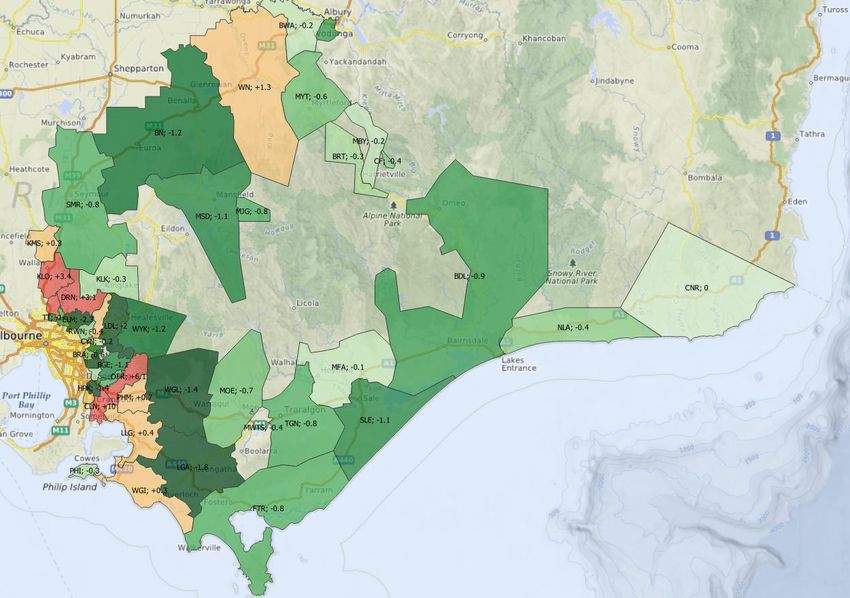
                                                                                                                         60
DER integration
How our proposal is impacted
Solar uptake on our network

Strong growth in solar uptake is expected between 2021 and 2015   62
Impact on Proposal

    Core elements of the DER integration program are:
    1. We propose to use a smart platform to enable maximum export within
       existing network capacity. Reduces the number of solar customers with
       static export constraints.
    2. We are assessing where it will be economically efficient to augment to
       enable export.

       Program                                       Description                                 Forecast expenditure
                                                                                                      ($m 2020)
Distributed Energy   Work to expand and productionise the DENOP platform, which is under trial
Network Optimisation in the current period
Platform (DENOP)
                                                                                                          10

Augmentation to        Augmentation of the shared network to allow additional DER export
increase hosting       capacity where economically efficient.                                             21
capacity

                                                                                                                  63
Who should pay for efficient augmentation
 to support additional DER?

We are exploring various options with the Forum, and will consult on
these in our draft proposal in December:

 1. Status Quo – All customers fund the efficient augmentation costs through network
    charges. This is consistent with the current regulatory framework.

 2. Additional connection charge for new connecting DER customers – only DER
    customers contribute to efficient augmentation costs, via connection fees. This
    could be applied to:
    1. Some new connecting DER customers (i.e. those able to export)
    2. All new connecting DER customers
    This option would require regulatory change to proceed.

                                                                                       64
Questions for attendees

 Does the approach to accommodating DER appear reasonable?

 What are your initial views on the DER connection charge options
  presented?

                                                                     65
Network innovation
Our network innovation proposal
                                                       Network R&D funding per capita 2014, USD (2015
 Our electricity system has changed                   prices and PPP)

  rapidly and continues to transform

 Innovation is necessary to
 › meet changing customer needs and
   expectations
 › support customer control over how they use
   electricity and our network while maintaining
   reliable supply
 › keep costs sustainable in the face of this change
 › leverage technology to provide better services to
   our customers

 Innovation expenditure by Australian
  networks is traditionally very low in
  international terms
                                                         Source: IEA and United Nations database as reported by
                                                         Energy Networks Australia, Network Innovation Discussion
                                                         Paper, July 2017                                         67
Our network innovation proposal

 Constraints on incentives for innovation imposed by our regulatory
  framework
 › Difficulty of meeting expenditure tests - benefits uncertain and hard to quantify
 › 5-year regulatory cycle not suited to projects with multi-period costs and benefits -
   particularly where costs are incurred well before benefits might arise
 › Riskier investments not rewarded - we do not profit in the same way as businesses
   in competitive markets and hence have less incentive

 Preliminary agreement reached with Forum on innovation expenditure
  allowance (separate to demand management innovation)
  › $7.5m over 5 years ($2018), reduced from $10.8m and excluding expenditure on
   EV preparation
 › This innovation spend accounts for 0.3% of opex and 0.5% of capex
 › The proposed focus of the innovation expenditure will be trialling technologies to
   • move from a statically managed centralised network to a dynamically managed
     decentralised network
   • deploy stand alone power systems in remote network areas
                                                                                           68
Questions for attendees

 Are there particular areas where stakeholders would like to see
  innovation expenditure focussed?

                                                                    69
2022-27 Transmission Revenue
Reset: Customer engagement
approach
2022-27 TRR: customer engagement approach

  We are commencing planning for our 2022-27 TRR, including our
   approach to customer research and engagement

  We are therefore seeking feedback on:
   › What customer engagement model is most effective? What has worked
     well in other jurisdictions? e.g. a customer advisory panel
   › When should engagement start?
   › How much engagement should be done with end users vs.
     advocates/customer reps?
   › What research methods are most meaningful and effective?
   › Is publishing a draft proposal helpful?
   › Anything else?

                                                                         71
Thank you for your time today
You can also read