Thermal Evaluation of Toyota Prius Battery Pack
←
→
Page content transcription
If your browser does not render page correctly, please read the page content below
2002-01-1962
Thermal Evaluation of Toyota Prius Battery Pack
Matthew Zolot, Ahmad A. Pesaran and Mark Mihalic
National Renewable Energy Laboratory
ABSTRACT The Toyota Prius is a five-passenger compact sedan
powered by a 52 kW gasoline engine and a 33 kW
As part of a U.S. Department of Energy supported study, electric motor. It has a curb weight of 1254 kg. The Prius
the National Renewable Energy Laboratory has has a complex dual-mode hybrid configuration in which
benchmarked a Toyota Prius hybrid electric vehicle from energy to and from the vehicle wheels can travel along
three aspects: system analysis, auxiliary loads, and several different pathways. Mechanical energy to the
battery pack thermal performance. This paper focuses wheels passes through a planetary gear set that couples
on the testing of the battery back out of the vehicle. More to the engine, electric motor, generator, and to the final
recent in-vehicle dynamometer tests have confirmed drive. Power to the wheels can be provided solely by a
these out-of-vehicle tests. Our purpose was to (273.6 Volt Nickel Metal Hydride [NiMH]) battery pack
understand how the batteries were packaged and through the electric motor, directly from the gasoline
performed from a thermal perspective. The Prius NiMH engine, or from a combination of both the motor and the
battery pack was tested at various temperatures (0°C, engine. The battery pack can be recharged directly by
25°C, and 40°C) and under driving cycles (HWFET, energy from the wheels powering the motor
FTP, and US06). The airflow through the pack was also (regenerative braking) or from excess energy from the
analyzed. Overall, we found that the U.S. Prius battery gasoline engine – which turns the generator [1].
pack thermal management system incorporates
interesting features and performs well under tested The following sections explain how the Prius battery
conditions. pack is constructed, how it is thermally managed, and
how the NiMH batteries perform at different
INTRODUCTION temperatures under controlled laboratory conditions that
simulate various drive cycles. More in-depth analyses
The National Renewable Energy Laboratory (NREL) can be found in the DOE report written by Zolot et al. [2].
performs research and development of hybrid electric
vehicles (HEVs) as part of a program sponsored by the BATTERY PACK DESCRIPTION
U.S. Department of Energy’s (DOE) advanced
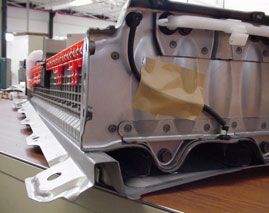
automotive technologies. One purpose of the program is The Module. Toyota uses prismatic NiMH modules from
to benchmark commercial HEVs for potential use by Panasonic. Each module, shown in Fig. 1, consists of six
Partnership for New Generation Vehicles (PNGV) 1.2 V cells connected in series. The module has a
partners. NREL obtained one of the first U.S. marketed nominal voltage of 7.2 V, capacity of 6.5 Ah, weighs 1.04
hybrid vehicles, the 2000 North American version of the kg, and has dimensions of 19.6 mm (W) X 106 mm (H) X
Toyota Prius, for system level vehicle analysis in 275 mm (L). Further notable features are as follows:
ADVISOR vehicle simulations, evaluation of auxiliary
loads such as the air conditioner’s impact on fuel - A thermal well on top of the cell allows measurement
economy, and evaluation of battery thermal of an approximate internal temperature of the
performance. This paper focuses on battery pack electrolyte,
thermal evaluation while it was out of the vehicle, but will - A hydrogen vent provides for release of hydrogen
not present more recent in-vehicle dynamometer results. through a manifold under gassing conditions,
By analyzing the Prius battery pack, one can gain insight - Terminals on each side provide clean connections,
into how to design thermal management systems that - Tie down bolts secure the modules to structural
can enhance battery pack performance for HEVs. supports,
- A plastic case lowers mass, and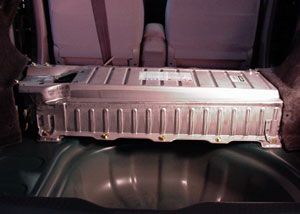
-   The side surfaces of the module provide air gaps for     exhausts (one to the trunk and the other to the outside).
    airflow created by dimples and protrusions when two      A hydrogen vent from each module is connected in
    modules are stacked.                                     series with tubing. Any gases released are exhausted
                                                             from the vehicle through the gas manifold to avoid any
This Panasonic design has improved in specific energy        increased hydrogen concentration and, thus, potential
and power capabilities over the first generation             for explosion.
cylindrical cells that are in the 1999 Japanese Prius and
the 2000 Honda Insight [4].                                  Outside air is conditioned (heated or cooled) by the
                                                             vehicle’s thermal comfort system to a level comfortable
The Pack. The Prius battery stack consists of 38             for the driver. This approach has the advantage of
prismatic NiMH modules connected in series. It delivers      providing air that is not only comfortable to the
a nominal 273.6 Volts and has a 6.5 Ah capacity. The         passenger(s), but also ideal for use in heating or cooling
modules are stacked side by side and then compressed         the NiMH batteries. However, recent in-car
together in a rigid, non-expandable structure that           dynamometer tests show that the Prius does not use the
prevents expansion from internal pressures. The              forced air for heating the batteries. Moreover, the
complete battery pack consists of the battery stack,         concerns with this approach are twofold: relatively slow
enclosure for structural support and airflow, battery        transient time to heat or cool outside air and thus the
electronic control unit/monitor (left end of pack), relays   battery pack; and the ducting between the battery and
and safety switch (also left end of pack enclosure). The     cabin, which in the event of an accident or catastrophic
weight of the complete battery pack is 53.3 kg. The          failure, provides hydrogen and other gases a path to the
pack, shown in Fig. 2, is horizontally positioned in the     cabin.
trunk of the vehicle partially under the back seat. Power
electronics (inverter, DC-DC converter) are under the        To achieve a relatively uniform temperature distribution
hood and a blower for moving air and associated air          across the modules, a parallel airflow scheme is used,
ducts are in the trunk.                                      as suggested by Pesaran et al. [5], rather than a series
                                                             configuration. In a parallel configuration, each module is
We conducted hybrid pulse power characterization             set up to receive the same amount of airflow and thus
(HPPC) tests per the PNGV Battery Test Manual [3] to         the same cooling. To achieve this in the Prius, cabin air
obtain power performance of a module at various states       enters the pack through a plenum that runs beneath the
of charge (SOC) and temperatures (0°C, 25°C, and             battery stack horizontally from passenger side to driver
40° C). The discharge and regenerative power                 side. The cross-sectional area of the plenum is largest at
performance of the pack (extrapolated from module            its entrance and linearly decreases as it goes under the
tests) is shown in Fig. 3. Discharge power capability of     modules. Then the air flows vertically through the gaps
the Prius pack is around 20 kW at 50% SOC with               between each module (formed from dimples and
regenerative capability of 14.5 kW at 25°C. The power        protrusions on side walls). Finally, the air enters into the
capability increases with higher temperatures and            top plenum. This plenum’s cross-section increases
decreases at lower temperatures. Active thermal              linearly in the direction of the flow. With this design, the
management can improve power capability at lower             pressure drop across each module is expected to be
temperatures.                                                uniform and, consequently, should lead to a uniform flow
                                                             rate around each module.
PACK THERMAL MANAGEMENT
                                                             The air is drawn by a 12 V blower installed above the
Generally, the purpose of a battery thermal management       driver’s side rear tire well. The air is either exhausted to
system is to keep the batteries operating at a desirable     the trunk or through a vent on the driver’s side C-pillar.
temperature range; prevent the batteries from exceeding      The fan has four settings, depending on the maximum
a high temperature limit that can damage the batteries       temperature of four monitored batteries. Toyota also
and/or reduce life; and maintain battery temperature         monitors the inlet and outlet air temperatures. The fan
variations to low levels to prevent highly imbalanced        settings are off, low, medium, and high speed. We
batteries. Pack imbalances can reduce performance and        conducted airflow tests with the pack in vehicle, out of
can also damage the battery and/or reduce life. Thermal      vehicle, with flow meter, and without flow meter and
management of the battery pack is typically                  obtained correlations between pressure drop, flow rate,
accomplished with the combination of two approaches.         blower power, and blower settings. The blower setting
First, a cooling/heating system is designed to extract/      depended on temperature, as shown in Fig. 4, and
supply heat to the battery pack. Second, the battery         transitions with hysteresis depending on whether
controller adjusts the vehicle’s use of the battery pack     temperature is increasing or decreasing.
based on the conditions in the batteries.
                                                             Table 1 summarizes the results of the flow tests for
Forced Air System. The Prius supplies conditioned air        Denver elevation (1 mile above sea level, equal to 0.81
from the cabin as thermal management for cooling the         atmosphere). At sea level, the pressure drop across the
batteries. The pack’s forced air system consists of two      pack and the required power will increase compared with
vents located in the cabin under the middle brake light      tests at Denver elevation.
(exhaust from the cabin or inlet to the pack); ducting to
the battery pack enclosure; the enclosure manifold; air
gaps between modules; ducting out of the pack to a
blower that pulls the air through the system; and two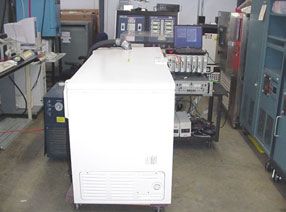
EXPERIMENTAL SETUP                                            about 2 hours to evaluate the thermal management
                                                              system, the pack’s thermal response and the pack’s
Instrumentation. In order to acquire the appropriate          general electrical performance during a long drive.
data from the vehicle components, we instrumented the
Prius and its battery pack with an on-board data              Many tests were conducted at the different temperatures
acquisition unit (DAQ). The DAQ unit takes data while         and over four drive cycles [2]. Three of the drive cycles
driving on the dynamometer, on the road, or during out-       were standard cycles. The following are the drive cycles
of-vehicle pack testing. The data is collected using a        we used for imposing a power profile on the pack:
National Instruments SCXI (Signal Conditioning
eXtended Interface) chassis. It provides a flexible test      1.   Highway Fuel Economy Test (HWFET)
configuration because it is capable of handling               2.   FTP-75 Cycle
numerous signals with a broad range of voltage levels         3.   US06 Cycle based on ADVISOR simulations
ranging from millivolt level thermocouple signals to 300      4.   SUV 25-Minute Cycle
V signals. The SCXI chassis is currently used to
measure 60+ thermocouples located throughout the car          The HWFET and FTP-75 power profile data for the
and the battery pack, 20+ voltages, a handful of current      battery pack were obtained directly from preliminary
shunts, and miscellaneous other signals. Finally, the         testing of the U.S. Prius at Environmental Testing
SCXI multiplexes the signals and feeds them to a              Corporation in Denver, Colorado. The HWFET driving
PCMCIA DAQ card at aggregate rates up to 20 kHz.              cycle is used to simulate highway driving and estimate
                                                              typical highway fuel economy. The FTP-75 is a federal
Vehicle environments, particularly HEVs like the Prius,       test procedure for emissions certification and urban fuel
add substantial EMI (ElectroMagnetic Interference). We        economy determination for light duty vehicles. The US06
took several precautions to eliminate, when possible, or      cycle is based on the federal US06 driving schedule that
otherwise filter out the EMI in the signals. Several of the   simulates high speed and acceleration (aggressive
hardware solutions were specifically chosen for their         driving). We simulated the US06 battery power profile for
ability to eliminate noise and clean up signals. Software     the U.S. Prius based on an ADVISOR vehicle simulation
solutions were also incorporated to reduce noise below        scaled to fit the control and components in the U.S.
acceptable levels.                                            Prius. The SUV 25-minute profile was provided to us by
                                                              one of our clients. This cycle is a sport utility type of duty
The batteries were thoroughly instrumented with               cycle that a battery pack could experience during an
thermocouples. Toyota instrumented four of the thermal        aggressive 25-minute drive.
wells, but we instrumented all 38 thermal wells in order
to see the thermal gradient across the entire pack            TEST RESULTS
length. Also, to look at the thermal gradient across a
single module, three of the module faces were                 This section describes the temperature response during
instrumented. The voltage measurements we make are            the 12 consecutive ADVISOR US06 drive cycles (2 hour
piggybacked off the same connections that Toyota has          test duration). Focus is on the US06 results because this
in place for battery monitoring. The voltage is measured      cycle stresses the pack more (and possibly more
across every two modules. A voltage measurement               realistically) than the less aggressive highway and FTP
across a shunt (a resistor) is used to calculate current      cycles. Because of space limitations, only selected test
though the pack.                                              data will be discussed here.

For initial tests, the pack was removed from the vehicle      US06 Testing at 25°°C. At 25°C the battery pack
and was placed in an environmental chamber with               temperatures reach a quasi-thermal steady state during
controlled temperature while undergoing different             the 12 consecutive US06 cycles seen in Fig. 6. At 25°C,
charge/discharge drive cycles. Fig. 5 shows the               the maximum temperature distribution across the
chamber, the ABC-150 battery pack cycler in the               modules was moderately high at 5.0°C. The maximum
background and the DAQ unit on the right. The battery         temperatures seen by the battery are 43.0°C, and the
pack with ducting and the heat exchanger are also             mean battery temperature reached a maximum of
shown in the environmental chamber in this figure.            41.2°C. Toward the end of the third cycle the blower
Tests Performed. The objective of these tests was to          came on at low speed (at about 28 minutes). The battery
evaluate the thermal performance of the pack at three         temperatures went into steady state cycling about 30
temperatures (0°C, 25°C, and 40°C) and during different       minutes after the blower turned on. Since the thermal
drive cycles/power profiles. The forced-air system was        management system is able to level off the temperatures
characterized as part of the testing as described in the      rise, the maximum temperatures and maximum
previous section. The pack was cycled (charged/               temperature differentials are both attained by one hour
discharged) to determine capacity (Ah) at each                into the test. The blower load (4.66W) resulted in a 7.1
temperature. After cycling, the capacity data were used       Wh energy drain during this drive. Ultimately, during a
to bring the pack to 50% SOC before the drive cycles          mild day with relatively aggressive driving (maximum
were run. This start point, determined from discussions       speed of 80.3 mph) that lasts as long as 2 hours, the
with Toyota engineers, is based on the principle that the     U.S. Prius pack performs quite well.
vehicle controls the pack to a set point of approximately
50% SOC when running the vehicle at typical loads, like       US06 Testing at 0°°C. The testing at 0°C indicates that
those seen during the federal test procedure prep-cycles      the maximum temperature distribution across the
on a dynamometer. Cycles were run consecutively for           modules increases more readily from the lack of airflow.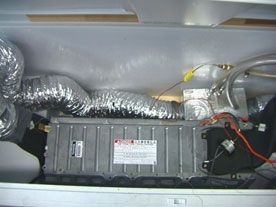
The maximum temperature differential across the pack is          aggressive cycle with significant heat generation that the
11.4°C as seen in Fig. 7. The maximum temperatures               Prius’ thermal management system was unable to
the battery attained were 39.1°C, and the mean battery           sustain after the first cycle. Calorimeter tests indicate
temperatures attained were a maximum of 37.2°C. The              that the heat generation over the first cycle (25 minutes)
blower was used only for cooling at about 80 minutes             is about 27.84 W/module, nearly three times the heat
into the test. The temperature differentials seen during         generation from the ADVISOR US06 cycle. The blower
this and the other cycles bring the thermal performance          used all four fan-speeds during this test. The
at low temperatures into question, but the cabin                 temperature distribution steadily rose and ended the test
temperature warm-up was not simulated. However, our              with a distribution of about 6.8°C. It is anticipated that
recent dynamometer tests showed that the battery fan             with the battery pack in the vehicle, the battery controller
does not turn on as the cabin warms up even if the               will adjust the power use when a certain battery
battery pack is at –25°C. Since the Prius does not               temperature is achieved. For example, the controller
operate the fan at colder temperatures, high temperature         may start to scale down the power the battery
differentials were seen during in-car dynamometer                supplies/accepts when a battery temperature reaches
testing also. In recent dynamometer testing, tests more          45°C. However, we did not try to simulate this behavior
accurately represented cabin heating also.                       in the laboratory while conducting these tests.

US06 Tests. During the consecutive 40°C US06 cycles              CONCLUSION
in Fig. 8 the battery pack seems to go into quasi-thermal
steady state. The maximum temperature distribution               The NiMH Prius battery pack was tested at various
across the modules was moderately high with a                    temperatures (0°C, 25°C, and 40°C) and under driving
maximum of 4.75°C. The maximum temperature the                   cycles (HWFET, FTP, US06, and SUV 25-minute). The
batteries attain is 51.5°C; the mean temperatures reach          following are selected sets of observations and
a maximum of 49.4°C. The blower switched from low to             conclusions from this research:
medium speed after 3.6 minutes. About 1.5 hours into
the test, the battery temperatures went into steady state        •   Panasonic has incorporated several interesting
cycling. Overall, blowing 40°C air for removing heat from            features in the NiMH module from a thermal
                                                                     standpoint such as a thermal well on top of the
the system proved effective during consecutive US06
                                                                     module for measuring the internal temperature of the
cycles because the battery pack was able to maintain
                                                                     module; a hydrogen vent for release of hydrogen
power demands, and the blower was able to limit
                                                                     through a manifold under gassing conditions; and
maximum temperatures. Yet, the airflow system was not
                                                                     use of dimples and protrusions on the module face
able to keep the temperature below 50°C. However, the
                                                                     to create gaps for flowing air to facilitate thermal
high inlet air temperature (40°C) is an extreme for a                management.
steady state cabin temperature, so if the vehicle were           •   According to PNGV HPPC test procedure, discharge
under the same duty cycle with cabin air at comfortable              power capability of the Prius pack is around 20 kW
conditions, we would expect lower steady state battery               at 50% SOC with regen capability of 14.5 kW at
temperatures. Hence, the thermal management system                   25°C. The power capability increases with higher
would perform better under cooler cabin conditions that              temperature and decreases at lower temperature.
would realistically occur.                                       •   The Prius battery pack’s thermal performance at
                                                                     25° C is very good for all the cycles. The
A top-down view of the battery modules is illustrated in
Fig. 9. This plot shows the temperature distribution                 temperatures are maintained below 45°C over the 2-
across the modules at the very end of the 40°C                       hour test durations for all the standard drive cycles.
ADVISOR US06 trials. The modules at both ends are                    Temperature differentials are also managed quite
relatively cooler than the middle ones. This trend is seen           well at or below 5.0°C. The battery hit the maximum
throughout testing, even at room temperature and with                temperature limit of 55° C only for the very
no fan operation. This occurs because the end modules                aggressive SUV 25-minute cycle.
are receiving only half the heating the inner modules            •   At 40°C, the Prius pack also performed reasonably
receive (they are the only modules with only one                     well. Under elevated temperature tests, the pack is
neighboring module). The ends of the pack are also                   able to keep temperatures maintained at levels
closed off with the aluminum end plates, so the thermally            below 52°C. Temperature differentials across the
conductive metal end plates will also help to remove                 pack are very good with maximums below 5°C for all
more heat from these end modules. Additionally, this                 tests.
figure illustrates that the temperature is decreasing            •   At 0°C, temperature differentials that develop across
slightly (4°C) in the flow direction. This is an indication of       the battery pack (>11°C at times) as it warms up are
an uneven airflow distribution across the pack.                      not desirable. Also, active thermal management
                                                                     tests resulted in average battery temperatures rising
SUV 25-Minute Test. The SUV 25-minute cycle was                      more quickly. Thus, active battery thermal
performed at 25°C only about 1.7 times for a total drive             management could help at cold temperatures
time of 42.6 minutes. The cycle could not be repeated            •   The temperature distribution across the U.S. Prius
for 2 hours like other cycles because at 42.6 minutes the            pack could be improved significantly if insulation
pack temperature hit the high temperature limit of 55°C.             were added to the two end modules on their outside
The DAQ protected the pack by cutting the power from                 faces rather than the metal structural plates that act
the cycler. The SUV 25-minute cycle, in Fig. 10, is a very           as heat sinks.
Overall, we found that the U.S. Prius battery pack Honda Insight for Various Chassis Dynamometer
thermal management system incorporates interesting Test Procedures,“ Proceeding of the 17th Annual
features and performs well under tested conditions. Battery Conference on Applications and Advances,
More recent work includes dynamometer testing and on- Long Beach, CA, January 2002.
the-road testing to evaluate how real world conditions, 2. Zolot, M., Keyser, M., Mihalic, M., and Pesaran, A.
like cabin cool-down and temperature adjusted electric A., “Thermal Evaluation of a Toyota Prius HEV
power requests, effect the battery thermal performance. Battery Pack - Out of Vehicle Testing,” National
Preliminary analyses of dynamometer tests have shown Renewable Energy Laboratory Report, NREL/MP-
very good agreement with the 2-hour simulated 540-30376, Golden, CO, May 2001.
laboratory cycles. 3. PNGV Battery Test Manual, Revision 3, Idaho
National Engineering and Environmental Laboratory,
ACKNOWLEDGMENTS DOE/ID-10597, Idaho Falls, ID, February 2001.
4. Panasonic EV Energy Co., Ltd.; Yamaguchi, S.,
This work was funded by DOE’s Office of Advanced Taniguchi, A., Fujioka, N., Kanamaru, K., and Ikoma,
Transportation Technologies and performed by NREL’s M. “Development of Prismatic Nickel / Metal-Hydride
Battery Thermal Management team. We wish to thank Battery for HEV,” Advanced Automotive Battery
Robert Kost (DOE team leader, Systems Vehicles Conference, Las Vegas, NV, February 2001.
Team) and Terry Penney (NREL technology manager, 5. Pesaran, A.A., Vlahinos, A., and Burch, S.D.,
Vehicle Systems Program) for their continued support. "Thermal Performance of EV and HEV Battery
Modules and Packs," Proceedings of the 14th
REFERENCES International Electric Vehicle Symposium, Orlando,
FL, December 15–17, 1997.
1. Kelly, K., Zolot, M., and Mihalic, M., “Battery Usage
and Thermal Performance of the Toyota Prius and
Table 1: Pack Air Flow Characteristics (Ambient pressure = 0.81 atmosphere)
Blower Temp. Temp. Motor Motor Motor Air Flow Pressure Drop
Setting ON (C) OFF (C) Voltage Current Power Rate across Pack
(Volts) (Amps) (Watts) (SCFM) (in H20)
Off - - 0.00 0.0000 0.00 0.00 0.000
Low 35.5 33.0 3.52 1.3250 4.66 15.90 0.095
Medium 41.5 40.0 6.50 2.7000 17.55 32.60 0.350
High 50 48.0 9.90 4.9875 49.38 48.40 0.770Thermal Well Hydrogen Vent
Figure 1: Panasonic Prismatic NiMH Module in the U.S. Toyota Prius
Inlet Air
Temperature
Thermistor
Inlet Air Plenum
Decreasing
Rail Height
Figure 2: Prius Battery Pack
35 35
Pulse Power Limit
30 30
25 25
Power (kW)
20 20
15 15
10 10
5 5
0 0
0.0 0.2 0.4 0.6 0.8 1.0 1.2 1.4 1.6 1.8
Net Energy Removed (kWh)
18s Discharge Power Capability at 0C 18s Discharge Power Capabilty at 25C 18s Discharge Power Capabilty at 40C
2s Regen Power Capability at 0C 2s Regen Power Capability at 25C 2s Regen Power Capability at 40C
Figure 3: U.S. Prius Panasonic 6.5 Ah Pack Power from PNGV HPPC Tests
(Extrapolated from module level tests)50
40
Fan Power (W) 30
20
10
0
25 30 35 40 45 50 55
Battery Temperature (C)
Figure 4: Battery Pack Blower Power vs. Detected Battery Temperature at Denver Elevation
(0.81 atmosphere)
Battery
Cycler
Environmental
Chamber
Data Acquisition
Equipment
Figure 5: Experimental Set Up for Testing Prius Battery Pack
45 40
40 30
35
20
30
10
Temperature (C)
Power (kW)
25
0
20
-10
15
-20
10
5 -30
0 -40
0 20 40 60 80 100 120 140
time (min)
TairIN TairOUT T_max T_min T_avg T_delta Pack Power
Figure 6: Thermal Response of U.S. Prius Pack to US06 Cycles at 25°°C40 50
35
30 40
25
20 30
15
10 20
Temperature (C)
Power (kW)
5
0 10
-5 0 10 20 30 40 50 60 70 80 90 100 110 120
-10 0
-15
-20 -10
-25
-30 -20
-35
-40 -30
time (min)
TairIN TairOUT T_max T_min T_avg T_delta Pack Power
Figure 7: Thermal Response of U.S. Prius Pack to US06 Cycles at 0°°C
55 80
50 70
45 60
40 50
Medium
35 Medium to High 40
Temperature (C)
Low to to High High to High to
Power (kW)
30 Medium
Medium Medium 30
25 20
20 10
15 0
10 -10
5 -20
0 -30
0 10 20 30 40 50 60 70 80 90 100 110 120
time (min)
TairIN TairOUT T_max T_min T_avg T_delta Pack Power
Figure 8: Thermal Response of U.S. Prius Pack to US06 Cycles at 40°°CFigure 9: Temperature Distribution in Battery Pack after 12th US06 Cycle at 40°°C
60 30
50 20
40 10
30 0
Temperature (C)
Power (kW)
20 -10
10 -20
0 -30
0 5 10 15 20 25 30 35 40 45 50
-10 -40
-20 -50
time (min)
TairIN TairOUT T_max T_min T_avg T_delta Pack Power
Figure 10: Thermal Response of U.S. Prius Pack to SUV 25-Minute Cycles at 25°°CYou can also read