Effects of Climatological Parameters on the Outbreak Spread of COVID-19 in Highly Affected Regions of Spain
←
→
Page content transcription
If your browser does not render page correctly, please read the page content below
Effects of Climatological Parameters on the
Outbreak Spread of COVID-19 in Highly Affected
Regions of Spain
Khurram Shahzad
College of Life Sciences, Northwest University, Xi’an P. R China
Umer Shahzad ( Shehzad-umer@hotmail.com )
Shandong University https://orcid.org/0000-0002-7010-4054
Najaf Iqbal
Hunan University of Arts and Science, Changde, China
Farrukh Shahzad
Guangdong University of Petrochemical Technology, Guangdong, China
Zeeshan Fareed
School of Business, Huzhou University,
Short Report
Keywords: COVID-19; Temperature; Air quality; Spain; Spearman Correlation
DOI: https://doi.org/10.21203/rs.3.rs-30377/v1
License: This work is licensed under a Creative Commons Attribution 4.0 International License.
Read Full License
Page 1/14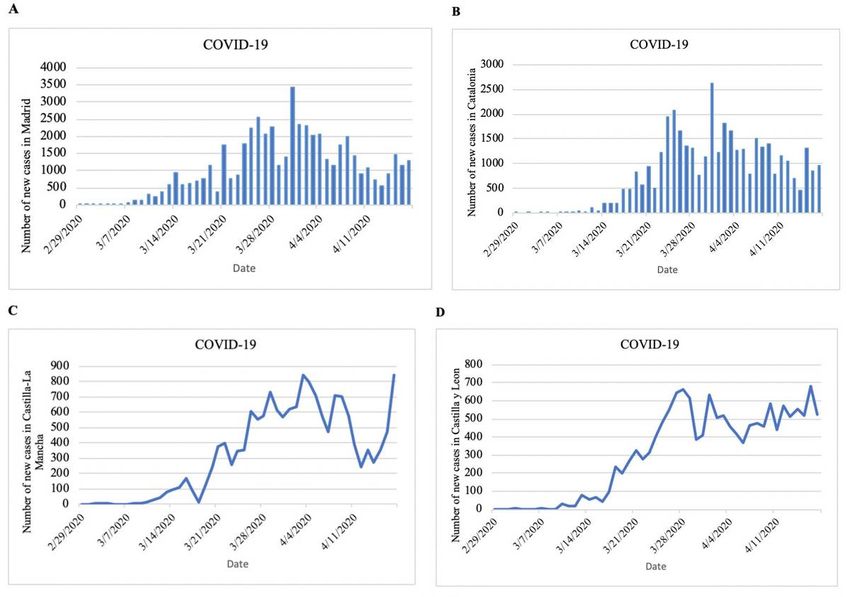
Abstract
The Coronavirus (COVID-19) pandemic is infecting the human population, killing people, and destroying
livelihoods. This research sought to explore the associations of daily average temperature (AT) and air
quality (PM 2.5) with the daily new cases of COVID-19 in the top four regions of Spain (Castilla y Leon,
Castilla-La Mancha, Catalonia, and Madrid). We apply Pearson correlation, Spearman correlation,
Kendall’s rank correlation, and panel regressions to quantify the overall co-movement between
temperature, air quality, and daily cases of COVID-19 from February to 17th April 2020. Overall empirical
results show that temperature and air quality exert pressure to increase new COVID-19 infections. Our
 ndings are contrary to the earlier studies, which show a signi cant impact of temperature in reducing the
COVID-19 spread. The conclusions of this work can serve as an input to mitigate the rapid spread of
COVID-19 in Spain and reform policies accordingly.

1. Introduction
A novel coronavirus disease (COVID-19) epidemic was rst reported in Wuhan (China), in December 2019,
which spread quickly around China and the government called it a new type of COVID-19 caused by
severe acute respiratory syndrome coronavirus 2 (SARS-CoV-2) (Anderson et al., 2020; Wu et al., 2020; Li
et al., 2020). The coronavirus is being transmitted through human-to-human by touching, coughing, and
sneezing etc with rapid speed (Wang et al., 2020a). The COVID-19 spread throughout the world from
Wuhan city in just few weeks, raising a global attention and being highlighted as pandemic (Chen et al.,
2020; Lu et al., 2020; Phan et al., 2020; Xu et al., 2020). Common signs and symptoms of covid-19
reported as fever, cough, having di culty during breathing, and lung pneumonia detected by X-rays
(Holshue et al., 2020; Gorbalenya, 2020; Perlman, 2020). According to the exports, the average incubation
might be 5 to 6 days, with the maximum prolonged incubation period of 14 days. According to the reports
of World Health Organization (WHO), there are more than 2 million people infected, with 1,39,000 plus
fatlities until 17th April 2020 (WHO, 2020).

According to the existing research, the viruses can be transmitteded through several ways including the
weather and climate conditions (temperature, rain, air quality, pollutant emissions and humidity etc.), and
populated areas. (Wang et al., 2020b). Hence, for a better understanding about the nexus between
climatology factors and transmission of COVID-19 is critical factor to combat against the spread of
COVID-19 in several countries. While the health experts are expected that the cold and humid regions will
fasten the COVID-19 outbreak, but it is yet not clear whether the warmer areas will respond to the control
of the epidemic in the world. The recent studies have mentioned that among climatology indicators the
temperature and humidity are highly associated with the COVID-19 pandemic (Tosepu et al. 2020; Wang
et al., 2020b). Acccording to the ndings of Massachusetts Institute of Technology (MIT), the COVID-19
outbreak frequently accrues in areas with low annual average temperatures, around 37to 63ºF (~3-17℃).
The research conducted at MIT[1], indicated that countries having an average temperature above about

                                                 Page 2/14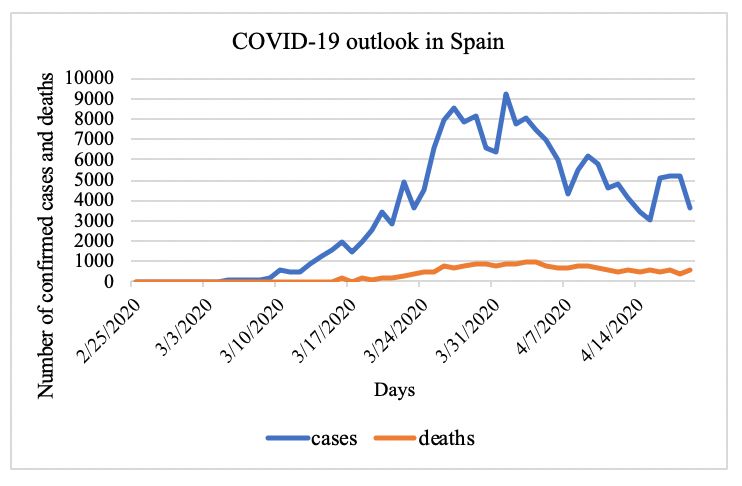
64ºF (~18℃) might have less than 6 percent COVID-19 cases. However, COVID-19 presents similar
patterns in terms of spread rate as compared to the global spread of the Spanish Flu pandemic in 1919,
(which affected hundreds of millions of people) and an outbreak of 2002-2003, severe Acute Respiratory
Syndrome (SARS) (3.5% for COVID-19 and 11% for SARS).

Tan, (2005) documented that temperature variation in signi cantly in udnce the SARS outbreak. Recently,
studies of several researchers have mentioned that there exists a strong association between average
daily temperature, humidity, and COVID-19 outbreak in China. The studies documented that warm and
humid regions of China has lower spread of COVID-19 as compared to Wuhan (Wang et al., 2020b).
Moreover, other researchers from Spain and Finland, found that 95% of infections globally have so far
occurred at temperatures between 28to 50ºF (~2-10℃), and in dry climates (Araujo and Naimi, 2020). A
study on in uenza disease resulted that low temperature and relative humidity increases the chances of
disease outbreak in Korea, a signi cant positive association was observed for diurnal temperature range
(DTR) (Park et al., 2019). In the same line, the recent studies have reported that COVID-19 outbreak is
highly correlated with meteorological and weather factors e.g. rain, humidity, heat etc., (Oliveiros et al.,
2020; Wang et al., 2020b). In a general sense, the climatology factors can also be a direct cause of
biological interactions between COVID-19 into humans., because the similar factors (temperature
variation, air quality, and humidity) were found to be associated with the SARS virus (Yuan et al., 2006).
Therefore, we assume that the climate change and weather conditions might also contribute to the
spread of COVID-19.

Spain is located in southwestern Europe, with the capital city of Madrid, situated in the middle of Spain.
The rst case of COVID-19 in Spain was recorded on 31st January 2020, and it is the second country with
the highest COVID-19 cases (190,839) as of 17th April 2020 (Spain Government Department of Health,
2020).Figure 1 illustratesthe overall COVID-19 outlook in Spain, mentioning that the country witnessed
9222 cases and 849 deaths in a single day (1st April 2020). The four most top regions of COVID-19 cases
are Madrid (51,993), Catalonia (38,316), Castilla-La Mancha (15,997), and Castilla y Leon contained
(14,903), respectively, until 17th April 2020 (Figure 2).

The increase in the number of cases took place quite quickly due to its temperature and air
quality.Previously, it was suggested that viruses could be transmitted by several factors, including
climatic conditions (such as temperature, air quality, and humidity) and population density (Dalziel et al.,
2018). The extreme weather conditions that accompany long-term climate variations may also contribute
to the spread of the West Nile virus in the United States and Europe (Epstein, 2001). The average
temperature of Spain is around 57ºF (∼14℃) year-round (Figure 3 shows the different regions of Spain).
Previous study results showed that the solar ux of ionizing radiation creates nono-metrical viruses, e.g.,
SARS and MERS, by long term variation of solar ux (Qu and Wickramasinghe, 2017). However, COVID-19
or infectious diseases can be inactivated by high solar radiation and prevents an outbreak (Gupta et al.,
2015; Qu and Wickramasinghe, 2017). The results of Qu and Wickramasinghe(2017) suggested that a
double peak in the sunspot cycle causes pandemics in colder areas like Spain and other European
countries. Recent studies on COVID-19 situation in China and Iran suggested that the temperature
                                                   Page 3/14
uctuation and humidity are important variables in determining the COVID-19 outbreak and mortality rate
(Yueling et al., 2020; Mohsen et al., 2020). Research on climate change and COVID-19 is still limited, and
this research will contribute to an effort to prevent COVID-19 disease.
To the best of author’s knowledge, this is probably the rst work to explore the association between
climatology parameters with COVID-19 for the case of Spain. In this study, we analyzed how the COVID-
19 outbreak correlates with climatology parameters (temperature and air quality). The temperature and
air quality data are based on information between 29th February to 17th April 2020, in Spain, the duration
of fast and peak outbreak of COVID-19 pandemic. However, the parameters were subjected from four
highly affected regions of Spain (Madrid, Catalonia, Castilla-La Mancha, and Castilla y Leon), which can
result in infection prevalence and are more in the exposure to COVID-19 identi ed. The prime objective of
this work is to explore the association between Corona Virus Disease 2019 (COVID-19) outbreak and
weather parameters in top four affected regions of Spain.
[1] This is reported by Massachusetts Institute of Technology on 19th March. The research evolves on
COVID-19 with new information day be day.
2. Data And Methods
2.1 Study area and Data Speci cation
In this study, we collected daily data of the top four regions of Spain in COVID-19 infections. These
regions include Castilla y Leon, Castilla-La Mancha, Catalonia, and Madrid, while the time of data ranges
from February to 17th April 2020. According to World Bank records, Spain has a population of almost 47
million, with a population growth rate of 0.3% per year. The main reason behind selecting Spain is due to
the fact that Spain is currently at world 2nd most infected country[2] in the world with 196, 586 con rmed
cases, 77,000 plus recoveries, and 20,639 total deaths. The meteorological data, including daily average
temperature (AT) and daily PM 2.5 (a proxy of air quality) of each region, were retrieved from World Air
Quality organization (https://aqicn.org). However, the data for daily COVID new cases is accessed from
the EL PAÍS: the global newspaper[3] of Spain. The daily data consists of COVID-19 new con rmed
cases, the average temperature in degree Celsius (°C), and real-time air quality as PM 2.5.
Figure 2(a,b, c and d) shows the COVID daily news cases in Madrid, Catalonia, Castilla-La Mancha, and
Castilla y Leon, respectively. From Figure 2 (a and b), we observe that Madrid and Catalonia are the most
affected regions of Spain, followed by Castilla-La Mancha and Castilla y Leon. Similarly, from Figure 3 (a,
b, c and d), we note that the highest uctuation of daily temperature is recorded in Catalonia, Castilla-La
Mancha, and Madrid.Because of normality issues, all three variables are transformed into a natural
logarithm. Table 1 shows the descriptive statistics of variables with and without log transformation. The
summary statistics display that data is average, and there are no outliers in the panel data.
Page 4/142.2 Estimation Strategy
For empirical analysis, we use the step by step approach. For instance, rst, we checked the normality by
descriptive analysis. In the 2nd step, we perform a detailed correlation analysis to check the co-movement
between temperature, air quality, and COVID-19 news cases of Spain. Following the recent study
byTosepu et al. (2020), we apply the Spearman correlation technique. We further use the Pearson
correlation and Kendall’s rank correlation methods to examine the robustness of our correlation
ndings.After performing the correlation analysis between our primary variables of interest, we utilize the
panel regression to check if temperature and air quality exert pressure on COVID incidents of Spain. In
doing so, we use panel regression, quantile regression, Pooled OLS (robust Driscoll and Kraay standard
errors), and xed effects methods. The panel regression methods are employed on our baseline model
given as;
In equation (ii), the variables are used with log transformation. Where Tempi,t mentions the impact of
daily average temperature Airi,t illustrates the effect of air quality and εi,t shows the error term.
[2] The gures are provided as of 20th April 2020. Spain is recording daily new cases of 2000 average.
[3] https://elpais.com/ reports all kinds of health and other indicators data in Spain.
3. Empirical Results And Discussion
3.1 Main Findings
Table 2 presents the coe cients of pearson correlation for all possible pairs of our variables of interest.
Correlation between all three variables is positive and signi cant, but weak. Values of coe cients are
0.192 (PM2.5 and temperature), 0.234 (COVID-19 and PM2.5) and 0.21 (temperature and COVID-19)
respectively, implying that all variables tend to vary in the same direction together.
Table 3 presents results from spearman's rank correlation among all pairs of variables. Except the
coe cient of PM2.5 with temperature, the other two values are not only positive and signi cant, but also
similar to those obtained from pearson correlation analysis. It's 0.18 for COVID-19 and PM2.5 while 0.19
for COVID-19 and temperature.
Table 4 presents yet another correlation analysis i.e., Kendall’s rank correlation. Resulting coe cients are
similar to those obtained from Spearman's rank correlation coe cients. Both of these approaches use
ranked data in order to determine the strength and direction of the association. PM2.5 and temperature
Page 5/14exhibit insigni cant relationship while other two pairs show signi cant positive relationship. Kendal's
coe cient is advantageous as compared to others when sample size is small. Similar results from all
three approaches con rm the positive relationship between temperature, PM2.5 and COVID-19.
Table 5 below presents the results from competing regression models. We have employed four regression
models for analysis: panel regression, quantile regression, pooled OLS and xed effects regression
model. Coe cients of air quality (PM2.5) are positive and close in values for all models except the xed
effects model. Each one percent increae in PM2.5 results in an increase of 0.63%, 0.67% and 0.64%
increase in COVID-19 cases, according to panel regression, quantile regression and pooled OLS
respectively.
Coe cients of the temperatue are positive and signi cant in case of all competing models, suggesting a
decisive role of temperature in COVID-19 infections. Showing similar pattern as of PM2.5, panel
regression, quantile regression and pooled OLS provide similar coe cients for temperature, close in
value, whereas xed effects model presents a bit different story. Each one percent increase in average
temperature is associated with an increase of 1.79%, 1.68% and 1.80% rise in number of COVID-19 cases
on average, according to panel regression, quantile regression and pooled OLS results. In case of xed
effects model, each one percent increase in temperature results in 2.95% increase in COVID-19 infections.
3.2 Discussion of ndings
Our results are consistent with the recent studies suggesting that bad air quality leads to an increase in
the number of new COVID-19 infections (Park et al., 2019). Temperatue is associated with the daily new
COVID-19 infections but sadly, in way that is not helpful to slow down the spread of this disease, quite
opposite to the expectations of many experts and some earler studies (Tosepu et al. 2020; Wang et al.,
2020b). A rise in temperature leads to an increase in the new COVID-19 infections on average, as
indicated by the results of our correlation and regression analysis. Similar values obtained from multiple
models add to the robustness of our results.
These ndings may be limited in application to a European country (Spain) due to its unique climate,
social setup and a number of other factors related to healthcare facilities. Nevertheless, the result provide
a valuable perspective in climate-infectious-diseases-control studies. Since the outbreak of COVID-19 is
still out of appropriate control in Spain at the moment, the data related to new infections and climate
factors is in the process of formation. Additional studies at the end of this outbreak will be more helpful
to understand the role played by the climate factors in COVID-19 spread or control.
4. Concluding Remarks
This is probably the rst article to investigate the correlations between average temperature, air quality,
and COVID-19 in Spain population. The study utilizes correlation and panel regression methods to
investigate the association between temperature, air quality, and COVID-19 across four regions of Spain
with high infections. The empirics conclude that weather might be a signi cant factor in determining the
Page 6/14incidence rate of COVID-19 in Spain. The empirical ndings nd that average temperature and air quality
signi cantly raise the COVID new cases in all regions of Spain. The results of this work can assist the
policymakers in suppressing COVID-19 disease in Spain for humanity saving efforts.
Abbreviations
COVID-19: Corona Virus Disease 2019; AT:Daily average temperature; PM 2.5:Air quality indicator
Declarations
Declaration of Interest
The authors declare that they have no known competing for nancial interests or personal relationships
that could have appeared to in uence the work reported in this paper. No funding was received for this
research work.The datasets used during the current study are available from the website and are
available on request.
References
Anderson, R.M., Heesterbeek, H., Klinkenberg, D., Hollingsworth, T.D., 2020. How will country-based
mitigation measures in uence the course of the COVID-19 epidemic? Lancet 395, 931–934.
Araujo, M.B., Naimi, B., 2020. Spread of SARS-CoV-2 Coronavirus likely to be constrained by climate.
medRxiv.
Chen B, Liang H, Yuan X, Hu Y, Xu M, Zhao Y, et al. Roles of meteorological conditions in COVID-19
transmission on a worldwide scale. medRxiv 2020.
Dalziel, B.D., Kissler, S., Gog, J.R., Viboud, C., Bjørnstad, O.N., Metcalf, C.J.E., et al., 2018. Urbanization and
humidity shape the intensity of in uenza epidemics in U.S. cities. Science 362, 75–79.
Epstein, P.R., 2001. West Nile virus and the climate. J. Urban Health 78, 367–371.
Gorbalenya, A.E., 2020. Severe acute respiratory syndrome-related coronavirus–The species and its
viruses, a statement of the Coronavirus Study Group. BioRxiv, 1-15.
https://doi.org/10.1101/2020.02.07.937862.
Gupta, R., Gil-Alana, L.A., Yaya, O.S., 2015. Do sunspot numbers cause global temperatures? Evidence
from a frequency domain causality test. Appl. Econ. 47, 798–808.
Holshue, M., DeBolt, C., Lindquist, S., Lofy, K., Wiesman, J., Bruce, H., Spitters, C., Ericson, K., Wilkerson, S.,
Tural, A., Diaz, G., Cohn, A., Fox, L., Patel, A., Gerber, S., Kim, L., Tong, S., Lu, X., Lindstrom, S., Pallansch,
Page 7/14M., Weldon, W., Biggs, H., Uyeki, T., Pillai, S., 2020. First case of 2019 novel coronavirus in the United
States. N. Engl. J. Med. 382, 929–936.
Li, Q., Guan, X.,Wu, P., Wang, X., Zhou, L., Tong, Y., et al., 2020. Early transmission dynamics in Wuhan,
China, of novel coronavirus–infected pneumonia. N. Engl. J. Med.
Lu, R., Zhao, X., Li, J., Niu, P., Yang, B., Wu, H., Wang, W., Song, H., Huang, B., Zhu, N., others, 2020.
Genomic characterisation and epidemiology of 2019 novel coronavirus: implications for virus origins and
receptor binding. Lancet 395, 565–574.
Mohsen Ahmadi, Abbas Shari , Shadi Dorosti, Saeid Jafarzadeh Ghoushchi, Negar Ghanbari
Investigation of effective climatology parameters on COVID-19 outbreak in Iran, Science of the Total
Environment (2020), https://doi.org/10.1016/j.scitotenv.2020.138705
Oliveiros, B., Caramelo, L., Ferreira, N.C., Caramelo, F., 2020. Role of temperature and humidity in the
modulation of the doubling time of COVID-19 cases. medRxiv.
https://doi.org/10.1101/2020.03.05.20031872
Park, J.E., Son, W.S., Ryu, Y., Choi, S.B., Kwon, O., Ahn, I., 2019. Effects of temperature, humidity, and
diurnal temperature range on in uenza incidence in a temperate region. In uenza Other Resp, 14(1), 11-
18. https://doi.org/10.1111/irv.12682.
Perlman, S., 2020. Another decade, another coronavirus. Mass Medical Soc.
Phan, L.T., Nguyen, Thuong V, Luong, Q.C., Nguyen, Thinh V, Nguyen, H.T., Le, H.Q., Nguyen, T.T., Cao, T.M.,
Pham, Q.D., 2020. Importation and human-to-human transmission of a novel coronavirus in Vietnam. N.
Engl. J. Med. 382, 872–874.
Qu, J., Wickramasinghe, C., 2017. SARS, MERS and the sunspot cycle. Curr. Sci. 113, 1501.
Tan, J., 2005. An initial investigation of the association between the SARS outbreak and weather: with the
view of the environmental temperature and its variation. Journal of Epidemiology & Community Health,
59(3), 186-192. https://doi.org/10.1136/jech.2004.020180.
Tosepu, R., Gunawan, J., Savitri, D., Ode, L., Imran, A., Lestari, H., Bahar, H., As, P., 2020. Science of the
Total Environment Correlation between weather and Covid-19 pandemic in Jakarta , Indonesia 725.
https://doi.org/10.1016/j.scitotenv.2020.138436
Wang, C., Horby, P.W., Hayden, F.G., Gao, G.F., 2020a. A novel coronavirus outbreak of global health
concern. The Lancet, 395(10223), 470-473. https://doi.org/10.1016/S0140-6736(20)30185-9.
Wang J, Tang K, Feng K, Lv W., 2020b. High temperature and high humidity reduce the transmission of
COVID-19. Available at SSRN 3551767 2020b.
Page 8/14WHO,2020. Coronavirus disease 2019 (COVID-19) Situation Report;88.
Wu, F., Zhao, S., Yu, B., Chen, Y., Wang, W., Song, Z., Hu, Y., Tao, Z., Tian, J., Pei, Y., Yuan, M., Zhang, Y., Dai,
F., Liu, Y., Wang, Q., Zheng, J., Xu, L., Holmes, E.C., Zhang, Y., 2020. A new coronavirus associated with
human respiratory disease in China. Nature, 579(7798), 265-269. https://doi.org/10.1038/s41586-020-
2008-3.
Xu, Z., Shi, L., Wang, Y., Zhang, J., Huang, L., Zhang, C., Liu, S., Zhao, P., Liu, H., Zhu, L., others, 2020.
Pathological ndings of COVID-19 associated with acute respiratory distress syndrome. Lancet Respir.
Med.
Yuan, J., Yun,H., Lan, W.,Wang, W., Sullivan, S.G., Jia, S., et al., 2006. A climatologic investigation of the
SARS-CoV outbreak in Beijing, China. Am. J. Infect. Control 34, 234–236.
Yueling Ma, Yadong Zhao, Jiangtao Liu, Xiaotao He, Bo Wang, Shihua Fu, Jun Yan, Jingping Niu, Ji Zhou,
Bin Luo. Effects of temperature variation and humidity on the death of COVID-19 in Wuhan, China,
Science of the Total Environment (2018), https://doi.org/10.1016/j.scitotenv.2020.138226
Tables
Table 1: Descriptive Statistics
Variables Obs Mean S.Dev Min Max p1 p99 Skew. Kurt.
Covid-19 196 618.41 648.04 0 3419 0 2616 1.416 4.957
PM2.5 196 39.235 17.925 5 88 6 81 -.196 2.402
Temp 196 15.439 2.628 6 22 7 21 -.547 3.711
LnCovid 196 5.412 2.038 0 8.137 .693 7.869 -1.101 3.063
LnTemp 196 2.72 .19 1.792 3.091 1.946 3.045 -1.434 6.974
LnPM2.5 196 3.51 .647 1.609 4.477 1.792 4.394 -1.25 3.671
Note: Descriptive statistics are shown with and without log transformation.
Table 2: Pairwise correlation analysis (Pearson correlation)
Variables LnCovid LnPM2.5 LnTemp
LnCovid 1.000
LnTemp 0.234* 1.000
LnPM2.5 0.210* 0.192* 1.000
Note:* shows significance at the 5% level.
Page 9/14Table 3: Pairwise correlation analysis (Spearman Correlation)
LnCovid LnPM2.5 LnTemp
LnCovid 1
LnPM2.5 0.1877*** 1
(0.0093)
LnTemp 0.1901*** 0.1152 1
(0.0084) 0.1125
Note: Parenthesis shows the p-value. * denotes significance at 1% level.
Table 4: Pairwise correlation analysis (Kendall’s rank correlation)
lncovid LnPM2.5 LnTemp
LnCovid 0.9967
1
LnPM2.5 0.1281** 0.9782
0.1297** 1
(0.0085)
LnTemp 0.1243** 0.0766 0.8934
0.1318** 0.0819 1
(0.0101) (0.1132)
Note: Parenthesis shows the p-value.
Table 5: Panel Regression Empirics
Page 10/14es Panel OLS Quantile regression Pooled OLS Fixed effects
LnPM2.5 0.6389*** 0.6746** 0.6401** 0.4489
[2.800] [2.590] [2.86] [3.40]
LnTemp 1.798** 1.6864* 1.801* 2.955***
[2.370] [1.950] [2.26] [3.860]
Constant -1.725** -1.044** -1.731*** -4.204*
[-0.840] [-0.440] [-0.820] [-1.830]
R2 0.1714 0.0294 0.0891 0.0873
Observations 196 196 196 196
The symbols *, **, and *** denote the significance level at 10%, 5%, and 1%, respectively. t-statistics of the corresponding
ients are reflected in brackets.
Figures
Page 11/14Figure 1
Spain COVID-19 Outlook
Page 12/14Figure 2
A: Daily New Cases of COVID-19 in Madrid B: Daily New Cases of COVID-19 in Catalonia C: Daily New
Cases of COVID-19 in Castilla-La Mancha D: Daily New Cases of COVID-19 in Castilla y Leon
Page 13/14Figure 3
A: Temperature variation in Madrid B: Temperature variation in Catalonia C: Temperature variation in
Castilla-La Mancha D: Temperature variation in Castilla y Leon
Supplementary Files
This is a list of supplementary les associated with this preprint. Click to download.
Spaindatasheetanalysis.xlsx
Page 14/14You can also read