NYSBERRY GROWERS - March 2020 - Cornell Dyson
←
→
Page content transcription
If your browser does not render page correctly, please read the page content below

EB 2020-04

                  Business   Tools for
                   NYSBERRY
                    BUSINESS TOOLS FOR

                  New York State

                   GROWERS
                  Berry Growers
                  Cornell University
                           CORNELL UNIVERSITY

KALOB WILLIAS, MS; MARIA KALAITZANDONAKES, MS; MIGUEL GÓMEZ, ASSOCIATE PROFESSOR
         CHARLES H. DYSON SCHOOL OF APPLIED ECONOMICS AND MANAGEMENT

                            March
                            M A R2020
                                  CH 2020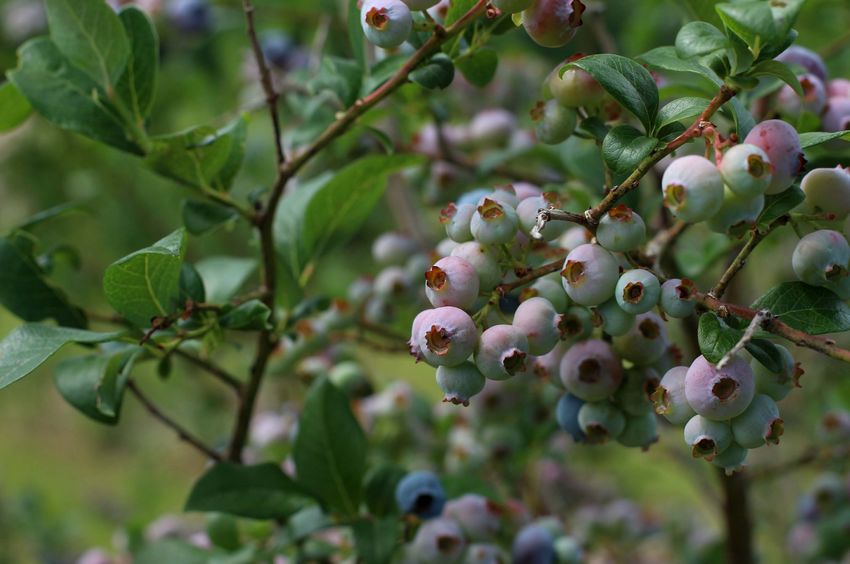
It is the Policy of Cornell University actively to support equality of educational and employment
opportunity. No person shall be denied admission to any educational program or activity or be
denied employment on the basis of any legally prohibited discrimination involving, but not
limited to, such factors as race, color, creed, religion, national or ethnic origin, sex, age or
handicap. The University is committed to the maintenance of affirmative action programs
which will assure the continuation of such equality of opportunity.
Page
                                                                    1

 INTRO   CTION
 INTRODUCTION

 The New York State Berry Growers Association (NYSBGA)
 commissioned the research team of Dr. Miguel Gomez from
 Cornell's Dyson School of Applied Economics and
 Management to conduct economic and market research for
 the benefit of berry growers in New York State (NYS). Since
 the beginning of 2018, this research team has been
 aggregating existing knowledge, working and surveying NYS
 berry farmers in effort to better understand and analyze berry
 growth and the berry market.
 The team has developed two tools for berry growers in New
 York State: an interactive production cost analysis tool and a
 competitive analysis. The production cost tool allows NYS
 farmers to calculate their production costs for specific berries
 and compare them to the costs of a representative farm in
 NYS. The competitive analysis uses a SWOT framework
 (strengths, weakness, opportunities, threats) to examine the
 NYSdocument
This berry industry with
              details theits  primaryofcompetitors.
                           findings     these two projects.
Information on how to find referenced documents is included in
each section. If you have any questions or comments please feel
free to reach out to Dr. Gomez's research group via
mig7@cornell.edu.
Page 2
BUSINESS TOOLS FOR NEW YORK STATE BERRY INDUSTRY - 2020                                                                      2

                          PROJECT 1: PRODUCTION COST ANALYSIS TOOLS
                          Through discussions with farmers at the        which took the form of Microsoft Excel
                          beginning of this research two things          documents, the research team created an
                          became evident. First, because of scale        instructional video that describes how to
                          and the number of different crops              use the tools and interpret the results.
                          produced by the average farmer, most
                          NYS berry farmers find it difficult to         This video can be found on YouTube:
                          disentangle production costs for their
                          berries from those of their other crops.
                          Second, if they were able to identify these              https://www.youtube.com/watch?
                          costs there was little in the way of                     v=APAQ4-tIcWQ&t=117s.
                          benchmarks to help them understand
                          areas in which they could improve. To
                          address these two issues, we developed a       Themain
                                                                         The main   objective
                                                                                 objective        in creating
                                                                                           in creating these toolsthese
                                                                                                                   was totools
                                                                                                                          help
                          set of three production cost analysis tools     was totohelp
                                                                         farmers   think farmers   to think
                                                                                         in a methodic       in athemethodic
                                                                                                       way about     costs
                          – one for strawberries, one for blueberries,    way about the costs incurred by specific
                                                                         incurred by specific production practices and then
                          and one for raspberries. They are available     production practices and then compare
                          on Dr. Gómez's website:                        compare
                                                                          them to   them
                                                                                      theirto their  perceivedbenefits.
                                                                                               perceived       benefits. They
                                                                                                                          They also help
                                                                                                                                  also
                                                                         farmers  identify production
                                                                          help farmers        identifypractices    which they
                                                                                                           production          are
                                                                                                                          practices
                          http://gomez.dyson.cornell.edu/research-        which they
                                                                         performing         are performing
                                                                                      efficiently,  and those uponefficiently,   and
                                                                                                                     which they could
                          projects.php                                    those upon
                                                                         improve.           which
                                                                                   The method       forthey   could improve.
                                                                                                        the development  of these The
                                                                                                                                  tools,
                                                                          method for the development of these tools,
                                                                         instructions on how to use them and interpret the results,
                          These tools were distributed via the            instructions on how to use them and
                          leadership of the NYSBGA to its                and  discussion
                                                                          interpret    theof results,
                                                                                               some of their
                                                                                                          andlimitations
                                                                                                               discussionare included
                                                                                                                              of some
                          members. Along with the three tools,           below.
                                                                          of their limitations are included below.

                                                                  METHODS

                          Information used to develop for the three      used to generate production cost
                          tools comes from strawberry, blueberry,        benchmark standards for NYS
                          and raspberry enterprise budgets               strawberries, blueberries, or raspberries in
                          prepared by Daniel Welch, an extension         NYS. A series of questions were then
                          associate in Cornell’s Charles H. Dyson        formulated for any given berry grower to
                          School of Applied Economics and                answer and then compare to the
                          Management. These budgets included             benchmarks.
                          labor use, machinery use, frequency, and
                          wage rates for main production activities      Production activities are divided into “pre-
                          – i.e. irrigation installation, ground         production year” and “production year”
                          preparation, fertilization, irrigation, pest   activities, which allows for separate
                          management, harvest, etc. As the               analyses of the different growth periods
                          budgets are a few years old, the research      of a berry crop. An assumptions sheet is
                          team validated data for the key variables      also included that shows the derivation of
                          with NYS berry farmers through a series        the values for the representative grower
                          of phone interviews and farm visits and        in each of these time periods. These
                          made small adjustments as necessary.           assumptions were generated using a
                                                                         combination of conversations with
                          Once data were established for labor use,      farmers and the original enterprise
                          machinery use, frequency, and wage rates       budgets.
                          for each production activity, they were
BUSINESS TOOLS FOR NEW YORK STATE BERRY INDUSTRY - 2020

                          HOW TO USE THE TOOLS

The first sheet in each of the three Excel workbooks is a simple
instructions page that lays out how to use these tools. These instructions
are listed below.

To use the production cost analysis tools:

         Answer the questions about your
  1      production practices in the blue
         “Questionnaire” tab.

         Examine the green “Report Card” tabs for
  2      a comparative analysis of your production
         practices and those of the representative
         NYS farm.

         See the orange “Assumed Production

  3      Practices” tab to clarify any questions
         about what assumptions this
         representative NYS farm is using.

The instructional video referenced above walks through how to do this
with the blueberry tool. As the tools are all structured similarly this video
is useful for all three tools. The video also describes some important
features, methods, and limitations of these tools.

                  HOW TO INTERPRET THE RESULTS

After answering the series of questions in the “Questionnaire” tab, results will be
populated automatically in the “Report Card” tabs. The three report card tabs
present analyses of 1) pre-production year costs, 2) production year costs, and 3)
wages and use rates. Each report card tab has two sections. The first is a graphical
analysis that compares, in bar graph format, the production costs by activity of the
farmer who filled out the questionnaire to those of the representative NYS grower.
The second section presents the same information in numeric format, and also
provides values showing the dollar-per-acre differences in costs as well as the
percentage differences in costs for each production activity. A pre-production
report card might look like Figure 1 and Figure 2 below.
Page
                                                                                                            4

      FIGURE
      FIG RE 1:: EEXAMPLE
                   A PLE OFOF
                            T THE GRAPHICAL
                              E GRAP         ANALYSIS
                                     ICAL ANALYSIS    SECTION
                                                   SECTION      OF
                                                           OF A PRE
      A PRE-PRODUCTION YEAR REPORT CARD FOR BLUEBERRIES.
                     PRO      CTION YEAR REPORT CAR FOR BL EBERRIES

       FIG RE 2:: EEXAMPLE
       FIGURE        A PLE OF
                           OFTTHE
                                E NNUMERICAL
                                      ERICAL ANALYSIS SECTION OF
                                             ANALYSIS SECTION OF AA PRE
       PRE-PRODUCTION YEAR REPORT CARD FOR BLUEBERRIES.
              PRO CTION YEAR REPORT CAR FOR BL EBERRIES

Activity                     My Cost ($/Acre)                         Difference $         Difference %
                                                Representative Farm
                                                Cost ($/Acre)
Soil sampling                $29.33             $25.00                $4.33                8%
Ground preparation           $117.08            $114.38               $2.71                1%
Soil amendments              $134.00            $50.50                $83.50               45%
Seeding ground cover         $32.33             $39.88                -$7.54               -10%
Mowing                       $289.50            $172.34               $117.16              25%
Fleld layout                 $14.67             $25.00                -$10.33              -26%
Planting strip preparation   $89.33             $135.00               -$45.67
Planting                     $717.33            $646.50               $70.83               5%
Irrigation installation      $163.00            $299.00               -$136.00             -29%
Irrigation application       $502.03            $602.80               -$100.77
Mulch application            $193.33            $215.06               -$21.73              -5%
Hand weeding/flower rem      $510.00            $792.00               -$282.00             -22%

                                                                         Negative values here mean your costs
                                                                         are lower than Industry averages
Page
 BUSINESS TOOLS FOR NEW YORK STATE BERRY INDUSTRY - 2020                                                                            5
                                                                                                                                5

        HOW TO INTERPRET THE
           RESULTS, CONT.
  As an example, the analysis presented above
 in Figure 1 and Figure 2 suggests that this
 particular farmer incurs significantly lower
 costs per acre than the representative farmer in
 their hand weeding and flower removal
 processes, but significantly higher costs in their
 mowing processes. From here it is important
 that a farmer add context to the analysis by
 reviewing the “Assumed Production Practices”
 in the orange tab. As mentioned above, the
 intent of these tools is to help farmers analyze
 their production practices and identify areas in
 which they are performing well and areas in
 which they may be able to improve their
 practices and increase their margins.

 Just because this analysis tells the farmer that
 their mowing costs are 25% higher per acre
 than those of a representative farmer does not
 mean the farmer should make drastic changes
 to their mowing practices. Though it does
 suggest there may be some cost savings to be
 had, the difference may also be a result of
 geographical or business structure differences
 between their farm and the representative
 farm. Here we emphasize that it is important to
 use these tools as starting points. After initially
 reviewing the report cards, a farmer ought to
 understand their implications by thoughtfully
 reviewing the assumed production practices,
 and then researching or speaking with other
 growers about certain production practices
 they think they could improve upon.

                                                LIMITATIONS OF THE TOOL
 With an industry as diverse in practices       agronomic consulting.                           Secondly, we felt that adding this level
as berry growing, it is important to                                                            of complexity would make it more
consider the limitations to any efforts at      Instead, these tools are intended to help       difficult for individuals to retrieve
general analysis. First and foremost,           growers think about their production            simple, actionable ideas from the tool.
every farm is different and every farmer        practices as they relate to berries, and        With an industry as diverse in practice
is different. Economies of scale may            identify areas in which they may be able        as berry growing, it is important to
make a large difference in a farmer’s           to cut costs.                                   consider the limitations to any efforts at
ability to lower costs, as will their reasons                                                   general analysis. First and foremost,
for farming.                                    Lastly, these tools intentionally do not        every farm is different and every farmer
                                                examine input costs of items such as            is different.
Second, it is important that the assumed        fertilizer, pesticides, or plants. The reason
production practices not be considered          for this is two-fold. First, input prices can   With all this in mind, we hope you find
agronomic advice, as that is not what           vary widely depending on a variety of           the tools useful and profitable to your
they are intended to be. The Cornell            factors, e.g. quantity purchased, time of       berry growing efforts, and that you feel
FarmNet and Cornell Cooperative                 year purchased, or which products a             free to reach out with any questions or
Extension services are great sources for        farmer is accustomed to using.                  recommendations for improvement.
Page
BUSINESS TOOLS FOR NEW YORK STATE BERRY INDUSTRY - 2020                                                                    6
                                                                                                                       6

                        PROJECT 2: A NYS COMPETITIVE ANALYSIS

A second goal of the project was to evaluate how              SWOT ANALYSIS
competitive the NYS berry industry is compared to other
states in certain key metrics, including several aspects of   A SWOT analysis is a strategic planning framework
production and marketing. The leadership of NYSBGA            common in business settings that outlines the strengths,
was particularly interested in an evaluation in order to      weaknesses, opportunities and threats of a particular
improve statewide and individual production and               organization, industry or project. It describes:
marketing decisions.

This section outlines the methods of analysis used and        Strengths – Internal factors that make an organization
then presents key findings in SWOT format for NYS             stronger or better than competition
blueberries, strawberries, and raspberries individually and
then for the NYS berry market as a whole.                     Weaknesses – Internal factors that make an organization
                                                              weaker or worse off than competition

                      METHODS                                 Opportunities – External factors that are favorable or provide
                                                              a potential competitive advantage
Secondary data were collected from relevant academic
research and the United States Department of                  Threats – External factors that are unfavorable or have the
Agriculture’s (USDA) Economic Research Service (ERS).         potential to harm an organization
Key variable categories included acreage, yields, prices,
imports, exports and consumption. Data were obtained
for the U.S. as a whole and for individual states over the
last 20 to 30 years where available. These variables were     The SWOT analyses presented below represent a careful
obtained for blueberries, strawberries, raspberries, and      analysis of all available data. Unless otherwise stated, the
blackberries. For the most part, the same set of variables    SWOT analyses compare the NYS berry industry to the
was available for each of the berries, with the notable       U.S. berry industry. Further details on the claims and logic
exception of blackberries for which little data was           found in the SWOT analyses are provided in the
available. Because of the lack of blackberry data, a formal   additional document titled “New York State Berry
SWOT analysis was not conducted, but the available data       Industry Competitive Analysis - Facts and Figures”, which
is summarized in the “New York State Berry Industry           presents findings in both written and graphical form. We
Competitive Analysis - Facts and Figures” available from      have included this document separately in order to keep
the New York State Berry Growers Association:                 the current document brief as the “Facts and Figures”
                                                              document includes almost 70 pages of graphs, tables
https://www.nysbga.org/berry-growers                          and discussion. Careful study of the current document
                                                              alongside the “Facts and Figures” document will provide
                                                              the best planning insight for individual farmers or
These data were analyzed graphically and statistically.
                                                              industry players.
Key findings are compiled in the SWOT analysis that is
reviewed here for convenience: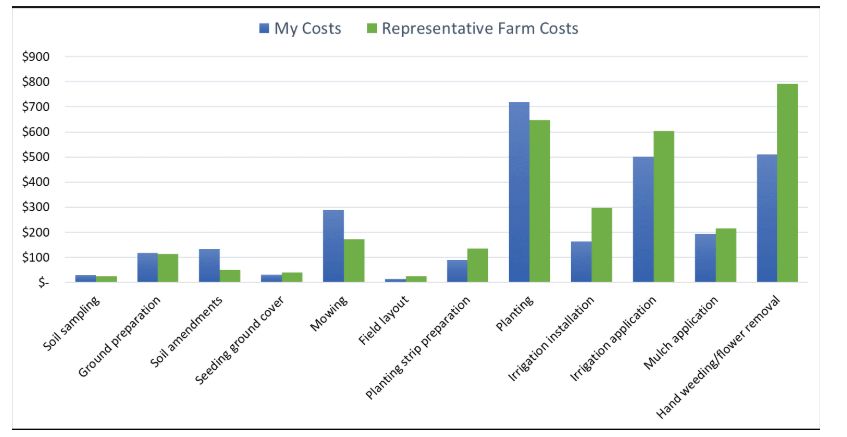
Page 7
BUSINESS TOOLS FOR NEW YORK STATE BERRY INDUSTRY - 2020                                                                 7

                                  NYS SWOT ANALYSIS: BLUEBERRIES
                     STRENGTHS                                                   OPPORTUNITIES

NYS blueberry growers have experienced stable growth           U.S. blueberry consumption has increased by 10%
in prices of 6.1% over the last ten years. As of 2016, NYS     annually over the last ten years while also enjoying
growers received the second highest prices of all other        relatively low volatility in demand. It currently comprises
states except for Florida, whose elevated prices are due to    17% of the average U.S. consumer’s berry consumption.
the extended growing season that allows them to sell           Export demand has increased steadily over the same
fresh berries for premiums when other leading states           period, during which time Canada has taken the lion’s
cannot. NYS’s high prices are attributable to some degree      share of exports. NYS growers are in a great geographic
to their successful development of experiential                position to develop export relationships with Canadian
purchasing channels such as farmers markets and U-pick         buyers and should consider developing dried blueberries
operations where people are willing to pay more because        for this market as export prices for this product have
of the way the purchasing experience makes them feel.          increased substantially over the last ten years. Lastly, NYS
                                                               producers may benefit from efforts to understand New
                    WEAKNESSES                                 Jersey, Maine, and Michigan production practices, as they
                                                               experience a similar climate yet have yields three times
NYS blueberry acreage accounts for only 1.0% of the US         as much as NYS. If NYS growers could improve their
total, whereas Maine, Michigan, Georgia, and New Jersey        yields blueberries could generate on average $4,200
collectively account for 71.1% of US acreage in somewhat       more revenue per acre than would strawberries for NYS
even amounts. While U.S. blueberry acreage has                 growers.
increased 12% annually over the last four years, NYS
acreage has increased at only 3.75% over the same                                      THREATS
period, with nearly zero growth in years before that.
Similarly, NYS blueberry yields come in amongst the            While U.S. blueberry demand has increased by 10%
lowest, and are 1/5 or 1/6 of the highest yielding states or   annually over ten years, NYS production has only
1/3 of states like New Jersey and Michigan which               increased by 5%. Most of the increasing demand during
experience similar weather conditions as NYS. These facts      this time has been met by increases in production from
are likely due somewhat to the farm structure of many          other leading states and imports to the US from Canada
NYS berry growers, who have smaller acreage and a              and Chile. Although the higher prices NYS growers enjoy
larger number of crops, and thus prevents the efficiencies     are great, if producers cannot keep up with demand,
of scale experienced by larger farms with just a few – or      consumers may shift away from NYS berries if favor of
even one – crop.                                               berries from states that can meet their quantity and
                                                               timing needs.

                                 HELPFUL                                           HARMFUL

                                Strengths                                           Harmful
       LANRETNI

                  Second highest prices by state                        Low and stagnant acreage
                  Experiential purchasing                               Low and stagnant yields
                  premiums                                              Large number of crops per farm

                             Opportunities                                           Threats
       LANRETXE

                  Stable growth in U.S. demand                       Increasing imports to meet U.S.
                  Proximity to Canada for export                     demand
                  Export of dried blueberries                        Increasing production in major states
                  Understand Michigan, Maine and New                 Lower prices from other states
                  Jersey production
                  Higher relative value per acre
BUSINESS TOOLS FOR NEW YORK STATE BERRY INDUSTRY - 2020 8
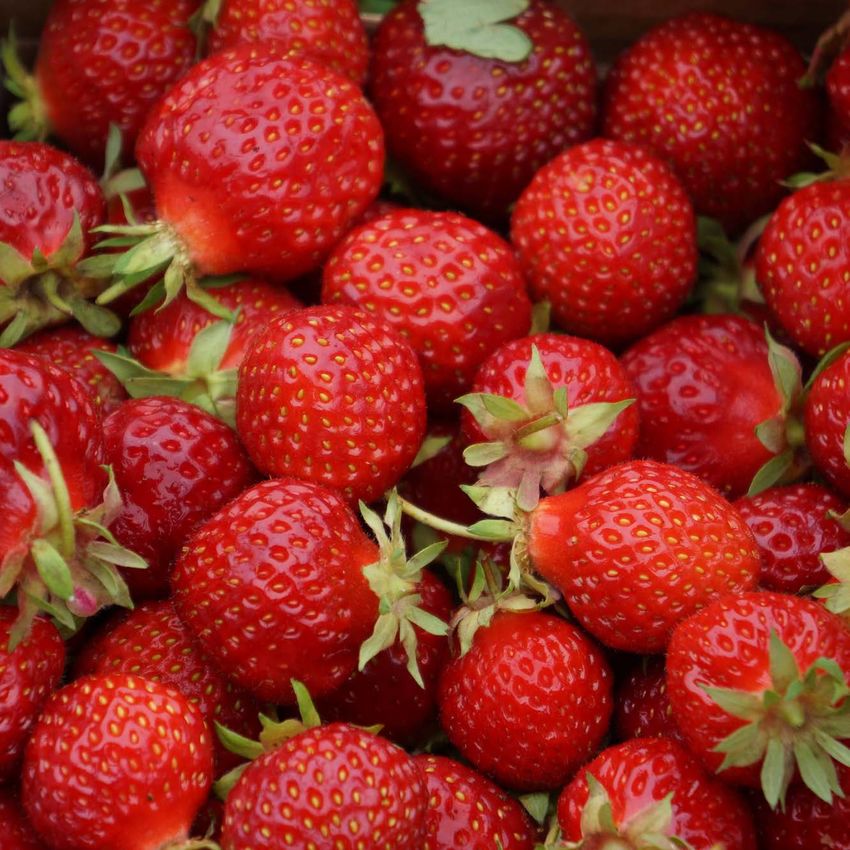
NYS SWOT ANALYSIS: STRAWBERRIES
STRENGTHS OPPORTUNITIES
Strawberries make up 75% of the typical U.S. consumer’s Strawberries are the most mature of all berry markets in
berry consumption, however 70% of that consumption is the US. Though long-term growth in consumer demand
fulfilled by California and Florida. Unlike these states, and grower prices have been low – 2% each – they have
however, NYS is close not only to the major northeastern experienced the lowest volatility of all berries, making
markets of the U.S., but also Canada, who is the primary them a low-risk, lower-return option for berry production.
importer of US strawberries. Additionally, unlike California Also, NYS growers should become familiar with
and Florida, production in NYS is on small farms that production practices of strawberry growers in Wisconsin,
each produce various crops and allow for growers to Michigan and Pennsylvania, who have roughly double
collect direct to consumer price premiums through NYS yields with comparable climatic conditions. Similarly,
marketing channels such as U-pick operations, farm though geography likely precludes attaining yields similar
stores, farm stands, and farmer’s markets. to those of California, the fact that they are 25 times
higher than those of NYS suggests that there may be
WEAKNESSES something to learn from growers of the Golden State.
(Note that the most recent data available comes from THREATS
2012 and before). As California and Florida increase their
acreage by 3% annually to meet demand, other Consumers are highly likely to shift away from strawberry
producing states have decreased acreage by 3.2% consumption and towards consumption of other berries
annually. Though NYS strawberry acreage has not as the price of strawberries increases, whereas this effect
decreased, it has also not increased, showing virtually is not as strong with other berries. Also, while California
zero long-term growth. NYS strawberry growers and Florida dominate domestic strawberry production,
experience some of the lowest yields of all states, and Mexico exports 550 million pounds, or 16% of US
while most states increase yields by about 1% annually, consumption, to the U.S. annually, making it the second
NYS yields are decreasing at about 5.1% per year. largest producer of U.S. consumed strawberries next to
Furthermore, the harvest window for NYS strawberry California. Additionally, these three locations experience
growers is not optimal, forcing them to sell during peak much longer harvest windows than NYS and many other
supply and thus fetching the lowest prices of the year. states. The domination of production and harvest timing
These facts suggest that strawberries generate on effectively make these three players – though primarily
average $4,200 less revenue per acre for NYS growers California – price and trend setters in the US strawberry
than do blueberries. market that are forcing other producing states either out
of production or into niche markets.
HELPFUL HARMFUL
Strengths Harmful
LANRETNI
Proximity to Canada and Low and stagnant acreage
Northeast markets Low and decreasing yields
Experiential purchasing Short, non-optimal harvest window
premiums Lowest revenue/acre of berries in NYS
Opportunities Threats
LANRETXE
Stable growth in U.S. consumer High demand elasticity
demand Mexico, California and Florida
Stable growth in U.S. grower prices acreage and yields
Understand Wisconsin, Michigan, and Mexico, California and Florida harvest
Pennsylvania production windows
Understand California productionBUSINESS TOOLS FOR NEW YORK STATE BERRY INDUSTRY - 2020 9
NYS SWOT ANALYSIS: RASPBERRIES
Note: Because of minimal production in all other states, strawberries and that these revenues are rapidly
data was only available for California, Oregon, and increasing and volatile. U.S. demand seems to have
Washington, making analysis of internal aspects of the increased so quickly that production has been unable to
SOWT analysis – strengths and weaknesses of NYS – difficult. keep up, allowing Mexico to supply 33% of U.S. raspberry
consumption. Though Mexico has climatic advantages
STRENGTHS over many U.S. states, any producing U.S. state has a
home-court advantage to be considered through the use
Though data is not available for NYS prices, it is reasonable of “Local”, or “Product of the USA” branding and
to assume NYS raspberry growers enjoy price premiums comparatively lower shipping costs.
similar to other berries through experiential purchasing in
marketing channels such as U-pick operations, farmer’s THREATS
markets, etc. NYS is also ideally positioned to meet the
consumption demands of Canada, which is by far the More than other berry crops, raspberries exhibit
number one importer of fresh and frozen US raspberries. significant annual swings in yield which cause swings in
domestic product for U.S. consumers. This in turn causes
WEAKNESSES U.S. raspberry grower prices to be highly volatile. All told,
raspberries are the most volatile berry in terms of yields,
NYS raspberry acreage and production are small enough consumer demand, and prices. They can be considered
that the USDA has not collected NYS data, which illustrates the high-risk, high-return alternative to strawberries for
the lack of market sway NYS growers have and the NYS Growers, whereas blueberries fall somewhere in
importance of niche markets. between. The reported acreage and yield increases
experienced by U.S. raspberry growers are due to
OPPORTUNITIES California growers, whereas growers in other states
experience stagnant or decreasing acreage and yields.
Though raspberries only comprise 8% of the average U.S. California, which currently accounts for 67% of us
consumers’ berry purchases, they have experienced the raspberry production and yields 2.5 times as much as the
fastest growing demand amongst berries by far. U.S. next state, Florida, will likely continue to increase in
consumption of raspberries has grown 18% annually over market sway and price control, possibly forcing other
the last ten years, and 30% annually over the last four years. states out of production or into niche markets. Mexico
These demand increases are correlated with, and likely one also presents a threat to small raspberry production
reason for, yield increases of 9.8% annually over the last four states as it consistently increases its exports to meet U.S.
years. Amongst major west-coast production states, we see consumption needs. Lastly, both California and Mexico
that raspberries offer higher revenue per acre than enjoy longer growing seasons and better climatic
blueberries, but lower than conditions than most U.S. producing states.
HELPFUL HARMFUL
Strengths Harmful
LANRETNI
Proximity to Canada and Negligible production on U.S.
Northeast markets stage
Experiential purchasing Lack of U.S. market power
premiums
Opportunities Threats
LANRETXE
Highest U.S. demand growth of berries High volatility in production,
Strong increases in yields consumption, and price
Strong increases in revenue/acre Increasing California acreage and
Large portion of demand met by yield
imports Increasing Mexican importsPage
BUSINESS TOOLS FOR NEW YORK STATE BERRY INDUSTRY - 2020 10
10
NYS SWOT ANALYSIS: GENERAL BERRIES
STRENGTHS OPPORTUNITIES
NYS berry growers generally receive price premiums U.S. consumption of berries has increased steadily by 2%
through their focus on experiential, direct to consumer annually in the short term and 4% annually in the long
sales through marketing channels such as farmer’s term. These increases are partially due to consumers
markets, farm stores, and U-pick operations. Barring large increased perception of berries as a “healthy” food.
investments in technology and acreage, they will need to Though grower prices have not seen large increases,
continue to strengthen their presence in these markets revenue per acre has increased steadily over the long
to maintain profitability. Additionally, NYS growers enjoy term as growers find new ways to increase yields across
not only proximity to major markets in the northeastern all berries. Because of stagnation in NYS berry yields,
US, but also proximity to Canada, a leading importer of all growers should consider investing in understanding the
US berries. growing practices of other berry producing states in the
Northeast United States that experience similar growing
WEAKNESSES conditions. Doing this may help NYS growers to realize
increases in revenue per acre they currently do not.
In general, NYS total berry acreage has been very small
and has remained stagnant over the short and long THREATS
terms. Similarly, NYS berry yields have been amongst the
lowest of all states and have either remained stagnant or As U.S. berry demand rises, increases in imports from
decreased over the short and long terms. These facts other countries – especially Mexico – claim increasingly
combine in a way such that NYS berry production larger portions of that demand. At the same time, U.S.
accounts for a very small portion of the U.S. total – 1% or berry production is consolidating in terms of farm size
less for all berries – giving it little to no market influence. and number of states involved in production, with
These trends are due in part to the nature of NYS berry California overwhelming all other states in berry
farms which on small and diversified. This makes it production. This consolidation has pushed some states
difficult for farmers to focus on berries and increase yields out of production and others into niche markets, a trend
and margins in ways that competing states do, many of that will likely continue. Finally, amongst farm products,
which plant larger tracts of berries and fewer crops per berry price growth has been outpaced significantly by
farm allowing them to benefit from economies of scale. price growth in tree nuts and citrus, while keeping up
NYS growers, should work to maintain their niche with other fresh fruits and vegetables.
markets over the long term.
HELPFUL HARMFUL
Strengths Harmful
LANRETNI
Strong experiential purchasing Low and stagnant acreage
premiums and presence in Low and stagnant or decreasing yields
niche markets Small berry acreage per farm and high
Proximity to Northeast and numbers of other crops
Canadian markets
Opportunities Threats
LANRETXE
Long-term increases in U.S. demand Increasing imports to meet demand
Long-term increases in value per acre Consolidation of production
Understand production in similar Comparatively low price growth
states amongst farm productsREFERENCES ERS, USDA. (2018, September 18). Fruit and Tree Nut Data, Data by Commodity . Retrieved from United States Department of Agriculture, Economic Research Service : https://www .ers.usda.gov/data-products/fruit-and-tree-nut- data/data-by-commodity/ ERS, USDA. (2018, August 3). Fruit and Tree Nut Yearbook Tables. Retrieved from United States Department of Agriculture, Economic Reserach Service: https://www .ers.usda.gov/data- products/fruit-and-tree-nut-data/fruit-and-tree-nut-yearbook- tables/#Berries ERS, USDA. (2018, August 30). The Farm Income Atlas. Retrieved from United States Department of Agriculture, Economic Research Service: https://public.tableau.com/views/IncomeStatementStoryPoint3/In comestatement? ampé&display count=no&embed=y&:toolbar=no&showVizHome= gle)
EB No             Title                                                                        Author(s)
2020-04 Business Tools for NYS Berry Growers                                                   Williams, K., Kalaitzandonakes, M., Gomez,
                                                                                               M.
2020-03 Regional Grass Fed Beef Supply                                                         Kalaitzandonakes, M., Gomez,
                  Chain                                                                        M., and Peters, C.
2020-02 Cost of Establishment and Production of Cold                                           Davis, T., Gomez, M., Moss, R.,
                  Hardy Grapes in the Chautaqua Region of New Martin, K., and Walter-Peterson, H.
                  York- 2019
2020-01 Cost of Establishment and Production of                                                Davis, T., Gomez, M., Moss,
                  V. Vinifera Grapes in the Finger Lakes
                                                                                               R., Walter- Peterson, H.
        Region of New York - 2019
2019-06 Adapting Your Labor Strategies to New                                                  Eiholzer, L., Ifft, J., Karszes, J., and Stup, R.

                  York's Revised Farm Employment Laws

2019-05 Assessing the Barriers to Increasing Customer                                          Schmit T.M., Severson,
                  Participation and Famm Sales at Farmers
                  Markets: Implications for Marketing Strategy                                 RM. & Sawaura, E.
2019-04 Crop Budgets and Cost & Return Studies for                                             Li, J., Gomez, M. & Murphy, J.
                  Organic Grain in Westem New York

2019-03 2018 New York State Berry Market Analysi                                               Davis, T., Gomez, M. & Pritts, M.
                  Pricing Information of Local Berries

2019-02 The State of the USDA Inspected Red Meat                                               Waro, M., Kalaitzandonakes, M., Baker, M.,
                  Harvest & Processing Industry in New York &                                  Peters, C., Gomez, M. & Conard, M.
                  New England
2019-01 ‘The State of the Agricultural                                                         Stup, R,, Ift, J. & Maloney, T.
                  Workforce in New York

                                                                                               Karszes, J.
2018-08 Six Year Trend Analysis New York State Dairy
                  Farms Selected Financial and Production
                  Factors

                                                                                               Tauer, L W.
2018-07 Production Agriculture Diversification for
                  Each State in the United States
2018-06           Dairy Business Summary New York State 2017
                                                                                               Karszes, J., Christman, A.,
                                                                                               Howlett, A. & Knoblauch, W.
Paper copies are being replaced by electronic Portable Document Files (PDFs). To request PDFs of AEM publications, write to (be sure to include your
e-mail address): Publications, Department of Applied Economics and Management, Warren Hall, Cornell University, Ithaca, NY 14853-7801. If a fee is
indicated, please include a check or money order made payable to Cornell University for the amount of your purchase. Visit our Web site
(http://dyson.cornell.edu/outreach/#bulletins) for a more complete list of recent bulletins.
You can also read