Derates and Outages Analysis - A Diagnostic Tool for Performance Monitoring of SaskPower's Boundary Dam Unit 3 Carbon Capture Facility ...
←
→
Page content transcription
If your browser does not render page correctly, please read the page content below

* NOTE: All content created by the International CCS Knowledge
                                                                     Centre is subject to the Knowledge Centre's Open License.
                                                                             To review the terms of the Open License, click here

           15th International Conference on Greenhouse Gas Control Technologies GHGT-15

                                      15th -18th March 2021, Abu Dhabi, UAE

 Derates and Outages Analysis - A Diagnostic Tool for Performance
 Monitoring of SaskPower’s Boundary Dam Unit 3 Carbon Capture
                             Facility
           Dominika Janowczyka, Stavroula Giannarisa,, Keith Hillb, Jonathan Ruffinib,
                   Brent Jacobsa, Yuewu Fenga, Wayuta Srisanga, Corwyn Brucea
               a
                The International CCS Knowledge Centre, 198 – 10 Research Drive, Regina, Saskatchewan Canada S4S 7J7
                               b
                                SaskPower, 2025 Victoria Avenue, Regina, Saskatchewan, Canada S4P 0S1

Abstract

   Establishing carbon capture and storage (CCS) as a viable carbon dioxide (CO2) emission mitigation strategy for
various industries will require identifying and eliminating existing barriers to achieving desired performance.
SaskPower’s Integrated Carbon Capture and Storage Project on Boundary Dam’s Unit 3 (BD3) began operations in
October of 2014. By early December 2020, the facility had captured over 3.8 million metric tonnes of CO2. Although
no small feat, the cumulative volume of CO2 captured by late 2020 does not reflect the expected cumulative capture
volume considering the five-year operational window and the size of the capture facility. As with many “first of a kind”
facilities, unforeseen barriers hindered the performance of the capture facility. A couple of challenges with CCS
application to coal-fired power plants have been the lost capture potential due to power plant outages and derates (which
limits flue gas availability to the capture island) and the performance of capture island. Capture operations stop during
all outages of the power plant; this presents a constraint to be accommodated when applying CCS. Minimizing costs
by improving capture island performance while also satisfying outage constraints is key. As CCS technologies seek
increased deployment, not limited to electricity generation but to other industries as well, it is necessary to identify,
review, and eliminate existing barriers of capture system performance. Performance evaluation is becoming
increasingly important. Derate and outage analysis identifies areas of concern and provides a means for reporting
performance. Such analysis helps to better understand how the process works and to identify process bottlenecks, for
daily operation decisions as well as long term impacts.

  This paper presents and explains fundamental concepts of data analysis to improve derates and outage analysis at
BD3. An analytic model to evaluate the outages and derates of the coal-fired unit and the carbon capture facility is
presented. The proposed model accounts for hourly data from the CO2 capture plant which was extracted from the OSI
PI historian during the six-year operating period (October 2, 2014- October 1, 2020). The model describes how basic
Microsoft Excel analysis can be used to detect outage and derate problems. Data analysis included: flue gas flow
estimation; CO2 mol fraction; CO2 emissions, maximum theoretical amount of CO2 captured by the plant; and actual
amount of CO2 capture by the plant.

Keywords: Boundary Dam, SaskPower, Microsoft Excel, Derates, Outages, Carbon Capture and Storage, Post Combustion
Capture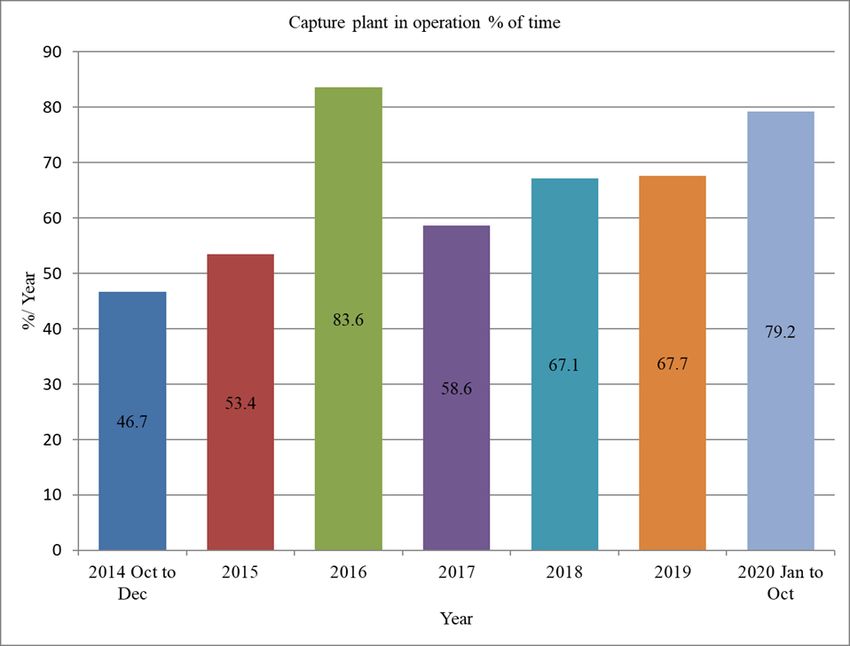
GHGT-15 Janowczyk, Giannaris, Hill, Ruffini, Jacobs, Feng, Srisang, Bruce               2

 Nomenclature

 CO2                Carbon dioxide
 SO2                Sulphur dioxide
 BD3                Boundary Dam Unit 3
 CCS                Carbon Capture & Storage
 EOR                Enhanced Oil Recovery
 ICCS               Integrated Carbon Capture & Storage
 IEA                The International Energy Agency

 Units
 °C                 degree Celsius
 GT                 Gigatonnes
 kg/m3              kilogram/cubic meter
 kg/s               kilogram/second
 m3/s               cubic meter/second
 mA                 milliampere
 MW                 megawatt
 kPa                kilopascal
 TPD                Tonnes Per Day

1. Introduction

1.1 Post-combustion carbon capture operations

    Much of the world’s current energy needs are supplied by the combustion of non-renewable energy sources. This
practice is associated with the release of enormous quantities of greenhouse gases, particularly CO2, to the atmosphere.
Anthropogenic emissions of CO2 have been identified as a significant greenhouse gas contributor. Atmospheric levels
of CO2 are higher today than at any point in the past 800,000+ years [1]. In the light of advancing climate change,
greenhouse gas mitigation technologies have become more significant. There is a great incentive to reduce
anthropogenic CO2 emissions to counteract global warming. CCS technology is one such solution that can facilitate the
mitigation of CO2 emissions on an industrial scale. Furthermore, the absorption of CO 2 via chemical solvent absorption
is one of the most developed techniques for post-combustion CCS. Post-combustion capture is a downstream process
where CO2 is captured from combustion exhaust gas via reactive solvent absorption. When integrating CCS into an
existing facilities operation, the systems within the facility must be accounted for, as changes could affect the
performance of the facility and its reliability. Capital and operating costs must be calculated as they determine the
viability of a project at an industrial scale. CCS is becoming popular for a variety of reasons. The International Energy
Agency (IEA) states that CCS must be able to mitigate 94 gigatonnes (GT) of CO2 before 2050 to limit the global
temperature rise to 2°C [2]. Large-scale CCS is one of the essential technologies that can reduce CO2 emissions.
Capturing the most carbon possible using affordable technology is key for CCS to be considered a major climate change
mitigation option. Currently CCS technologies have been applied to two industrial scale coal-fired power plants
worldwide; SaskPower’s BD3 ICCS (Integrated Carbon Capture & Storage) Project and W.A. Parish’s Petra Nova
Project (operations at Petra Nova were suspended on May 1st, 2020, citing low oil prices). As CCS technologies seek
to expand into other industries it is necessary to identify, review, and eliminate process bottlenecks that degrade the
performance of the capture facility. Performance evaluation is becoming increasingly important. Derate and outage
analysis identifies areas of concern and provides a means for reporting performance. Such analysis helps to better
understand the process limitations. By studying such data, carbon capture technology and integration can be tailored to
meet the needs of the industry.

   Boundary Dam is a coal-fired power station, located near Estevan in Saskatchewan, Canada which began operations
with two units commissioned in 1959, and ultimately expanded to six units. The power plant burns a locally sourced
lignite coal. Units 1 and 2 were retired in the early 2010’s. Development of CCS at Boundary Dam began in 2007; after
GHGT-15 Janowczyk, Giannaris, Hill, Ruffini, Jacobs, Feng, Srisang, Bruce 3
numerous studies, the decision to proceed with the project was made in 2010 with construction beginning in the Spring
of 2011. Capture operations began in October of 2014. Modifications and upgrades to the unit yielded a fully integrated
CCS retrofit with a total plant net output of 150 MW without CCS in service and approximately 110 MW during capture
operations. The captured CO2 product is compressed and transported via pipeline on a continuous basis to an off taker
and used for CO2-enhanced oil recovery (CO2-EOR) operations in the nearby Weyburn oilfield area. Here it is injected
1.7 km underground into the oil-bearing Midale geological formation. Additionally, on an intermittent basis, CO2 is
transported by pipeline to the Aquistore site for injection and long-term geological storage in a deep saline geological
formation approximately 3.4 km under the ground.
The capture facility at BD3 has been operating since 2014. During this time, especially in the early days of operation,
there had been difficulties with the plant being able to reliably supply the contracted CO2 to the off taker. As is
commonly experienced with “first of kind” projects, the capture facility at BD3 experienced many operational
challenges which impacted its overall performance and reduced its reliability. During the first year of operation many
of these operational challenges were related to the poor understanding of issues causing derates, limiting the plant’s
performance. Facilities like the BD3 ICCS project, based on chemical processes, require a refining period to reach
optimum performance. Solutions to these challenges are crucial not only for improving the reliability of the individual
facility but for establishing and strengthening global perception and confidence in CCS as a CO 2 mitigation solution.
The challenges facing the facility were further complicated by excessive design and construction deficiencies. These
issues resulted in poorer than anticipated emissions performance, (as has been publicly reported by SaskPower) [4].
Operational data of the BD3 capture facility is monitored and logged on a continuous basis. Evaluating the first six
years of this historical operational data highlights improvements in capture performance. There is a gap between
installed capacity (design capacity) and actual capacity. Studies of the facility’s operational history, which is accessible
from the OSI PI Historian, can help diagnose the main causes of capture losses, derates and outages, while also allowing
engineers to analyze the derate and outage history from previous years, and determine mitigation measures.
This paper presents and explains fundamental concepts of data analysis which have been used to identify process
variables and related phenomena which can be used as predictors of derates and outages at the BD3 facility. The data
was put into a model, which was developed by the International CCS Knowledge Centre together with SaskPower’s
experts. The model presents the design and development of a Microsoft Excel based analysis tool and explains system
analysis. System analysis, including derate and outage evaluations, establish threshold assumptions which can help to
gather more outage and derate related information which can be utilized to implement measures, be they process or
procedural, to reduce problems. Analysis showed that early identification of operational abnormalities can mitigate
unplanned outages. This, in turn, reduces the amount of time that the unit is out of service and can facilitate ease of
planning for maintenance outages. The analysis, if implemented, could save on operational costs.
1.2 Capture plant outages compared to power plant derates
Derate and outage analysis identifies areas of concern and provides a means for reporting performance. Derates
imply that the facility performance has been reduced because of operational issues with the process or its equipment
that limits the facility’s capacity. Derates can affect both the power plant and the capture plant.
Outages refer to a full shutdown of the facility. There are two types of outages, planned and unplanned. Planned
outages enable maintenance activities that are part of scheduled maintenance for equipment and are known well in
advance. Unplanned outages, on the other hand, reflect unforeseen issues with the process or its equipment. Unplanned
outages can be instantaneous or can be related to the progression of a derate that makes continued plant operation un-
sustainable and presents a short planning horizon for the outage. For both outages and derates, the capture facility is
dependent on the operation of the power plant as a prerequisite for its operation. The capture plant production of CO2
cannot exceed the operating point of the power plant. It is difficult to pinpoint the exact cause of an outage and/or
derate. Often a combination of factors and various equipment are involved.
2. Outage data preparationGHGT-15 Janowczyk, Giannaris, Hill, Ruffini, Jacobs, Feng, Srisang, Bruce 4
The capture plant outage analysis was developed to help SaskPower quantify the cause for each capture facility
outage. The capture facility was assumed to be off-line until the CO2 discharge valve was opened to allow captured
CO2 into the transfer pipeline. As per the derate analysis, described earlier, PI data was used to compile these outage
hours.
3. Outage data analysis
After compiling the outage times, the cause for each outage was added to the collected data spreadsheet after
reviewing on-line operator logs and further analyzing PI data. The primary identified cause for an outage became the
driver for that outage as it was typical for SaskPower to address numerous plant deficiencies and shortfalls during a
common outage. Some plant knowledge was necessary to compile the outages in a logical manner.
4. Derate data acquisition and preparation
SaskPower utilizes OSIsoft PI for operational data logging [3]. This system maintains a historical record of all
parameters that are measured and calculated by the integrated control system that operates both the power plant and
the CCS facility and allows lab results to be stored and time stamped within the system. The system has a user interface
that allows the user to visualize and access information, integrate other power plant information systems, and can also
perform analytical tasks. Hourly and averaged daily operational data for the ICCS project at BD3 during the six-year
period (October 2, 2014 - October 1, 2020) was extracted from PI. Data analysis yielded the following metrics:
Available capture plant capacity:
• Flue gas flow (available feedstock) was extracted from the PI data, by using the boiler steam flow data and
the combustion design calculations to determine the theoretical amount of CO2 (kg/s) available for capture.
Some assumptions used for this calculation included a fully operational capture island, that 90% of the
produced CO2 could be captured, and that the boiler efficiency and fuel composition were consistent with
the boiler design parameters.
Fig.1. Fuel flow to boiler compared to steam generation Fig. 2. Flue gas CO2 mole fraction compared to steam generation
Occurrence of outages:GHGT-15 Janowczyk, Giannaris, Hill, Ruffini, Jacobs, Feng, Srisang, Bruce 5
• The hourly and daily operational data over the six-year period extracted from PI was analyzed and compared
to BD3’s daily status reports. Daily status reports are used to keep a chronological timeline of the power and
capture facility’s operations. Information, including any issues that may have been encountered, are recorded
in these reports. Superimposing the information from the daily status reports on the operational data from PI
resulted in a dataset describing the outages.
• Data analysis included flue gas flow estimation, CO2 mole fraction, CO2 emissions, maximum theoretical
amount of CO2 available for capture, and the actual amount of CO2 captured by the plant. This database was
used to determine the lost CO2 production through outages and derates due to flue gas availability and boiler
performance issues.
Capture production loss:
• The ratio of actual to theoretical maximum amount of CO2 captured was calculated. This value was presented
as a fraction of the maximum possible amount of CO 2 available for capture assuming maximum operating
capacity.
Equations 1 and 2 were used in this analysis.
CO2 Produced ∗ 90 (1)
Theoretical maximum amount of CO2 capture =
100
Capture production loss = Theoretical maximum amount of CO2 capture − Actual CO2 capture (2)
Steam and flue gas flow ratio:
• Correlations between steam flow data and flue gas flow data were established. This was used as a reference
to check the extracted operational data.
Data collection and analysis was extended to include maximum amine capacity calculated based on amine available
for CO2 capture and volumetric flow of the lean amine. The impacts of high sulphur dioxide (SO2) slip, foaming, and
plugging were also screened by using PI data. Furthermore, it was noted that compressor performance and dehydration
capacity is a cause of delayed start up after an outage. An annual evaluation of the outages and derates did not show a
consistent trend. In fact, the coal quality-based outages and derates were not stable over the six-year period. Around
60% of the derates can be explained by the analysis methods described in this paper.
5. Derate data compilation and analysis
After compiling and analyzing all the relevant operational data from PI (as described in Section 2), various patterns
emerged. Each system’s data was analyzed; causation relationships were established between each system and the
occurrence of derates. Thresholds were established indicating what scenario had to be reached before a certain system
resulted in a derate. These thresholds are summarized in Table 1.
Table 1. Summary of indicators and thresholds for establishing derates
Parameter Indicator logic unit
Flue gas flow available to
Steam flow is lower than < kg/s
capture island
Flue gas flow diverted to Diverter damper position less
< %
capture island thanGHGT-15 Janowczyk, Giannaris, Hill, Ruffini, Jacobs, Feng, Srisang, Bruce 6
Pre-scrubber demister
SO2 absorber pre-scrubber kPa
differential pressure is higher >
demister differential pressure
than
SO2 absorber amine demister Amine section differential kPa
>
section differential pressure pressure is higher than
SO2 absorber caustic demister Caustic section differential kPa
>
section differential pressure pressure is higher than
SO2 absorber amine Bed #2 Amine bed #2 differential kPa
>
section differential pressure pressure is higher than
CO2 absorber bed #1 inlet- Bed CO2 absorber differential kPa
>
#3 outlet differential pressure pressure is higher than
SO2 caustic wash section slip
Caustic wash section SO2 slip > ppm
is higher than
HX-104 SO2 stripper reboiler Steam/amine flow ratio in HX-
<
heat transfer 104 is lower than
CO2 MVR is off- CO2 TPD
CO2 MVR operation On/off ON/OFF
lost
SO2 MVR is off- CO2 TPD
SO2 MVR operation On/off ON/OFF
lost
Flue gas ash electrostatic
Electrostatic precipitator
precipitator cells A1, B1, A2, < mA
current
B2, A3, B3 operation
HX-103 SO2 lean rich heat SO2 rich amine HX-103 flow
< m3/h
exchanger rich amine flow is lower than
HX-103 SO2 lean rich heat Lean SO2 amine pump control
> %
exchanger lean amine flow output is higher than
CLR-209 CO2 lean amine trim CO2 lean amine trim cooler
< m3/h
cooler flow flow is lower than
A sum of pump control signal
P-216’s pump capacity vs for 216A, 216B and 216C is
> %
requirement higher than - assumption that
only 2 pumps operate.
A sum of level control pump
P-316’s pump capacity vs
control signal for 316A, 316B > %
requirement
and 316C is higher than
The logic analysis of the indicators and established thresholds yielded six primary sources attributed as the causes
of derates. These are summarized in Table 2.
Table 2. Conditions, logic and derate causes
Condition Indicator logic unit
Steam flow < kg/s
Flue gas available quantity low
Diverter damper < %
kPa
Pre-scrubber section >
kPa
High pre-scrubber and SO2 capture-gas SO2 Amine section >
kPa
side differential pressure Caustic section >
kPa
SO2 Bed #2 section >
High CO2 Capture – gas side differential CO2 absorber
>
(possibly amine foaming) differential pressure kPa
HX-104 steam flow < %
Amine SO2 Capture- liquid side ratio
HX-103 flow < m3/h
LCV-101 control > %
Caustic SO2 Capture- liquid side High SO2 Slip
> ppm
P-213 control > %
CO2 Capture- liquid side
P-216 control > %GHGT-15 Janowczyk, Giannaris, Hill, Ruffini, Jacobs, Feng, Srisang, Bruce 7
CLR-209 flow < m3/h
6. Analysis results
6.1 Outage and Derate Analysis
Results were analyzed and converted into graphical representations. Capture plant outages were summarized until
the end of December 2020 while derates were analyzed until the end of October 2020. The reductions in capture
capacity are multifactorial but the key contributors can be identified as:
• Fouling of demisters, heat exchangers and packing
• Amine degradation and foaming which is related to degradation products and limits both the flue gas flow rate
and mass transfer
During its first year of operation, BD3’s operational reliability was lower than expected. Efforts to address and
resolve these deficiencies have steadily improved operations since 2014. Two main efforts were achieved to improve
the performance of the plant while also addressing the observed deficiencies.
The first was made during the planned outage in the fall of 2015, when changes were made to mitigate fly ash
including upgrades to the electrostatic precipitators, additional wash systems on the demisters and the booster fan,
which helped both with capture derates and outages.
The capture facility reached its first milestone of one million tonnes of CO2 captured in July of 2016. A major
planned outage in the summer of 2017 rectified many of the design deficiencies which hindered the capture performance
of the facility in the initial years of operations. The outage in 2017 also included the installation of double block and
bleed isolations and redundant heat exchangers to allow for online maintenance. This eliminated the need of outages
for cleaning and helped maintain performance between outages, as observed in trends. The 2017 outage also included
installing additional spray systems to reduce fly ash and replacing the precipitator front field emitter wires which were
becoming a reliability issue. The amine degradation and associated foaming is an ongoing issue which is being
managed.
In 2018, the CCS facility captured a total of 625,996 tonnes – it was a big improvement compared to the previous
years. The overall availability of the plant in 2018 was 69 per cent; partly due to a powerful thunderstorm that caused
damage to the power plant. However, if we exclude the days when the CCS facility was available but offline due to
issues at the power plant and storm damage during 2018 the availability increases to 93 percent. These satisfying results
can be attributed to the improvements made during the 2017 planned maintenance outage.
The facility’s annual availability and major planned maintenance is shown in Fig. 3.GHGT-15 Janowczyk, Giannaris, Hill, Ruffini, Jacobs, Feng, Srisang, Bruce 8
Fig. 3. Performance of the BD3 carbon capture facility: reliability based on annual availability of
the capture facility from startup in October 2014 through October 2020
In 2019, the facility celebrated a significant milestone – a cumulative total of three million tonnes of CO 2 captured
and injected since startup. With stable operation achieved, the next focus for BD3 has become improving the efficiency
of operations and reducing costs.
The capture plant outages are summarized in Fig. 4. The cause for each plant outage is summarized from startup of
the capture plant through to the fall of 2020. The outage causes are then grouped under common occurrences to
determine the major drivers for the plant outages.GHGT-15 Janowczyk, Giannaris, Hill, Ruffini, Jacobs, Feng, Srisang, Bruce 9
Fig. 4 CCS plant outage hours by case (October 2014 – October 2020)
The sources of derates are summarized in Fig. 5. From this graph, various conclusions can be drawn. Overall the
derates showed an improving trend until 2017 when steps were taken to enable online maintenance which reduced the
need for maintenance outages. This has however resulted in longer run times and there is now an increasing trend for
accumulated derates. It should also be noted that the trends here are the hours for individual derate causes and as some
derates are eliminated new derate thresholds are reached with multiple concurrent derates causes.
In 2020 the leading causes of derates were fouling of the CO 2 lean rich heat exchangers and high pressure losses
through the CO2 absorber flue gas path. While online maintenance of the lean rich heat exchangers was enabled through
the upgrades in 2017, derates still occur due to declines in performance prior to online cleaning as well as during
cleaning activities. Later in 2021 the number of plates on the lean rich heat exchangers as well as the capacity of the
pumps to these heat exchangers will both be increased, providing a level of redundancy. The high absorber differential
pressures are the result of absorber packing fouling and also foaming of the amine. These pressure losses are being
addressed in 2021 through the replacement of fouled packing and with increased utilization of activated carbon and
antifoam treatments to mitigate foaming.
Fig. 5. Sources of derates (October 2014 – October 2020)
6.2 Capture plant’s operational history analysisGHGT-15 Janowczyk, Giannaris, Hill, Ruffini, Jacobs, Feng, Srisang, Bruce 10
The capture plant’s operational history was also analyzed and is summarized in Fig. 6. The graph indicates that the
capture plant’s on-line time has improved since start up. The major outages and hence the availability of the capture
facility in 2015 and 2017 were aligned with scheduled power plant maintenance outages. These outages had significant
impacts on the plant availability for those years. A significant portion of the time in 2018, 2019, and 2020 when the
capture plant was not in operation is attributed to outages of the power island and not the capture island, as illustrated
by outage causes in Figure 5.
Fig. 6. Summary of capture plant operational history (October 2014 – October 2020)
6.3 Capture rate analysis
In the first full year of operation, approximately 400,000 tonnes of CO 2 was captured, impeded by significant
technical and mechanical issues that were identified during this time. In the second year, lessons learned were applied
and BD3 captured 800,000 tonnes in the twelve months between November 2015 and October 2016. The maximum
rated capacity of the process was also tested. A capture rate of over 3200 tonnes per day (TPD) was achieved for a
three-day period.
Changes to the capture facility during the summer of 2017 resulted in rectification of several issues with the CCS
plant operations. The changes allowed for several operational issues to be addressed without shutting down the process.
While these significant modifications have improved the reliability of the plant, efforts to improve operational costs
continue. These efforts include activities that will increase efficiency and reduce future costs for the CCS process. In
January 2018, the capture facility was online and available 100 percent of the time and captured a total of 81,008 tonnes
of CO2. The plant met a milestone two million tonnes of CO2 captured in March of 2018. The cumulative capture
milestone of 3 million tonnes was achieved in November of 2019. The BD3 Project will continue to target the new
federal emission regulations which came into effect on January 1, 2020. Continued operations of the capture facility
will be based on cost effectiveness and efficiency. This analysis will provide additional information and help to make
decisions on retrofitting other coal units within SaskPower’s fleet. A summary of the capture rate including the average
daily capture rate for specified periods as well as the cumulative capture rate is depicted in Fig. 7.GHGT-15 Janowczyk, Giannaris, Hill, Ruffini, Jacobs, Feng, Srisang, Bruce 11
Fig. 7. Summary of the cumulative CO2 capture (October 2014 – October 2020)
7. Conclusion
The outage data collected along with the derate analysis helped to prioritize efforts in identifying the types of changes
necessary for improved capture plant operations. Further breakdown of the data within each category will highlight
the next level of the issues that need to be addressed, a continuous improvement process. It is also expected that other
issues will become apparent as the current issues have been mitigated.
The CCS story at BD3 is one of significant progress and inspiration for future CCS initiatives. Operations have
steadily improved in the most recent years of operation. The facility has resolved safety issues and is demonstrating a
level of reliability that is more consistent with a thermal-generating facility. With each year, more stable operation of
the plant is achieved, which helps the plant operations and support staff to focus on refining improvements in the
efficiency and cost effectiveness of the operation. This successful installation has paved the way for significant capital
and operating cost reductions paired with increased efficiencies to further improve the next generation of CCS
installations.
Operating a fully integrated commercial CO2 capture facility at a coal-fired power plant has provided knowledge
and understanding that will inform the next generation of CCS plants. Through the partnership between BHP and
SaskPower, that formed the International CCS Knowledge Centre, the learning from this project will be leveraged to
inform future CCS projects at power and industrial facilities throughout the world and will contribute to the acceleration
of the deployment of CCS as a means of combating climate change.
References
[1] Climate Change: Atmospheric Carbon Dioxide| NOAA Climate.gov
https://www.climate.gov/news-features/understanding-climate/climate-change-atmospheric-carbon-dioxide
[2] McCulloch, S. (2016). 20 Years of Carbon Capture and Storage: Accelerating Future Deployment. International
Energy Agency: Paris.GHGT-15 Janowczyk, Giannaris, Hill, Ruffini, Jacobs, Feng, Srisang, Bruce 12 [3] OSIsoft, L. L. C. (2014). PI System Manager I: Essential Skills. [4] Preston, C. K. (2015). Integrated Carbon Capture and Storage Project at SaskPower's Boundary Dam Power Station
You can also read