Temporal and spatial variation of hydrological condition in the Ziwu River Basin of the Han River in China - PIAHS
←
→
Page content transcription
If your browser does not render page correctly, please read the page content below
Innovative water resources management – understanding and balancing interactions between humankind and nature
Proc. IAHS, 379, 313–321, 2018
https://doi.org/10.5194/piahs-379-313-2018                                                                            Open Access
© Author(s) 2018. This work is distributed under
the Creative Commons Attribution 4.0 License.

        Temporal and spatial variation of hydrological condition
           in the Ziwu River Basin of the Han River in China
                    Ziyan Li1 , Dengfeng Liu1,2 , Qiang Huang1 , Tao Bai1 , Shuai Zhou1 , and Mu Lin3
        1 State
              Key Laboratory of Eco-hydraulics in Northwest Arid Region of China, School of Water Resources and
                       Hydropower Engineering, Xi’an University of Technology, Xi’an, 710048, China
                        2 Department of Land Resources and Environmental Sciences,

                                    Montana State University, Bozeman, MT 59717, USA
        3 School of statistics and Mathematics, Central University of Finance and Economics, Beijing 100081, China

                                    Correspondence: Dengfeng Liu (liudf@xaut.edu.cn)

              Received: 11 December 2017 – Revised: 5 March 2018 – Accepted: 12 March 2018 – Published: 5 June 2018

       Abstract. The middle route of South-To-North Water Diversion in China transfers water from the Han River
       and Han-To-Wei Water Diversion project of Shaanxi Province will transfer water from the Ziwu River, which
       is a tributary of the Han River. In order to gain a better understanding of future changes in the hydrological
       conditions within the Ziwu River basin, a Mann–Kendall (M–K) trend analysis is coupled with a persistence
       analysis using the rescaled range analysis (R/S) method. The future change in the hydrological characteristics of
       the Ziwu River basin is obtained by analysing the change of meteorological factors. The results show that, the
       future precipitation and potential evaporation are seasonal, and the spatial variation is significant. The proportion
       of basin area where the spring, summer, autumn and winter precipitation is predicted to continue increase is
       0.00, 100.00, 19.00 and 16.00 %, meanwhile, the proportion of basin area that will continue to decrease in the
       future respectively will be 100.00, 0.00, 81.00 and 74.00 %.The future potential evapotranspiration of the four
       seasons in the basin shows a decreasing trend. The future water supply situation in the spring and autumn of the
       Ziwu River basin will degrade, and the future water supply situation in the summer and winter will improve.
       In addition, the areas with the same water supply situation are relatively concentrated. The results will provide
       scientific basis for the planning and management of river basin water resources and socio-hydrological processes
       analysis.

1   Introduction                                                    at about 3 % (Zhang and Zhang, 2004). The seasonal varia-
                                                                    tion of precipitation will inevitably lead to differences in the
According to the Intergovernmental Panel Climate Change             temporal and spatial distribution of hydrological conditions,
report (IPCC, 2014), climate change acts as the driving fac-        and therefore it is very important to study the temporal and
tor of water cycle in hydrological processes and precipita-         spatial variation of hydrological condition in the basin of the
tion and evaporation are the main climatic factors affect-          climate change.
ing fresh water resources. The interaction of climate change           In the context of the growing shortage of water resources
with other factors has had irreversible negative impacts on         in the world, the impact of water resources in the chang-
the ecological and hydrological cycle of the basin. The Ziwu        ing environment has received widespread attention (Xia et
River basin, which is a tributary of the upper reach of the         al., 2015). In view of the study of changing environment,
Han River, is located in the warm humid and semi-humid cli-         domestic and foreign scholars mainly study the characteris-
mate region of the north subtropics. The precipitation in the       tics of river basin climate element change (Zhu et al., 2005;
river basin changes significantly between seasons. Summer           Chebana et al., 2013; Ma et al., 2012). Qiu et al. (2003) used
has the most precipitation, accounting for 46 % of the annual       the 20 cm caliber evaporator data from 123 meteorological
precipitation averaged across the basin, and winter the least

Published by Copernicus Publications on behalf of the International Association of Hydrological Sciences.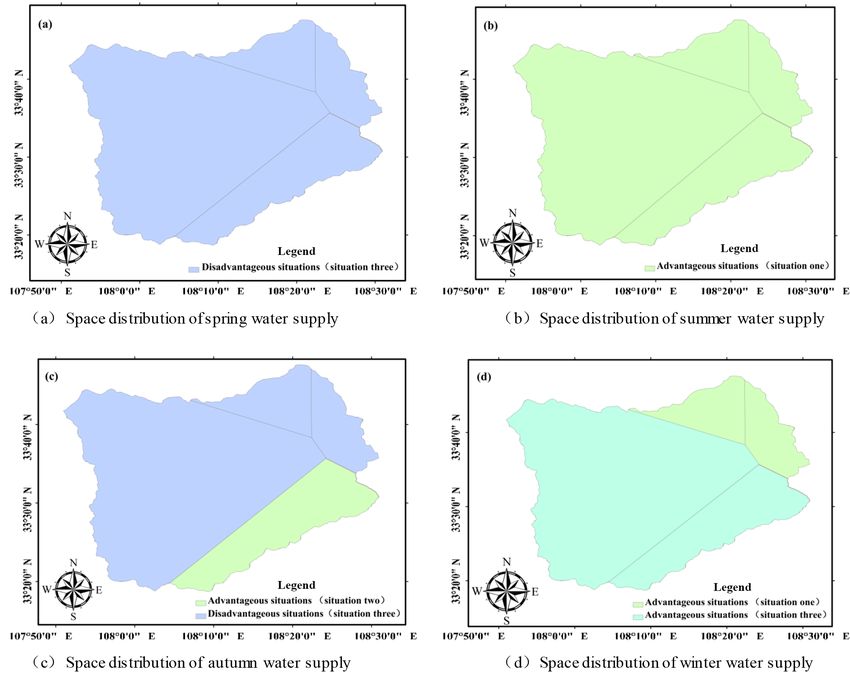
314                                                               L. Ziyan et al.: Hydrological condition in the Ziwu River Basin

stations in the Yellow River basin and its surrounding areas
from 1961 to 2000 to analyse the climatic trend of pan evap-
oration. The study found that the average annual temperature
of the Yellow River basin increased by 0.6 ◦ C during the pe-
riod from 1960 to 2000, but the evaporation of the evaporat-
ing pan showed a decreasing trend, especially during spring
and summer. Shi et al. (2006) established an exponential for-
mula for estimating evaporation capacity according to the re-
lationship between evaporation capacity and temperature in
the Yellow River basin, to analyse the influence of tempera-
ture change on the evaporation capacity. The results showed
that the basin evaporation capacity increased by 5.0–7.0 %
when the temperature increased by 1 ◦ C.
   Generally, the methods of M–K mutation point and trend
test, rescaled range analysis (R/S) and wavelet analysis are
used to analyse the change characteristics of climate el-
ements in the basin (Rzeszotko, 2012; Wallis and Mata-
                                                                     Figure 1. The location of the meteorological stations and the river
las, 1970). For the trend analysis of meteorological ele-
                                                                     network of Ziwu River.
ments, most scholars adopt the mature Mann–Kendall and
rescaled range analysis method (Whitfield and Hendrata,
2006; Polemio et al., 2008). Ling et al. (2011) tested the tem-      indicators set for determining the future change of regional
perature, precipitation and evaporation in the Manas River           meteorological elements and setting situations of regional fu-
basin for nearly 52 years and used the R/S analysis method           ture water supply. This will provide scientific basis for the
to predict the future trend. The results showed that the tem-        planning and management of river basin water resources and
perature and precipitation increased significantly from 1956         socio-hydrological processes analysis.
to 2007 and the evaporation is significantly reduced. Using
the R/S analysis method to test for long-range temporal de-
pendence in the data, Dinh and Molnr (1999) showed that the          2   Study area and data
R/S analysis method has good robustness. It can be seen that
in the time series, a trend has a significant influence on the       The Ziwu River, which is a tributary of the Han River,
estimated Hurst value. Using global inventory modeling and           originates in the south of the Qinling Mountain of Gangtie
mapping studies (GIMMS) data, Bisognin and Lopes (2007)              Town, Ningshan County, flows through Ningshan County,
selected three periods to study seasonal vegetation trends, re-      Shiquan County, Yangxian County and Xixiang County, and
sulting in a nonlinear variation in vegetation changes caused        enters into Han River at Xixiang County. In Fig. 1, the Wen-
by drought. Zhang et al. (2012) used R/S analysis to pre-            shui River above Sanhekou reservoir is 106 km, the Jiaoxi
dict the dynamic trend of future groundwater level in the            River is 70 km and the Pu River is 58 km. The basin area
Loess Platform area of Xingping City. The results show that          is 3028 km2 , and the altitude ranges from 360–2960 m. It is
the annual precipitation in Xingping decreases slightly, and         in the warm humid and semi-humid climate region of the
the quantity of irrigation water decreases significantly, which      north subtropics, where summer is warm and humid, winter
is consistent with the dynamic trend of groundwater level            is cold and dry and the spatial difference of seasonal precipi-
change in the same period. Previous studies have mostly an-          tation in the basin is significant. The average annual tempera-
alyzed the temporal and spatial evolution characteristics of         ture is between 7.7–15.7 ◦ C and annual average precipitation
the meteorological elements in the basin under the histori-          is 900 mm.
cal conditions, while there are relatively fewer studies of the         In this paper, the precipitation and potential evapotranspi-
impact of meteorological factors on the future hydrological          ration data of the four meteorological stations in the Ziwu
conditions of the basin.                                             River basin from 1960 to 2013 are used and the poten-
   In summary, this paper takes the Ziwu River basin of the          tial evaporation data are calculated by the Penman–Monteith
upper reach of the Han River as the study area. In order             formula revised by the Food and Agricultural Organization
to gain a better understanding of the temporal and spatial           (FAO). The Penman–Monteith formula is used to calculate
distribution of future water resources changes in the Ziwu           potential evaporation data because it considered the influ-
River basin, the Mann–Kendall (M–K) trend analysis method            ence of meteorological factors such as temperature, relative
is combined with a persistence analysis using the rescaled           humidity, sunshine hours and wind speed and it is also a com-
range analysis (R/S) method in this study. The temporal and          monly used formula for calculating the potential evaporation
spatial variation characteristics of precipitation and evapora-      in hydrological, meteorological and agriculture fields (Yang
tion trends and persistence in future is obtained by setting         et al., 2012).

Proc. IAHS, 379, 313–321, 2018                                                                         proc-iahs.net/379/313/2018/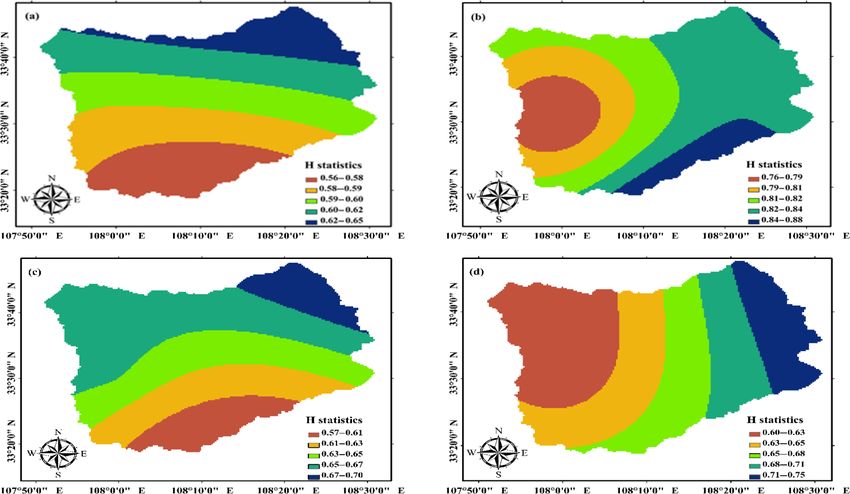
L. Ziyan et al.: Hydrological condition in the Ziwu River Basin 315
3 Methodology deal with hydrologic time series from the Nile (Hurst, 1951).
This method is used to quantitatively characterize the persis-
3.1 Mann–Kendall trend analysis tence or long-range dependency of a time series. The statistic
Hurst exponent can well reveal the relationship between the
The nonparametric M–K test (Mann, 1945; Kendall, 1975)
future and past trends of the time series so that future trend
has been commonly used to assess the significance of mono-
changes can be predicted based on the past trends of the time
tonic trends in meteorological and hydrological data time
series. Up until now, it has been widely applied to the qual-
series, but it can’t predict the future trend of the sequence
itative prediction of meteorological and hydrology time se-
(Hamed, 2008). Suppose a set of hydro-meteorological time
ries such as rainfall, evaporation and runoff. And the magni-
series X = (x1 , x2 , x3 ·, xn ) (n is the number of variables in
tude of the H value can be used to determine the strength of
the sequence), and then establish the standard normal distri-
persistence and anti-persistence of future trend components
bution statistic Z.
(Feng et al., 2008). The Hurst index rating table is showed in
The M–K test statistic (S) is calculated in the following
Table 1. Although the H value can show the trend of change,
Eqs. (1) and (2):
it can’t determine the actual historical trends. The Hurst ex-
+1; If xj > xi ponent calculation process is as follows:
sgn (xj − xi ) = 0; If xj = xi , (1) Suppose a set of hydro-meteorological time series {X(t)}
−1; If xj < xi (t is the number of variables in the sequence). For any pos-
itive integer (τ ≥ 1), the mean value series (X) is calculated
Xn−1 Xn in the following Eq. (5).
S= i=1 j =i+1
sgn (xj − xi ), (2)
1 Xn
X (τ ) = X(τ ) τ = 1, 2, · · ·, n, (5)
where xi and xj are the data values at times i and j , n indi- τ τ =1
cates the length of the data set. While a positive value of S
then the cumulative deviation can be calculated in the follow-
indicates an increasing trend, a negative of S indicates a de-
ing Eq. (6).
creasing trend. The following expression, as an assumption,
is used for the series where the data length n > 10 and data Xτ
X(t, τ ) = X (t) − X (τ ) 1 ≤ t ≤ τ. (6)
are approximately normally distributed (variance (σ 2 = 1) t=1
and mean (µ = 0) value). The range R (τ ) and standard deviation S (τ ) are calculated
in the following Eqs. (7) and (8) respectively.
n (n − 1) (2n + 5) − Pk=1 (tk − 1)(2tk + 5)
P
Var(S) = , (3)
18 R (τ ) = Max Min
1≤t≤τ X (t, τ ) − 1≤t≤τ X (t, τ ) (7)
in this equation,
P P is the number of tied groups, and the sum-
r
1 Xτ
mary sign ( ) indicates the summation over all tied groups. S (τ ) = t=1
[X (t) − X (τ )]2 . (8)
τ
tk is the number of data values in the “P th” group. If there
are not the tied groups, this summary process can be ignored. Therefore, the Hurst exponent can be expressed by follow-
After the calculation of the variance of time series data ing Eq. (9).
with Eq. (3), the standard Z value is calculated according to
R (τ )
the following Eq. (4). = (ατ )H , (9)
S −1 S(τ )
√ ; If S > 0 where α is constant and H is the Hurst index.
Va(S)
Z= 0; If S = 0 , (4) Eventually, the Hurst exponent is calculated in the follow-
S +1 ing Eq. (10). It can be obtained by logarithm of Eq. (9).
√
; If S < 0
Var(S)
R (τ )
H = ln (ln τ + ln α) . (10)
the changing trend of judging the standard: (1) If the statistics S (τ )
Z is greater than 0, the past trend is increase, on the contrary,
if the statistics Z is less than 0, the past trend is reduced; (2) if The criterion is as follows: if H value is greater than 0.50
the statistics Z is greater than or equal to 1.96, the trend is in- and less than 1, the variables are positively correlated and
crease significantly, on the contrary, if the statistics Z is less the trend of future changes is consistent with the past; the H
than or equal to −1.96, the trend is decrease significantly. value is closer to 1, the persistence is stronger. If H value
is greater than 0 and less than 0.50, the variables are nega-
tively correlated and the trend of future changes is opposite
3.2 Hurst Exponent
to the past; the H value is closer to 0, the anti-persistence is
The R/S analysis (Rescaled Range Analysis) is a statistical stronger. If H value is equal to 0.50, the time series is random
method proposed by Hurst, a British hydrologist in 1951 to and future trends have nothing to do with the past.
proc-iahs.net/379/313/2018/ Proc. IAHS, 379, 313–321, 2018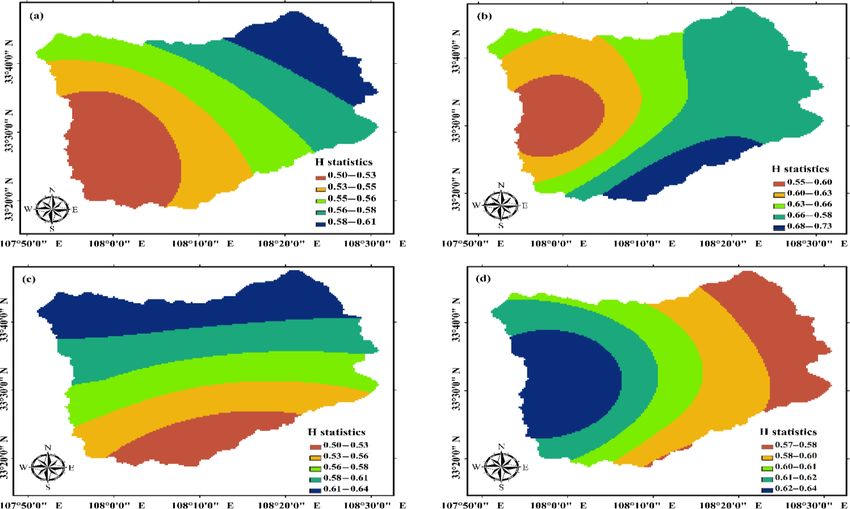
316 L. Ziyan et al.: Hydrological condition in the Ziwu River Basin
Table 1. Hurst index rating table.
grade the range of H value persistence strength grade the range of H value persistence strength
1 0.50 < H < 0.55 very weak 1 0.45 < H < 0.50 very weak
2 0.55 < H < 0.65 weak 2 0.35 < H < 0.45 weak
3 0.65 < H < 0.75 a little strong 3 0.25 < H < 0.35 a little strong
4 0.75 < H < 0.80 strong 4 0.20 < H < 0.25 strong
5 0.80 < H < 1.00 very strong 5 0.00 < H < 0.20 very strong
3.3 Discriminant analysis of hydrological condition The Mann–Kendall analysis method and R/S analysis
method is used to calculate the Z and H values of rainfall
Precipitation and evaporation are important links in the pro- statistics at each station.
cess of water cycle and also important indicators of the local Based on the water supply evaluation indicators, the future
hydrological conditions. Because the test method of Mann– water supply characteristics of the areas represented by each
Kendall and R/S are unable to independently obtain the past site are analysed.
and future trends of hydrological sequences, this paper uses Collect advantageous and disadvantageous sites for future
the method of Mann–Kendall test and R/S test coupled to de- water supply and calculate the area of advantageous or disad-
termine the indicators set for determining the future change vantageous area for future water supply in the basin by com-
of regional meteorological elements, which are shown in Ta- bining the area weights of advantageous or disadvantageous
ble 2. sites calculated in step (1) with Eq. (11):
Regional hydrological conditions are greatly influenced by X
evaporation and precipitation under natural conditions. If one Fadvantageous/disadvantageous = fi /F, (11)
of the following three situations can happen, the regional wa-
ter supply situation will improve in the future. In the situation where F is the total area of the river basin and fi is the area
one, the future regional precipitation increases and the evap- weights of advantageous or disadvantageous area for future
oration decreases. In the situation two, the trend of precip- water supply.
itation increase is greater than that of evaporation increase.
In the situation three, the trend of decrease in precipitation is 4 Results and analysis
smaller than that of evaporation reduction. If one of the fol-
lowing three situations can happen, the regional water supply 4.1 Analysis of tendency and sustainability of
situation will degrade in the future. In the situation one, the precipitation change
future regional precipitation decreases and the evaporation
increases. In the situation two, the trend of precipitation in- 4.1.1 Precipitation historical change trend
crease is smaller than that of evaporation increase. In the sit- The Mann–Kendall nonparametric test method is used to cal-
uation three, the trend of decrease in precipitation is greater culate past trends of precipitation for all 4 weather stations
than that of evaporation reduction. Scientifically and reason- considered in this study. The results shows that the propor-
ably evaluating the evolvement characteristics of the water tion of sites with decreasing trend respectively in spring,
supply situation in the future will have important practical summer, autumn and winter is 100.00, 0.00, 100.00 and
significance for the sustainable development of the regional 84.00 %, respectively, and the proportion of sites with in-
economy and society. This paper sets the situations of re- creasing trend in spring, summer, autumn and winter is 0.00,
gional future water supply, which are seen in Table 3. 100.00, 0.00 and 16.00 %, respectively. It can be seen from
Whether the future water supply situation will be advan- historical trends that the supply of water in spring and au-
tageous or disadvantageous depends on the relative differ- tumn is in a form of harshness and the water supply in sum-
ences in the change degree of precipitation and evaporation. mer is in a good form.
This paper considers a total of six situations of advantageous
(situation one, situation two and situation three) and disad-
4.1.2 Precipitation change sustainability
vantageous (situation one, situation two and situation three)
situations. The precipitation H statistic value of each weather station is
In summary, the advantageous/disadvantageous area for calculated by the R/S analysis method, and spatial interpo-
future water supply in the river basin is calculated as follows: lation is carried out by kriging interpolation method based
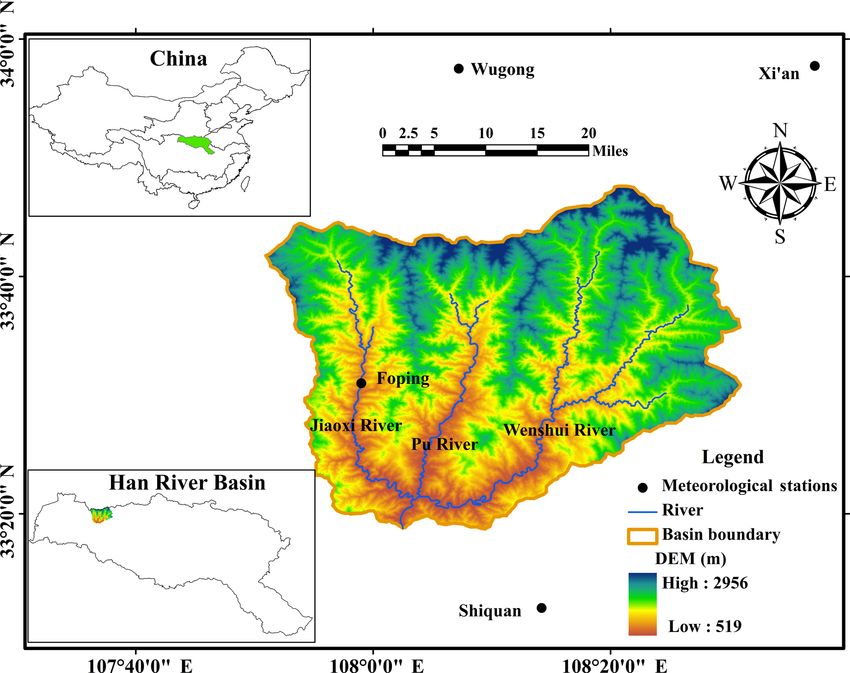
The Thiessen polygon method is used to calculate the area on the ArcGIS environment. The result is shown in Fig. 2.
weights fi of basin features represented by the meteorolog- According to Fig. 2, the H values of the four seasons are
ical stations in the river basin and calculate the area repre- mainly concentrated in the range of 0.50–0.75 and the pre-
sented by each station. cipitation H value is significantly different in the spatial dis-
Proc. IAHS, 379, 313–321, 2018 proc-iahs.net/379/313/2018/L. Ziyan et al.: Hydrological condition in the Ziwu River Basin 317
Table 2. Indicators set for determining the future change of regional meteorological elements.
Z Hurst value variation characteristics of meteorological elements
Z ≤ −1.96 H > 0.50 The trend of reduction in past is significant, and it will continue to decrease in the future.
Z ≤ −1.96 H < 0.50 The trend of reduction in past is significant, but it is likely to reverse in the future.
−1.96 < Z ≤ 0 H > 0.50 The trend of reduction in past is not significant, and it will continue to decrease in the future.
−1.96 < Z ≤ 0 H < 0.50 The trend of reduction in past is not significant, but it is likely to reverse in the future.
0 < Z ≤ 1.96 H > 0.50 The trend of increase in past is not significant, and it will continue to increase in the future.
0 < Z ≤ 1.96 H < 0.50 The trend of increase in past is not significant, but it is likely to reverse in the future.
Z > 1.96 H > 0.50 The trend of increase in past is significant, and it will continue to increase in the future.
Z > 1.96 H < 0.50 The trend of increase in past is significant, but it is likely to reverse in the future.
Table 3. Situations of regional future water supply.
future water
supply situation situation state of water resources statistical reflection Z and H
advantage situation one precipitation increases Zprecipitation > 0, Hprecipitation > 0.5
and the evaporation decreases and Zevaporation < 0, Hevaporation > 0.5
situation two the trend of precipitation increase is |Z|precipitation > |Z|evaporation ,
greater than that of evaporation increase and Hprecipitation > 0.5, Hevaporation > 0.5
situation three the trend of decrease in precipitation |Z|precipitation < |Z|evaporation ,
is smaller than that of evaporation reduction and Hprecipitation > 0.5, Hevaporation > 0.5
disadvantage situation one precipitation decreases Zprecipitation < 0, Hprecipitation > 0.5
and the evaporation increases and Zevaporation > 0, Hevaporation > 0.5
situation two the trend of precipitation increase |Z|precipitation < |Z|evaporation ,
is smaller than that of evaporation increase and Hprecipitation > 0.5, Hevaporation > 0.5
situation three the trend of decrease in precipitation |Z|precipitation > |Z|evaporation ,
is greater than that of evaporation reduction and Hprecipitation > 0.5, Hevaporation > 0.5
tribution. The spatial distribution trend of the H value in the 100.00, 19.00 and 16.00 %, corresponding to the average an-
four seasons is as follows: In spring, the H value of precip- nual precipitation of 0.00, 360.60, 279.69 and 21.15 mm, re-
itation gradually increases from southwest to northeast, that spectively; The proportion of basin area that will continue to
is to say, the intensity of future sustainability gradually in- decrease in the future respectively will be 100.00, 0.00, 81.00
creases from southwest to northeast; In summer, the H value and 74.00 %, corresponding to the average annual precipita-
of precipitation is the smallest in the northwest local region tion of 161.02, 0.00, 308.43 and 27.44 mm, respectively. The
and it is very large in the southeast part; In autumn, the H proportion of area where precipitation will be reversed in the
value of precipitation increases from south to north, that is to future will be smaller in the seasonal scale.
say, the intensity of future sustainability gradually increases
from south to north; In winter, the H value of precipitation
gradually increases from west to east, that is to say, the inten-
sity of future sustainability gradually increases from west to
east. Each season has a strong sustainability and regularity, 4.2 Analysis of tendency and sustainability of potential
which is conducive to the study of future water supply and evaporation change
development.
4.2.1 Potential evaporation historical change trend
4.1.3 Precipitation trends in the future
The Mann–Kendall nonparametric test method is used to cal-
The results of the trend of future precipitation in the Ziwu culate past trends of potential evaporation in all weather sta-
River basin with time are shown in Table 4. The propor- tions in the basin. In theory, the reduction of potential evap-
tion of basin area where the spring, summer, autumn and oration is conducive to the change of water supply at all sea-
winter precipitation is predicted to continue increase is 0.00, sons from poor to favorable trend.
proc-iahs.net/379/313/2018/ Proc. IAHS, 379, 313–321, 2018318 L. Ziyan et al.: Hydrological condition in the Ziwu River Basin
Figure 2. Spatial distribution of H value of precipitation in the four seasons (a) spring (b) summer (c) autumn (d) winter.
Table 4. Changes of the future precipitation trend in the Ziwu River basin.
future trend of increase future trend of decrease future trend reverse as increase future trend reverse as
decrease
season (Z > 0, H > 0.5) (Z < 0, H > 0.5) (Z < 0, H < 0.5) (Z > 0, H < 0.5)
proportion of historical av- proportion of historical av- proportion of historical av- proportion of historical av-
occupied area erage annual occupied area erage annual occupied area erage annual occupied area erage annual
precipitation precipitation precipitation precipitation
% mm % mm % mm % mm
spring 0.00 0.00 100.00 161.02 0.00 0.00 0.00 0.00
summer 100.00 360.60 0.00 0.00 0.00 0.00 0.00 0.00
autumn 0.00 0.00 81.00 308.43 19.00 279.69 0.00 0.00
winter 16.00 21.15 74.00 27.44 0.00 0.00 0.00 0.00
4.2.2 Potential evaporation change sustainability 4.2.3 Potential evaporation trends in the future
The potential evaporation H statistic value of each weather
station was calculated by the R/S analysis method and spatial
interpolation was carried out by kriging interpolation method The results of a comprehensive analysis of potential evapora-
based on the ArcGIS environment. The result is shown in tion past trends (Mann–Kendall test) and future sustainabil-
Fig. 3. According to Fig. 3, the spatial distribution of po- ity (R/S test) are shown in Table 5. The results show that the
tential evaporation H is significantly different. The poten- potential evapotranspiration of the four seasons in the basin
tial evaporation in summer is the largest, even in some areas shows a decreasing trend. The historical potential evapotran-
reached 0.88; it in winter take second place; and it in spring spiration in spring, summer, autumn and winter respectively
is the smallest. Each season has a strong sustainability and are 246.40, 354.68, 150.45 and 89.40 mm, which indicates
regularity, which is conducive to the study of future water that the basin will be humid in the future and is beneficial to
supply and development. the sustainable development of the local water resources.
Proc. IAHS, 379, 313–321, 2018 proc-iahs.net/379/313/2018/L. Ziyan et al.: Hydrological condition in the Ziwu River Basin 319
Figure 3. Spatial distribution of H value of potential evaporation in the four seasons (a) spring (b) summer (c) autumn (d) winter.
Table 5. Changes of the future potential evaporation trend in the Ziwu River basin.
future trend of increase future trend of decrease future trend reverse as increase future trend reverse as
decrease
season (Z > 0, H > 0.5) (Z < 0, H > 0.5) (Z < 0, H < 0.5) (Z > 0, H < 0.5)
proportion of historical av- proportion of historical av- proportion of historical av- proportion of historical av-
occupied area erage annual occupied area erage annual occupied area erage annual occupied area erage annual
precipitation precipitation precipitation precipitation
% mm % mm % mm % mm
spring 0.00 0.00 100.00 246.40 0.00 0.00 0.00 0.00
summer 0.00 0.00 0.00 354.68 0.00 0.00 0.00 0.00
autumn 0.00 0.00 81.00 150.45 19.00 148.83 0.00 0.00
winter 0.00 0.00 100.00 89.40 0.00 0.00 0.00 0.00
4.3 Variation characteristics of future hydrological area which is 19 % in the southeast. These indicate that the
conditions in the basin future water supply is severe and are not conducive to the
good development of regional hydrological conditions.
According to the trend of precipitation and evaporation in The area of water supply in spring, summer, autumn and
the future, the precipitation and evaporation in the basin winter good areas respectively account for 0.00, 100.00,
have seasonal variation, which lays a good foundation for 19.00 and 100.00 %. The summer water supply is situation
the study of the future hydrological conditions of the basin. one and the contradiction between supply and demand of wa-
Table 6 and Fig. 4 show that the future water supply situation ter resources will be eased in the season; The water supply in
of the basin is severe (disadvantageous) and good (advanta- autumn is situation two, which mainly distribute in some ar-
geous) in regional spatial and temporal distribution. eas of the southeast of the basin; The water supply in winter
The results show that: the area of severe water supply in are situation one and three. The trend of decreasing precipi-
spring, summer, autumn and winter respectively are 100.00, tation is less than that of potential evaporation in most areas
0.00, 81.00 and 0.00 %. The future of the water supply in the of the river basin, and the contradiction between the future
spring and autumn is predicted to be more limited than in water supply in summer and winter will be alleviated.
the past. The trend of decreasing precipitation in spring and To sum up, the water supply in the future will be severe in
autumn is greater than that in potential evaporation, and most spring and autumn, and the water supply in the future will be
of the water supply in the autumn basin is severe excluding
proc-iahs.net/379/313/2018/ Proc. IAHS, 379, 313–321, 2018320 L. Ziyan et al.: Hydrological condition in the Ziwu River Basin
Table 6. Changes of future water supply characteristics of the basin.
advantageous situation proportion % disadvantageous situation proportion %
season
Situation one Situation two Situation three Situation one Situation two Situation three
spring 0.00 0.00 0.00 0.00 0.00 100.00
summer 100.00 0.00 0.00 0.00 0.00 0.00
autumn 0.00 19.00 0.00 0.00 0.00 81.00
winter 16.00 0.00 84.00 0.00 0.00 0.00
Figure 4. Spatial distribution of future water supply in the basin.
good in summer and winter, especially in the summer with a The future precipitation and potential evaporation are sea-
good space for development which precipitation will increase sonal, and the spatial variation is significant. In addition, the
and evaporation will decrease. areas with the same water supply situation are relatively con-
centrated. The proportion of basin area where the spring,
summer, autumn and winter precipitation is predicted to con-
tinue increase is 0.00, 100.00, 19.00 and 16.00 %, mean-
5 Conclusions while, the proportion of basin area that will continue to de-
crease in the future respectively will be 100.00, 0.00, 81.00
In this paper, the Mann–Kendall non-parametric test and R/S and 74.00 %.The future potential evapotranspiration of the
test methods were combined to analyse the historical trend four seasons in the basin shows a decreasing trend.
and future trend of precipitation and potential evaporation The area of water supply in spring, summer, autumn and
in the river basin. After combining the characteristics of fu- winter good areas respectively account for 0.00, 100.00,
ture hydrological conditions, the following conclusions are 19.00 and 100.00 % and the area of severe water supply in
obtained:
Proc. IAHS, 379, 313–321, 2018 proc-iahs.net/379/313/2018/L. Ziyan et al.: Hydrological condition in the Ziwu River Basin 321
spring, summer, autumn and winter respectively are 100.00, Hurst, H. E.: Long term storage capacities of reservoirs, Trans. Am.
0.00, 81.00 and 0.00 %. The future water supply in the spring Soc. Civil Eng., 116, 776–808, 1951.
and autumn of the Ziwu River basin will be severe, and the IPCC: Synthesis Report, Contribution of Working Groups I, II and
future water supply in the summer and winter will be better, III to the Fifth Assessment Report of the Intergovernmental Panel
especially in the summer. on Climate Change, edited by: Core Writing Team, Pachauri, R.
K., and Meyer, L. A., Geneva, Switzerland, 151 pp., 2014.
Kendall, M. G.: Rank Correlation Methods, M, 4th ed, Charles Grif-
fin, London, 1975.
Data availability. The meteorological data in the paper are pro-
Ling, H. B., Xu, H. L., Zhang, Q. Q., and Shi, W.: Climate
vided by China Meteorological Data Service Center, from their web
Change in the Manas River Basin, Xinjiang during 1956–2007,
site at http://data.cma.cn/en.
J. Glaciol. Geocryol., 33, 64–71, 2011.
Ma, X. N., Zhang, M. J., Huang, X. Y., Ma, Q., and Pan, S. K.: Char-
acteristics of climate change and future trend in the upper Yellow
Competing interests. The authors declare that they have no con- River basin from 1960 to 2008, Arid Land Resour. Environ., 26,
flict of interest. 17–23, https://doi.org/10.13448/j.cnki.jalre.2012.06.029, 2012.
Mann, H. B.: Nonparametric tests against trend, J. Econometrica,
13, 245–259, 1945.
Special issue statement. This article is part of the special issue Polemio, M., Casarano, D., Dragoni, W., and Sukhija, B. S.: Cli-
“Innovative water resources management – understanding and bal- mate change, drought and groundwater availability in south-
ancing interactions between humankind and nature”. It is a result of ern Italy, Geol. Soc. London Special Pub., 288, 39–51,
the 8th International Water Resources Management Conference of https://doi.org/10.1144/SP288.4, 2008.
ICWRS, Beijing, China, 13–15 June 2018. Qiu, X. F., Liu, C. M., and Zeng, Y.: Changes of pan evaporation in
the recent 40 years over the Yellow River Basin, J. Nat. Res., 18,
437–442, 2003.
Acknowledgements. This work was partially supported by Rzeszotko, Z.: Estimation of the Hurst exponent for market indices
National Key R&D Program of China (2017YFC0405900) and by use of rescaled range method and CAS Mathematica. Case
National Natural Science Foundation of China (NSFC) (Grant study: S&P500, Electro. J. Mathe. Technol., 6, 256–267, 2012.
No. 51779203, 51609270, 41330858). Funding was also provided Shi, Z. H., Wang, G. Q., Yv, H., Jiang, Y. F., Jin, X. A., and
by the Basic Research Plan of Natural Science of Shaanxi Province Li, H. B.: Impact of Temperature change on Potential Evapo-
(2016JQ5105). The authors would like to thank Andreas Schumann ration in Yellow River Basin, Meteorol. J. of Henan, 1, 31–32,
and the anonymous reviewers for their comments to improve the https://doi.org/10.3969/j.issn.1673-7148.2006.01.015, 2006.
paper. Wallis, J. R. and Matalas, N. C.: Small Sample Properties of H and
K Estimators of the Hurst Coefficient h, Water Resour. Res., 6,
Edited by: Andreas Schumann 1583–1594, 1970.
Reviewed by: two anonymous referees Whitfield, P. H. and Hendrata, M.: Assessing Detectability of
Change in Low Flows in Future Climates from Stage Dis-
charge Measurements, Canadian Water Res. J., 31, 1–12,
https://doi.org/10.4296/cwrj3101001, 2006.
References
Xia, J., Shi, W., Luo, X., Hong, S., Ning, L., and Chiristopher,
J. G.: Revisions on water resources vulnerability and adaption
Bisognin, C. and Lopes, S. R. C.: Estimating and forecasting the
measures under climate change, J. Adv. Water Sci., 26, 279–286,
long-memory parameter in the presence of periodicity, J. Fore-
https://doi.org/10.14042/j.cnki.32.1309.2015.02.019, 2015.
cast., 26, 405–427, https://doi.org/10.1002/for.1030, 2007.
Yang, H. B., Lv, H. F., Yang, D. W., and Hu, Q. F.: Seasonality of
Chebana, F., Ouarda, T. B. M. J., and Duong, T. C.: Testing for mul-
precipitation and potential evaporation and its impact on catch-
tivariate trends in hydrologic frequency analysis, J. Hydrol., 486,
ment water-energy balance, J. Hydroelec. Eng., 31, 54–59, 2012.
519–530, https://doi.org/10.1016/j.jhydrol.2013.01.007, 2013.
Zhang, K. and Zhang, S. T.: Analyses of “02.6” Ziwu River Ex-
China Meteorological Data Service Center: available at: http://data.
traordinary Flood in South of Shaanxi Province, J. Water Resour.
cma.cn/en (last access: 21 May 2017), 2017.
Archit. Eng., 2, 54–56, 2004.
Dang, T. D. and Molnr, S.: On the effects of non-stationarity in
Zhang, Y. Q., Hu, W., and Liu, J. M.: Groundwater level regime
long-range dependence tests, Periodica Polytechnica Ser.el.eng,
variation trend on basis of rescaled range analysis, J. Central
43, 227–250, 1999.
South Univ., 43, 4912–4916, 2012.
Feng, X. L., Feng, Z. L., Luo, L. C., Qin, L. L., and Lin, P.:
Zhu, H. H., Qin, D. Y., Zhou, Z. H., Yan, D. H., and Yang, G. Y.:
R/S analysis and Hurst exponential test of climate change trend
Study on Precipitation Evolution Law of the Yellow River Basin,
of Qinghai-Tibet Plateau, J. Arid Land Geogr., 31, 175–181,
J. Yellow River, 27, 21–24, 2005.
https://doi.org/10.13826/j.cnki.cn65-1103/x.2008.02.002, 2008.
Hamed, K. H.: Trend detection in hydrologic data: The Mann–
Kendall trend test under the scaling hypothesis, J. Hydrol., 349,
350–363, https://doi.org/10.1016/j.jhydrol.2007.11.009, 2008.
proc-iahs.net/379/313/2018/ Proc. IAHS, 379, 313–321, 2018You can also read