Soil water retention curve and permeability function of the para rubber biopolymer treated sand - ThaiJO
←
→
Page content transcription
If your browser does not render page correctly, please read the page content below
Interdisciplinary
             Research Review
Volume 15, Number 5, Pages 1 – 7

  Soil water retention curve and permeability function of the para rubber
                          biopolymer treated sand

                         Arun Lukjan∗ , Arsit Iyaruk, and Chumnong Petchprakob
  Department of Civil Engineering, Faculty of Engineering, Rajamangala University of Technology Srivijaya, Songkhla, Thailand

                                                         Abstract
Unsaturated flow phenomena impact all the geotechnical engineering applications. Requirements the understanding include
seepage, shear strength, and volume change behaviors of unsaturated soil are important. Since several researchers have put
efforts to conduct a potential of biopolymer for soil improvement for the last decade. This paper aimed to conduct a compre-
hensive experimental study on soil water retention curve (SWRC) and a permeability function prediction of para rubber (PR)
biopolymer treated sand. Sand-para rubber (SPR) mixtures were prepared with sand being the base material and with different
PR contents (15%, 17.5%, 20%, and 22.5%). A series of laboratory tests were conducted including the filter paper method
and falling head test. The results showed that the wetting SWRC of the four SPR mixtures is significantly different compared
with untreated sand which tends to give a higher value of saturated volumetric water content and water entry suction. The
permeability test result displayed that the values of saturated hydraulic conductivity decreased with increasing PR content. The
shape of the unsaturated hydraulic conductivity curve is quite similar for all SPR mixtures but values vary in three orders of
magnitudes compared with a value of untreated sand. This experimental study showed the remarkable effectiveness of the in
the wetting SWRC shape and hydraulic conductivity function of the poorly graded sand. The results also indicated that the para
rubber significantly influenced on the pore size distribution of the SPR mixtures.

Keywords: para rubber, soil suction, water content, hydraulic conductivity, biopolymer
                                Article history: Received 5 May 2020, Revised 10 August 2020, Accepted 10 August 2020

1. Introduction                                                    shear strength characteristic [4-6], mitigating seismic-
                                                                   induced liquefaction [7], erosion resistance [8-9], and
   The majority of geotechnical engineering applica-               decreased hydraulic conductivity [10-11] of granular
tions occur in the vadose zone. Unsaturated soil ap-               soil.
plications include foundations, excavation, landslide,                Natural rubber latex (herein referred to para rubber,
compacted soil, and contaminant migration [1]. Since               PR), an elastomer that was originally derived from the
the main aims of ground improvement can be sum-                    sap of para rubber plant, has been successfully used
marized as follows: to increase bearing capacity, de-              as a civil engineering material. An advantage property
crease settlement, control shrinking and swelling, con-            of para rubber comprises excellent dynamic properties
trol permeability, and reduce susceptibility to lique-             with a low hysteresis loss, good low-temperature prop-
faction [2]. While, the unsaturated soil problems                  erties, strong bonding, and high resistance to tear and
require the understanding of broad behavior include                abrasion. For geotechnical engineering works, many
seepage, shear strength, and volume change behav-                  efforts on investigating a potential of PR used as an
iors. The last decade has seen significant growth of               admixture in soil improvement have been carried out
research on biopolymer (e.g., starch, beta-glucan, xan-            on shear strength behavior [12], mechanical proper-
than gum, gellan gum, agar, polyacrylamide, and guar               ties of geosynthetic clay liner [13], para rubber soil-
gum) application to geotechnical engineering, espe-                cement road [14], and drought relieving water pond
cially for soil stability and improvement purposes [3].            [15]. These study results suggest the potential utility
Researchers have found that biopolymers are an al-                 of PR as a cementation material for geotechnical en-
ternative to conventional construction materials and               gineering purposes. Nevertheless, the previous studies
soil stabilization. For instance, that can enhance the             did not explore associate with unsaturated soil context.
                                                                      The constitutive relationship between water content
                                                                   or degree of saturation and matric suction of unsatu-
   ∗ Corresponding   author; email: federun9@gmail.com             rated soil represents by the soil water retention curve
2 Vol. 15 No. 5 September – October 2020
Figure 2: Materials used in this experiment; (a) sand and (b) para
rubber.
2. Materials and Methods
2.1 Materials
2.1.1 Sand
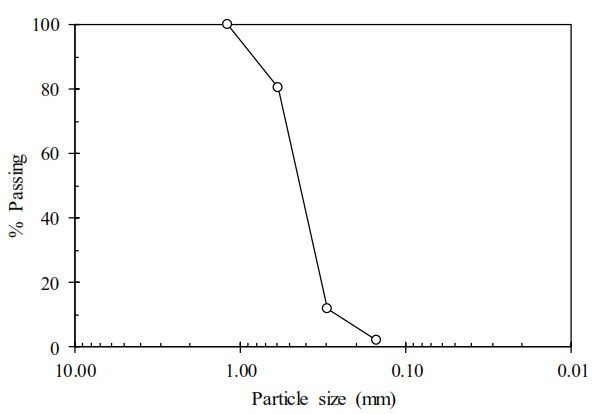
The sample of sand used in this study (Fig. 2a) was
collected from the Songkhla Province area, Southern
Thailand. The grain size distribution curve of sand
is displayed in Fig. 3. The particle size ranged from
Figure 1: Typical (a) SWRC and (b) unsaturated hydraulic conduc-
tivity function. 0.150 to 1.200mm. Sand is classified as poorly graded
sand (SP) according to USCS classification. The co-
efficient of uniformity (Cu ), coefficient of curvature
(Cc ), specific gravity (Gs ), effective grain size (D10 ),
and other soil properties are presented in Table 1.
(SWRC). SWRC is also referred to as soil water char- Table 1. Physical and mechanical properties of sand used in this
experiment.
acteristic curve or capillary pressure curves. While
in unsaturated soil, hydraulic conductivity is the most Properties Value
crucial parameter which affected on flow process in Specific gravity, Gs 2.640
this zone. Fig. 1a illustrates a typical SWRC that in- D10 (mm) 0.260
cludes drying (desorption) and wetting (adsorption) D50 (mm) 0.430
processes associated with unsaturated hydraulic con- D60 (mm) 0.480
Coefficient of uniformity, Cu 1.846
ductivity varies with soil suction as shown in Fig. 1b.
Coefficient of curvature, Cc 1.068
There are various devices and techniques for measur-
Minimum void ratio, emin 0.640
ing soil suction of unsaturated soils, among which the Maximum void ratio, emax 0.880
filter paper (FP) method is relatively uncomplicated Minimum dry density, ρdmin (g/cm3 ) 1.399
and economical. The FP method has also been used Maximum dry density, ρdmax (g/cm3 ) 1.603
in geotechnical engineering applications by several re- Soil type (USCS) Poorly graded sand (SP)
searchers which showed a reliable soil suction mea-
surement. For example, shear modulus behavior of
compacted lateritic soil [16], shear strength of an ex- 2.1.2 Para rubber
pansive soil by combining the PF method and direct Para rubber latex (Fig. 2b) is a stable colloidal dis-
shear tests [17], compacted subgrade soil [18], and persion of polymeric materials in an aqueous medium
compacted loess soil [19]. and that is commercially available [22]. High am-
monia centrifuged latex was used in this study with
Thus, the objective of this paper is to investigate ammonia content of 0.700%. The significant physic-
on the SWRC and permeability function prediction of ochemical parameters (Table 2) comprise dry rub-
four sand-para rubber (SPR) mixtures. A series of lab- ber content (DRC) of 60.050%, total solid content
oratory tests including the FP method and falling head (TSC) of 61.730%, volatile fatty acid (VFA) number
test is conducted. Wetting SWRC was tested and best- of 0.024, alkalinity, potassium hydroxide (KOH) num-
fitted using the Fredlund and Xing (1994) [20] equa- ber of 0.645, a viscosity of 59.200 centipoises, and
tion and unsaturated hydraulic conductivity of the SPR specific gravity (at 25◦ C) of 0.945.
mixtures was estimated using the equation of Fredlund
et al. (1994) [21]. Finally, the fitting parameters ob- 2.2 Experiment program
tained and the PR affected by sand characteristics have A report of Lukjan et al. (2019) [12] indicated that
been discussed. a PR content about 18% by weight of dry sand yields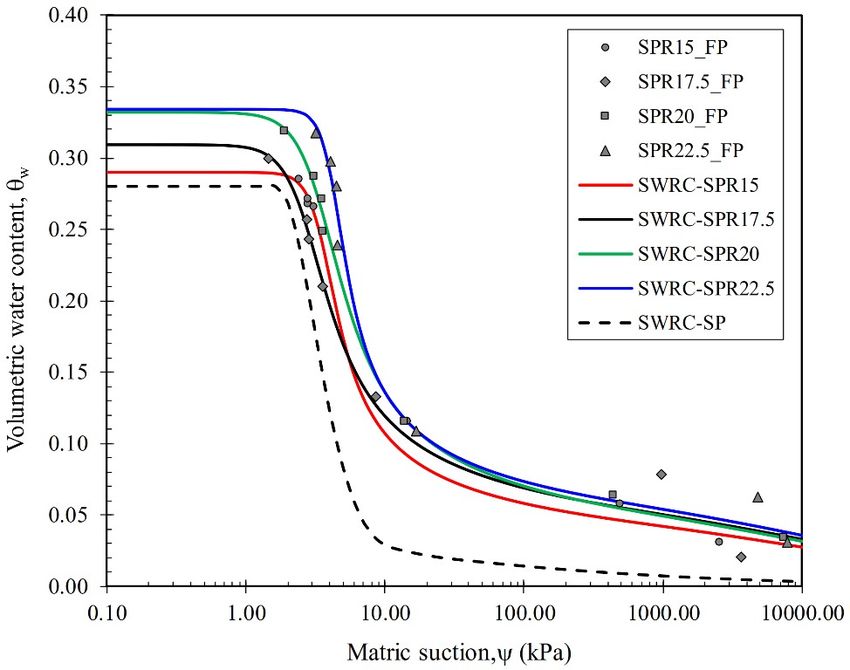
Interdisciplinary Research Review 3
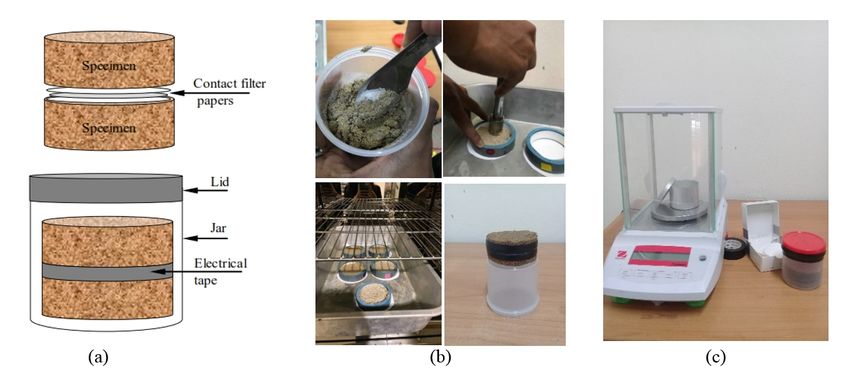
at room temperature; (4) wetted by spraying water on
the dried SPR specimens to achieve a series of a tar-
geted degree of saturation approximately 10% to 90%;
(5) sealed inside plastic jars at 25 ◦ C room for 48 h to
ensure the moisture equalization and; (6) conducted
following the filter paper method procedure according
to ASTM D5298-03 [24]. This study, 55mm diameter
of Whatman Grade 42 filter paper is used to measure
the matric suction (direct-contact method). Left the
SPR samples for 10 days to ensure a thorough equilib-
rium. Finally, the matric suction value is derived from
the ASTM calibrated water retention curve of the filter
paper and then the volumetric water content of the soil
Figure 3: Grain size distribution curve of the poorly graded sand. is calculated by the Eq. (1). Fig. 4 demonstrate the
procedures of the FP method.
an optimum content which improved shear strength of θw = w (ρd /ρw ) (1)
the poorly graded sand. Therefore, sand-para rubber
(SPR) mixture of four mix proportions was prepared where θw = the volumetric water content of soil; w =
in this experiment. In preparation for wetting SWRC gravimetric water content of soil; ρd = dry density of
and permeability tests, sand was oven-dried at 105 ◦ C soil; and ρw = density of water (1 g/cm3 ).
for 24 h before mixing with PR. Four SPR mixtures
include SPR15, SPR17.5, SPR20, and SPR22.5 corre- 2.2.2 Soil permeability test
sponding to the PR content of 15, 17.5, 20, and 22.5% The specimens used for the permeability test were
by weight of dry sand, respectively (Table 3). Soil suc- separated into 2 groups, namely: (i) the pure sand for
tion measurement and permeability tests are described the constant head test according to ASTM D2434 [25]
as following. and (ii) the SPR samples for falling head test accord-
ing to ASTM D5084 [26]. Only the procedure of the
Table 2. Physicochemical parameters of para rubber. test for SPR samples was described in this paper. The
Properties Value SPR specimen preparation and falling head test consist
Dry rubber content, DRC (%) 60.050 of 5 main steps: (1) mixed sand with PR by a ratio as
Total solid content, TSC (%) 61.730 well as the FP method; (2) each mixed, contained the
Ammonia content (%) 0.700 sample that divides into two layers in a cylinder mold
Volatile fatty acid number, VFA 0.024 of 70 mm in diameter and 75 mm in height and tamped
KOH number 0.645 with tamping rod of 25 blows/layer; (3) oven-dried at
Viscosity (cps.) 59.200 105 ◦ C for 48 h and then allowed to cool at room tem-
Specific gravity at 25 ◦ C 0.945 perature; (4) soaked at room temperature in a water
bath for 48 h to ensured saturation; (5) tested follow-
ing ASTM standard method and calculated saturated
Table 3. Description of sand-para rubber (SPR) mixtures used in hydraulic conductivity. Fig. 5 represents the falling
this experiment.
head test procedures of the SPR specimens.
PR content Initial Dry density
Mixtures
(%) (g/cm3 ) 2.3 Fitting of the SWRC data
SPR15 15 1.441 Among all the existing SWRC equations, Fredlund
SPR17.5 17.5 1.520 and Xing equation has been suggested by Leong and
SPR20 20 1.544 Rahardjo (1997) [27] which cover a wide range of
SPR22.5 22.5 1.460
soils over the entire range of matric suction. There-
fore, the Fredlund and Xing’s equation in SEEP/W
numerical software [28] was adopted in this study to
2.2.1 Soil suction measurement characterize the SWRC of the SPR samples. Eq. (2)
The sample high affected in the SWRC test was sug- present the Fredlund and Xing (1994) [20] equation
gested by Silva et al. (2018) [23] which recommended for SWRC.
using soil samples not more than 25 mm. Therefore, "
ln(1 + ψ/ψr )
#"
1
#
the tests were performed with a sample of 60.500mm θw = θ s 1 − (2)
ln(1 + 106 /ψr ) {ln[e + (ψ/a)n ]}m
diameter and 12.500mm height. The preparation pro-
cess of the SPR specimens comprised: (1) weighing in which θw = volumetric water content at any suction;
and mixing sand with PR at a specific proportion; (2) θ s = saturated volumetric water content; e = the nat-
tamped with 25 strokes of tamping rod in a mold; (3) ural number (2.71828...); ψ = any soil suction (kPa);
oven-dried at 105 ◦ C for 24 h and then allowed to cool ψr = residual soil suction (kPa) corresponding to the
4 Vol. 15 No. 5 September – October 2020
Figure 4: Filter paper method: (a) test configuration; (b) the SPR specimen preparation and; (c) suction measurement set up.
Table 4. Soil water retention curve model fit parameters.
Description Symbol SP SPR15 SPR17.5 SPR20 SPR22.5
Saturated volumetric water content θs 0.282 0.292 0.309 0.332 0.334
Volumetric water content at ψw θψw 0.015 0.070 0.072 0.080 0.085
Wetting saturated point (kPa) ψbw 2.100 2.800 1.800 2.200 3.420
Water-entry value (kPa) ψw 6.900 9.050 10.150 11.500 11.800
Fredlund and Xing best fit parameters a(kPa) 2.977 3.325 2.451 3.077 3.972
m 1.345 0.534 0.561 0.609 0.486
n 4.797 5.842 3.884 3.652 6.871
based on the statistical predictive methods proposed
by Fredlund et al. (1994) in SEEP/W program [28] for
unsaturated hydraulic conductivity was used to deter-
mine the permeability function from SWRC together
with the saturated permeability of the SPR mixtures.
The equation proposed by Fredlund et al. (1994) [21],
consists of developing the unsaturated hydraulic con-
ductivity function by integrating along the entire curve
of the volumetric water content function, is as shown
in Eq. (3).
R b y 0 y
ln(ψ) θ(ey
) − θ(ψ) /e θ (e )dy
kw = k sat R b (3)
[θ(e ) − θ ] /e θ (e )dy
y y 0 y
ln(ψaev ) s
where kw = unsaturated hydraulic conductivity for a
Figure 5: The procedures of the falling head test.
specified water content or soil suction (m/s); ksat =
measured saturated hydraulic conductivity (m/s); ψ =
soil suction (function of volumetric water content, θ);
residual water content, θr ; and a, m, n = fitting param-
θ s = saturated volumetric water content; e = the natu-
eters.
ral number (2.71828...); y = dummy variable of inte-
0
gration representing the logarithm of suction, θ = the
2.4 Prediction methods of unsaturated hydraulic first derivative of the Eq. (1), b = ln(106 ); and ψaev =
conductivity air entry value.
Permeability function of unsaturated soil is known
as a relationship of hydraulic conductivity varies with 3. Result and Discussion
the changes in matric suction. SWRC and perme-
ability function is required for analyses of water flow 3.1 Wetting SWRC
throughout soil pores concerning variations in ma- When soil is in a wetting stage, as water infiltrates
tric suctions. In this paper, the indirect measurement the soil structure and displaces pore air, the water con-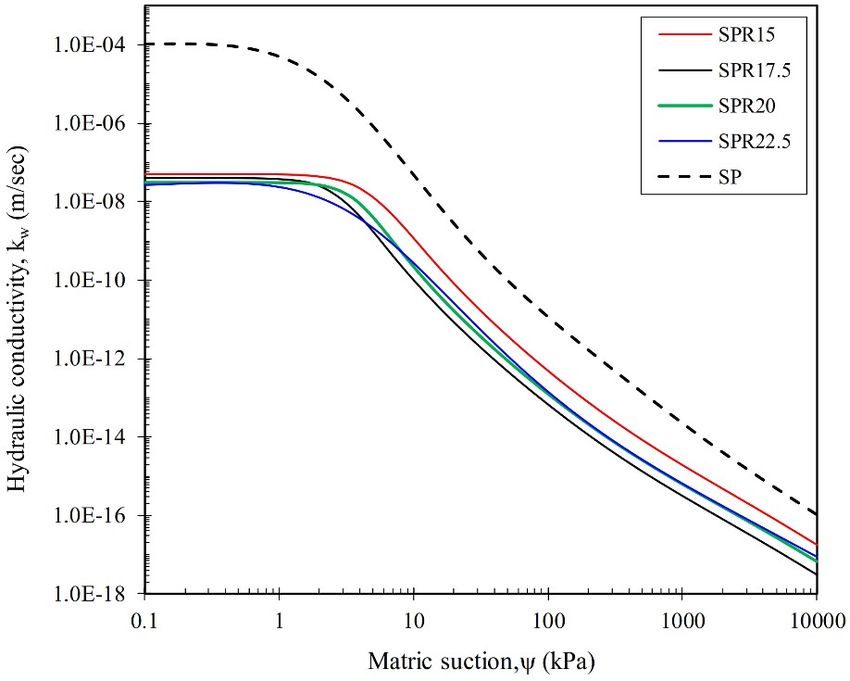
Interdisciplinary Research Review 5
Figure 6: Soil water retention curve of the sand-para rubber (SPR)
Figure 8: Unsaturated hydraulic conductivity function of sand-para
mixtures.
rubber (SPR) mixtures.
and 71% for the SPR mixtures of SPR15, SPR17.5,
SPR20, and SPR22.5, respectively. This implies that
the PR causes the sand to reduced pore size. Increas-
ing the values of volumetric water content (both θs and
θψw ) of the SPR specimens demonstrated the effect of
the water-holding capacity to the sand of para rubber.
In other words, the high amount of water retained due
to the water-absorption of the PR.
The absorption behavior for all mixtures found that
there is some variability of the SWRC for each zone,
especially in the transition zone. Water content in-
creases moderately in the residual zone (ψ > 12 kPa)
although soil suction decreases by several orders of
magnitude. This is because pores have high capillary
tension as a result of small sizes. In the transition zone
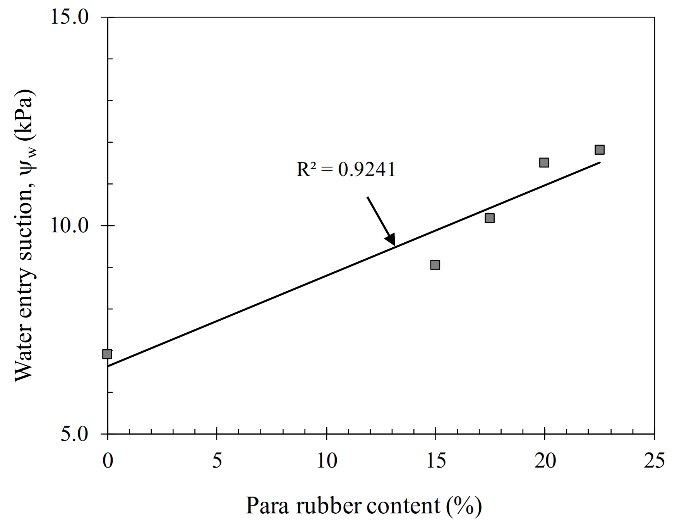
Figure 7: Water entry suction corresponds to the PR content of the (ψ ≈ 2 – 12 kPa), water content increased rapidly rate
wetting SWRCs.
with suction decrease. Compared the SWRCs among
all mixtures found that there are variations of water
content and suction in this zone. Such as the smallest
tent will gradually increase [29]. In this study, the wet-
of ψbw value of the SPR17.5. For the capillary satura-
ting SWRCs were obtained for the four SPR mixtures
tion zone (ψ < 2 kPa), the soil suction almost be un-
using the FP method. For the poorly graded sand, the
changed which found that having increased saturated
SWRC was estimated by using the SEEP/W numerical
water content mention above.
program based on the grain-size distribution method
which used the parameter obtained in Table 1 include
grain size of D10 and D60 . The SWRC parameters 3.2 Measured saturated hydraulic conductivity
fitting are summarized in Table 4. The experimental The permeability testing includes constant head and
data and the best-fit SWRC results of the SPR mix- falling head test methods. The testing results of the
tures are depicted in Fig. 6. The results show that the sand sample (SP) and the SPR mixtures are shown in
SWRC of the four SPR mixtures has significantly dif- Table 5. The initial saturated hydraulic conductivity
ferent compared with untreated sand (SP) which tends (ksat ) of SP is 6.890 × 10⁻⁵ m/s. The values of ksat
to give a higher value of saturated volumetric water generally decreased with increasing PR content. Ad-
content (θs ) at low matric suction. Such increasing in- dition of 15%, 17.5%, 20%, and 22.5% PR contents
cluded about 3%, 10%, 18%, and 19% for the SPR to SP sand decreases its ksat about 3 orders of magni-
mixtures of SPR15, SPR17.5, SPR20, and SPR22.5, tude. Overall, the ranges in the measured ksat for the
respectively. The water entry value (ψw ) is the suction SPR mixtures varied from 4.890 × 10⁻⁸ m/s (SPR15)
at which the water content of soil starts to increase in to 2.280 × 10⁻⁸ m/s (SPR22.5). The results implied
the adsorption process. From the result in Fig. 7 in- that PR has the potential for permeability control of
dicates the value of ψw increases of 31%, 47%, 67%, sand.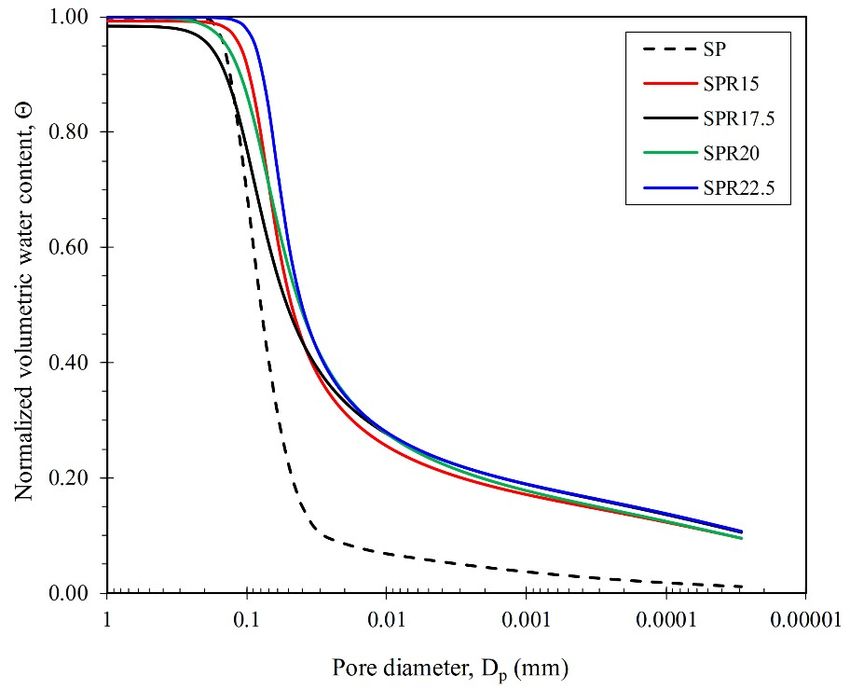
6 Vol. 15 No. 5 September – October 2020
Table 5. Summary of the hydraulic conductivity values obtained from laboratory testing and permeability function prediction.
Description Symbol SP SPR15 SPR17.5 SPR20 SPR22.5
Saturated hydraulic conductivity (m/sec) k sat 6.890e-05 4.890e-08 3.960e-08 3.100e-08 2.280e-08
Unsaturated hydraulic conductivity at kψbw 1.500e-05 3.520e-08 3.020e-08 2.000e-08 1.250e-08
wetting saturated point (m/sec)
Unsaturated hydraulic conductivity at kψw 2.800e-07 2.000e-10 1.000e-10 1.420e-10 1.800e-10
water-entry value point (m/sec)
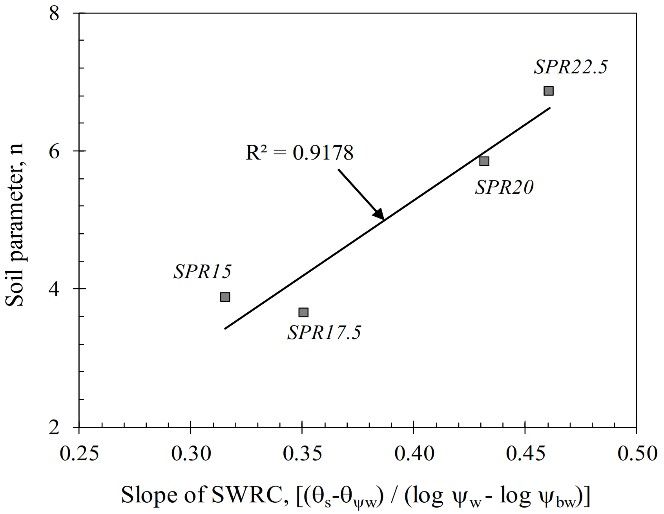
Figure 9: Slope of sand-para rubber (SPR) mixtures. Figure 10: Pore size via normalized volumetric water content of
sand-para rubber (SPR) mixtures.
3.3 Prediction and analysis of permeability function
Using the SWRC fitting parameters summarized in size [30]. The pore size diameterh can be calculated
i
Table 4 and the saturated hydraulic conductivity ob- from the Laplace’s equation of Dp = 4T s cos α/ψ , in
tained from the laboratory test described in the pre- which T s = surface tension of water (72.750 mN/m
vious section, the unsaturated hydraulic conductivity at 20 ◦ C), α is the contact angle between pore water
(kw ) was predicted using the equation of Fredlund et and particles which can be 0 for water-soil interface.
al. (1994) [21]. Fig. 8 displays the kw values of four Fig. 10 presents the relationship between pore size dis-
SPR mixtures and the SP sand concerning matric suc- tribution and the normalized volumetric water content
tion. The shape of the curve is quite similar for all [Θ = θw /θs ]. The pore size ranged from 3.000e-05
SPR mixtures but values vary in three orders of mag- to 1 mm. For the same water content, the Dp of the
nitudes compared with a value of untreated sand. The SPR mixtures is evidence smaller than that of SP sand
value of unsaturated hydraulic conductivity at wetting which exhibits the presence of the PR.
saturated point kψbw (Table 5) is decreased with the PR
content increased. 4. Conclusions
3.4 Effect of PR on the pore size distribution The wetting soil water retention curves (SWRCs)
To describe the influence of PR content on the shape using the filter paper method and the falling head test
of SWRC, the slope and pore size variations were dis- of the SPR mixtures were conducted in this study. The
cussed. Generally, the slope of the SWRC describes experimental results showed that the PR contents have
the rate of water lost from the soil (drying) or filled in prominent effects on the SWRC of poorly graded sand.
pores (wetting) [30]. The steeper slope of the SWRCs, Increasing the volumetric water content of the SPR
larger the parameter n.h The slope of wetting SWRC i mixtures represented the effect of the water-holding
can be calculated as (θs − θψw )/(log ψw − log ψbw ) , capacity to the sand of para rubber. The saturated hy-
as depicted in Fig. 9. Yang et al. (2004) [31] reported draulic conductivity reduced about 3 orders of mag-
that the SWRC of a uniform soil has a steeper slope nitude when sand was treated with the PR. The un-
than that of a less uniform soil. In this study, the shape saturated hydraulic conductivity prediction based on
of the SWRCs (Fig. 9) of the pure sand has a slightly the statistical method showed the evident effected of
steeper slope than that of the SPR mixtures. For SP the para rubber biopolymer. The decrease of the hy-
sand, the slope of SWRC has a consistent to grain-size draulic conductivity and pore size of the SP sand sug-
distribution whereas that slope reduces with the SPR gest the significant potential of the PR that can be
mixtures. Since the shape of SWRC is related to pore applied for various geotechnical engineering applica-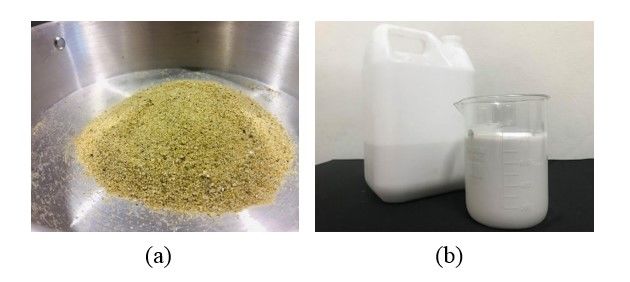
Interdisciplinary Research Review                                                                                                          7

tions such as sandy soil stabilization, surface erosion                 [13] P. Promputthangkoon, A. Rungvichaniwat, N. Kaewthai An-
reduction, sand liquefaction, and so on.                                    drei, T. Kuasakul, On the mechanical properties of para rubber-
                                                                            oil palm ash derived geosynthetic clay liner, IOP Conf. Series:
                                                                            Materials Science and Engineering 773 (2020) 012054.
Acknowledgment                                                          [14] Department of Highway, Specification for natural rubber mod-
                                                                            ified soil cement base course, (2017). (in Thai)
                                                                        [15] P. Plangoen, Application of rubber latex and soil cement de-
   The authors gratefully acknowledge the Faculty of                        velop drought relieving water pond, Engineering Journal Chi-
Engineering, the Rajamangala University of Technol-                         ang Mai University 25(2) (2018) 170 - 180. (in Thai)
ogy Srivijaya for providing laboratory facilities in this               [16] S. R. Yang, H. D. Lin, J. H. S. Kung, J. Y. Liao, Shear wave
study.                                                                      velocity and suction of unsaturated soil using bender element
                                                                            and filter paper method, Journal of GeoEngineering 3(2) (2008)
                                                                            67 - 74.
                                                                        [17] Q. F. Bai, S. H. Liu, Measurement of the shear strength of an
References                                                                  expansive soil by combining a filter paper method and direct
                                                                            shear tests, Geotechnical Testing Journal 35(3) (2012) 451 -
[1] G. A. Siemens, Thirty-Ninth Canadian Geotechnical Col-
                                                                            459.
    loquium: Unsaturated soil mechanics-bridging the gap be-
                                                                        [18] H. Kim, E. Ganju, D. Tang, M. Prezzi, R. Salgado, Matric
    tween research and practice, Canadian Geotechnical Journal 55
                                                                            suction measurements of compacted subgrade soils, Road Ma-
    (2018) 909 - 927.
                                                                            terials and Pavement Design 16(2) (2015) 358 - 378.
[2] A. F. Cabalar, M. Wiszniewski, Z. Skutnik, Effects of xan-
                                                                        [19] X. Xie, P. Li, X. Hou, T. Li, G. Zhang, Microstructure of com-
    than gum biopolymer on the permeability, odometer, uncon-
                                                                            pacted loess and its influence on the soil-water characteristic
    fined compressive and triaxial shear behavior of a sand, Soil
                                                                            curve, Advances in Materials Science and Engineering (2020).
    Mechanics and Foundation Engineering 54(5) (2017) 356 - 361.
                                                                        [20] D. G. Fredlund, A. Xing, Equations for the soil-water charac-
[3] J. Jang, A review of the application of biopolymers on geotech-
                                                                            teristic curve, Canadian Geotechnical Journal 31 (1994) 521 -
    nical engineering and the strengthening mechanisms between
                                                                            532.
    typical biopolymers and soils, Advances in Materials Science
                                                                        [21] D. G. Fredlund, A. Xing, S. Huang, Predicting the permeabil-
    and Engineering (2020).
                                                                            ity function for unsaturated soils using the soil-water charac-
[4] I. Chang, A. K. Prasidhi, J. Im, G. C. Cho, Soil strengthening
                                                                            teristic curve, Canadian Geotechnical Journal 31 (1994) 533 -
    using thermo-gelation biopolymers, Construction and Building
                                                                            546.
    Materials 77 (2015) 430 - 438.
                                                                        [22] P. Sirisomboon, C. H. Lim, Rapid evaluation of the proper-
[5] I. Chang, G. C. Cho, Shear strength behavior and parameters
                                                                            ties of natural rubber latex and its products using near-infrared
    of microbial gellan gum-treated soils: from sand to clay, Acta
                                                                            spectroscopy, (2019) In Organic Polymers. IntechOpen.
    Geotechnica 14(2) (2019) 361 - 375.
                                                                        [23] M. L. D. N. Silva, P. L. Libardi, F. H. S. Gimenes, Soil water
[6] S. Lee, J. Im, G. C. Cho, I. Chang, laboratorytriaxialtest behav-
                                                                            retention curve as affected by sample height, Revista Brasileira
    ior of xanthan gum biopolymer-treated sands, Geomechanics
                                                                            de Ciencia do Solo 42 (2018).
    and Engineering 17(5) (2019) 445 - 452.
                                                                        [24] ASTM D5298-03, Standard test method for measurement of
[7] M. B. Burbank, T. J. Weaver, T. L. Green, B. C. Williams, R. L.
                                                                            soil potential (suction) using filter paper, ASTM International,
    Crawford, Precipitation of calcite by indigenous microorgan-
                                                                            West Conshohocken, PA, 2003.
    isms to strengthen liquefiable soils, Geomicrobiology Journal
                                                                        [25] ASTM D2434-19, Standard test method for permeability of
    28 (2011) 301 - 312.
                                                                            granular soils (constant head), ASTM International, West Con-
[8] E. KavazanjianJr, E. Iglesias, I. Karatas, Biopolymersoil stabi-
                                                                            shohocken, PA, 2019.
    lization for wind erosion control, Proceedings of the 17th Inter-
                                                                        [26] ASTM D5084-16a, Standard test methods for measurement
    national Conference on Soil Mechanics and Geotechnical En-
                                                                            of hydraulic conductivity of saturated porous materials using
    gineering, 2009, pp. 881 - 884.
                                                                            a flexible wall permeameter, ASTM International, West Con-
[9] S. M. Ham, I. Chang, D. H. Noh, T. H. Kwon, B. Muhunthan,
                                                                            shohocken, PA, 2016.
    Improvement of surface erosion resistance of sand by microbial
                                                                        [27] E. C. Leong, H. Rahardjo, Review of soil-water characteristic
    biopolymer formation, Journal of Geotechnical and Geoenvi-
                                                                            curve equations, Journal of Geotechnical and Geoenvironmen-
    ronmental Engineering 144(7) (2018).
                                                                            tal Engineering 123(12) (1997) 1106 - 1117.
[10] R. Khachatoorian, I. G. Petrisor, C. C. Kwan, T. F. Yen,
                                                                        [28] GEOSTUDIO, User’s Manual, Geo-slope international Ltd.
    Biopolymer plugging effect: laboratory-pressurizedpumping
                                                                            Calgary, Alberta, 2012.
    flow studies, Journal of Petroleum Science and Engineering
                                                                        [29] W. L. Xiea, P. Lia, S. K. Vanapallib, J. D. Wanga, Predic-
    38(1-2) (2003) 13 - 21.
                                                                            tion of the wetting-induced collapse behaviour using the soil-
[11] A. Bouazza, W. P. Gates, P. G. Ranjith, Hydraulic conductivity
                                                                            water characteristic curve, Journal of Asian Earth Sciences 151
    of biopolymer-treated silty sand, Geotechnique 59 (1) (2009)
                                                                            (2018) 259 - 268.
    71 - 72.
                                                                        [30] S. S. Agus, E. C. Leong, H. Rahardjo, Soil-water character-
[12] A. Lukjan, A. Iyaruk, S. Swasdi, C. Somboon, Shear strength
                                                                            istic curves of Singapore residual soils, Geotechnical and Geo-
    characteristics of the natural rubber bonded sand, Engineering
                                                                            logical Engineering 19 (2001) 285 - 309.
    Journal of Research and Development 29(4) (2018) 5 - 18. (in
                                                                        [31] H. Yang, H. Rahardjo, E. C. Leong, D.G. Fredlund, Factors
    Thai)
                                                                            affecting drying and wetting soil-water characteristic curves of
                                                                            sandy soils, Canadian Geotechnical Journal 41 (2004) 908 -
                                                                            920.
You can also read