The socio-economics dynamics of Dam on Rural Communities: A case study of Oyan Dam, Nigeria - PIAHS
←
→
Page content transcription
If your browser does not render page correctly, please read the page content below
Innovative water resources management – understanding and balancing interactions between humankind and nature
Proc. IAHS, 379, 175–180, 2018
https://doi.org/10.5194/piahs-379-175-2018                                                                           Open Access
© Author(s) 2018. This work is distributed under
the Creative Commons Attribution 4.0 License.

               The socio-economics dynamics of Dam on Rural
               Communities: A case study of Oyan Dam, Nigeria
                                              Amidu Ayeni and Lawrence Ojifo
                                   Department of Geography, University of Lagos, Nigeria
                                  Correspondence: Amidu Ayeni (aayeni@unilag.edu.ng)

           Received: 9 December 2017 – Revised: 23 February 2018 – Accepted: 27 February 2018 – Published: 5 June 2018

       Abstract. Dams construction and operations have many benefits, nevertheless, they have also led to lots of
       negative social, health and human impacts. It is based on this that this study assesses the potential and socio-
       economics dynamics of Oyan dam between 1980 and 2016. The data used for this study include water level and
       discharge records of the dam between 2007 and 2016, Landsat imageries of 1984 and 2016 and socio-economic
       datasets for the period. Analysis of the dam potentials (water supply, agriculture and hydropower) and socio-
       economic impacts of the dam were carried out using basic statistical tools, land use change anaysis and field
       survey using questionnaire, structured interview with major stakeholders and personal observation. The results
       revealed that the water level and storage of the Oyan dam had a relative reduction of about 2 % as well as
       non-stationarity pattern of water abstraction and production for the period. The landuse classes show all classes
       decreased in extent except the cultivated landuse that acrued an increased of 19.9 % between 1984 and 2016.
       Furthermore, commercial water supply varied significantly between 2010 and 2016 while irrigation scheme is
       grossly under-utilized from the inception in 1983 to 2016. Finally, the result of socio-economic impacts revealed
       that majority of the selected communities’ members are actually not benefiting from the dam and their livelihoods
       are not from the dam.

1   Introduction                                                   The environmental changes and social disruption result-
                                                                   ing from dams and associated infrastructure (e.g. irrigation
The occurrence and impact of the 1972–1975 Sahelian                schemes) have had adverse effect on health of the local popu-
drought aggravated the food security in the country which          lation and downstream communities (Williams and Wolman,
prompted various arms of government to embark on a rigor-          1984; Collier et al., 1996; Richter et al., 2010; Sivongxay
ous policy to increase food production (Taviano and Marcelo,       et al., 2017). Therefore, access to drinking water, health ser-
2010). To accomplish the policy, river basins impoundment          vices and ability to cope with new social and physical envi-
was seen as inevitable to provide sufficient water for year-       ronment determine socio-health conditions of the displaced
round irrigation which led to the construction of over 246         population and/or communities (WHO, 1985; World Com-
dams (Imevbore et al, 1986). Of the 323 dams in Nige-              mission on Dams, 2000; Richter and Thomas, 2010). It is
ria in 2002, 106 of them are large dams (dams with walls           based on the aforementioned that this study tends to provide
higher than 15 m or 10–15 m high with a crest length of over       answers to these questions (i) What are the designed func-
500 m or having a reservoir capacity of 1 million m3 ), 27 are     tions for the establishment of the dam? (ii) what is the present
medium sized dams (walls are 8–10 m high) and 192 are              serving condition and/or capacity of the dam functionalities?
small dams (walls less than 8 m) (Ofoezie, 2002; Ogbeide           (iii) What are the socio-economic impacts of the Oyan dam?
and Uyigue, 2004).                                                 (iv) what is the spatio-temporal dynamics of the Oyan Basin
   The construction and operation of these dams have yielded       over the last 31 years?
many benefits, nevertheless, they have also have led to lots
of negative social, health and human impacts (Webbe, 1981;
Williams and Wolman, 1984; McCartney and King, 2011).

Published by Copernicus Publications on behalf of the International Association of Hydrological Sciences.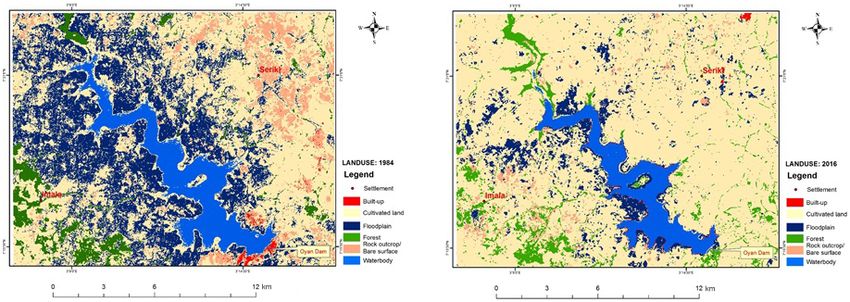
176                                      A. Ayeni and L. Ojifo: The socio-economics dynamics of Dam on Rural Communities

Figure 1. Oyan Dam (Insert – top right: Nigeria; Insert – bottom right: Ogun State).

2   Study Area                                                          cal datasets were analysed as a function of the monthly data
                                                                        using simple arithmetic mean equation.
Oyan dam is located between latitude 7◦ 150 and 7◦ 250 N,                  The second dataset obtained through field survey using
and longitude 3◦ 080 and 3◦ 160 E near Abeokuta, the capi-              questionnaire and interview was socio-economic data. This
tal city of Ogun State, Nigeria (Fig. 1). The dam which is              data addresses community livelihood profiles, health status
owned and operated by the Ogun-Osun River Basin Devel-                  of the population, and social impact of the dam on the com-
opment Authority (OORBDA) was commissioned in 1984.                     munities. Socio-economic impact assessment of the dam was
Lying adjacent to the dam are three resettlement communi-               carried out in three selected communities around the Oyan
ties named Abule Sikiru, Abule Titun, and Ibaro. The dam is             dam vis-à-vis Abule Sikiru, Abule Titun, and Ibaro. Struc-
about 30 m high with a reservoir (gross storage) capacity of            tured questionnaire was used to extract information about the
270 million m3 and a dead storage capacity of 16 million m3             socio-economic impact of the dam. The sample size of the
and 9-megawatt power generation capacity. It has a surface              communities was based on OORBDC estimated population
area of 40 km2 and catchment area is approx. 9000 km2 with              size of the communities, therefore, about 50, 60, and 50 ques-
embankment crest length of 1044 m. The dam design free                  tionnaires were randomly distributed in Abule Sikiru, Abule
board at 10 000 years flood is 2.10 m high with four spillway           Titun, and Ibaro, respectively. The questions examined in-
gates (each with 15 m wide and 7 m high), and three outlet              cludes household characteristics, community livelihood pro-
valves (each with 1.8 m in diameter). It supplies water for ir-         file, socio-economic benefits, and resource potential of the
rigation and for domestic uses to the cities of Abeokuta and            dam. The socio-economic datasets were analysed using ba-
Lagos.                                                                  sic descriptive statistics method of data analysis.
                                                                           The last dataset for spatio-temporal dynamics assessment
                                                                        of the dam Basin was based on Landsat imageries of The-
3   Methodology                                                         matic Mapper (TM) and Enhanced Thematic Mapper (ETM)
                                                                        for 1984 and 2016 respectively. The two periods dataset
The data used for this research work include hydrological,              were obtained from Glovis portal. Six (6) landuse/landcover
remotely sensed, and socio-economic datasets. Each of these             classes were extracted from each of the imageries using
datasets were used to achieve the objectives of the study. Hy-          the standard procedures for LULC classification anaysis (de
drological dataset consists of the daily hydrological records           Vries et al., 2007; Chander et al., 2009; Ayeni et al., 2016).
for the last 10 years (i.e. 2007–2016). This data includes              In view of this, a certain number of training dataset was ran-
river water level, water discharge, and supply. These data              domly sampled from the spectral signature of each of the
were sourced from the Ogun-Oshun River Basin Develop-                   classes to define their respective landuse/landcover type.
ment Authority (OORBDA). The collected daily hydrologi-

Proc. IAHS, 379, 175–180, 2018                                                                         proc-iahs.net/379/175/2018/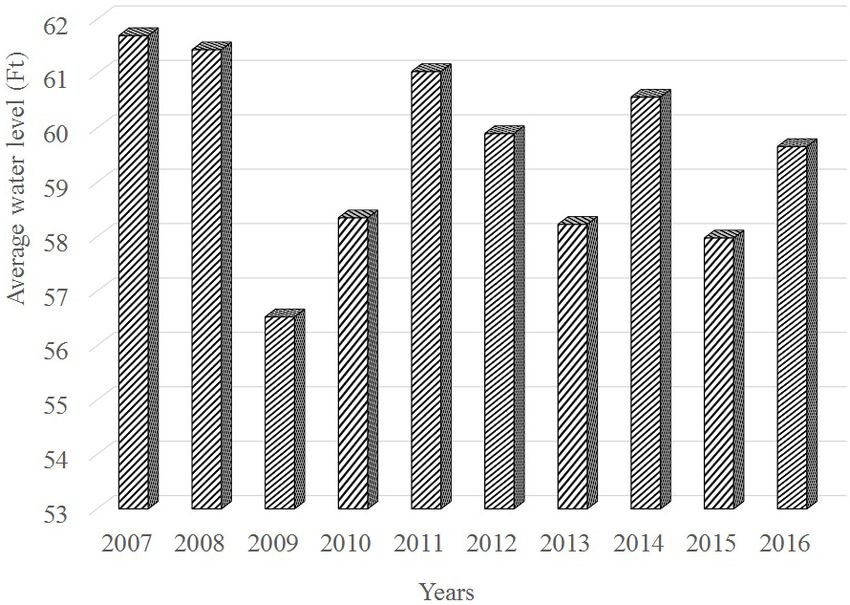
A. Ayeni and L. Ojifo: The socio-economics dynamics of Dam on Rural Communities 177
Figure 2. Water Supply of Oyan dam between 2010 and 2016. Figure 3. Average Yearly Water Level of Oyan dam Source:
OORBDA, 2017.
Subsequently, the results of the datasets collected were
presented in maps, tables and charts. agricultural project respectively. The water supply pattern of
Oyan dam revealed that water was only supply on demand
from Ogun and Lagos Water Corporation. The study further
4 Results and discussions revealed that water is supply mostly during the dry season.
Thus, certain months received a high demand than the oth-
4.1 The primary functions for the establishment of the ers. Figure 2 shows that 2012 has a highest water supply of
dam about 101 041.2 million m3 in the history of the dam. Infor-
Oyan dam was primarily designed to: (i) generate about 9 mation revealed that the dam has a capacity to supply more
megawatts hydro-electric power to support the existing na- than this volume since there were no set limit for supply from
tional grid; (ii) supply raw water to Lagos and Abeokuta inceptions. Furthermore, based on this data, it can be inferred
which are the immediate downstream urban cities, and, that Oyan dam has a larger carrying capacity to supply more
(iii) finally to support Lower Ogun basin 3000 ha Irrigation water than what is currently supplying.
Project. The dam is used for breeding fish. Oyan dam was Figure 3 shows the annual water level storage of Oyan dam
also designed to function as flood control flood through safe between 2007 and 2016. The annual average water level stor-
release of water in the downstream. Over the years, cases of age ranging between 17.23 m (lowest) and 18.80 m (highest)
flooding in the downstream had been attributed to excess wa- in 2009 and 2007 respectively. The figure shows that there is
ter release from the Oyan dam. In addition, other operational significant high amount of water production in 2007 which
problems have also led to conflicts over the adequacy of wa- account for 10.36 %. This explains the percentage of the wa-
ter released for downstream uses, irrigation, fisheries and raw ter abstraction in each of the years, and a level of consistency
water supply for water treatment in Abeokuta city and Lagos in water level and storage capacity of dam over a 10 years
State. period.
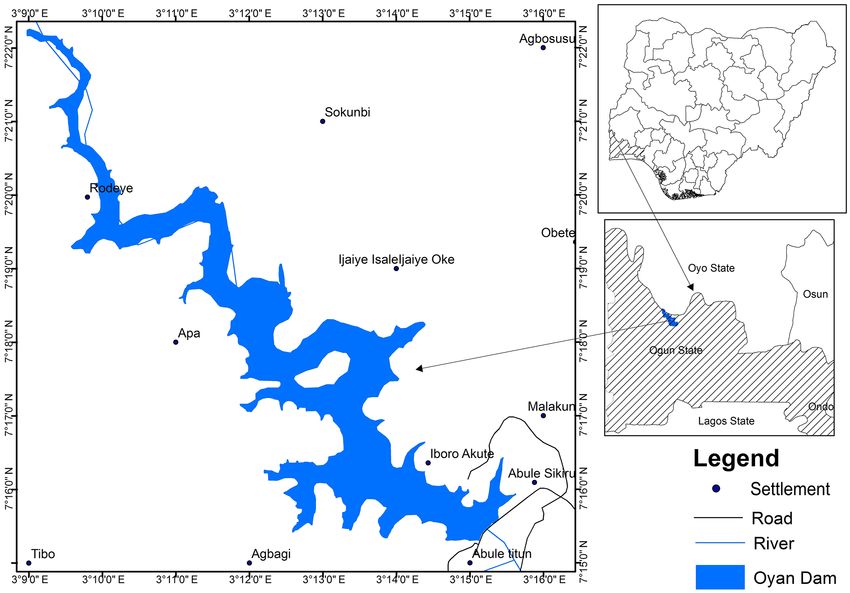
Oyan dam capacity of generating over 9 mw of hydro- The monthly water discharge of Oyan dam releases a sig-
electric power has been locked since the commissioning in nificant amount of water for domestic and industrial uses.
1984. This implies that the dam currently generates zero Though, there was data paucity in all years due to certain
megawatt of electricity making it a 100 % decrease in the factors except 2007 which its records show that water was
power generation function. As stated earlier, Oyan dam was released throughout the year with some months exhibit ex-
designed to supply raw water to the immediate downstream ceptional discharge rate than the others. It shows that from
urban cities – Lagos and Abeokuta, and to support the May to November, the amount of water that was discharged
3000 ha Lower Ogun Irrigation Project. Three turbines of 3 rose significantly (Fig. 4). The figure revealed that January
megawatts each were installed in 1983 but they have not been to April record low amount of water discharge ranging from
in operation since the inception. 112 to 192 million m3 while May discharge increased signif-
According to OORBDO (2017), the dam has a potential icantly to about 1720 million m3 .
irrigation capacity of 32 000 ha of land around the dam and
the lower basin irrigation project at Mokoloki. However, the
dam presently supports only 8000 and 3000 ha around the
dam and at the both upstream/downstream lower irrigation
proc-iahs.net/379/175/2018/ Proc. IAHS, 379, 175–180, 2018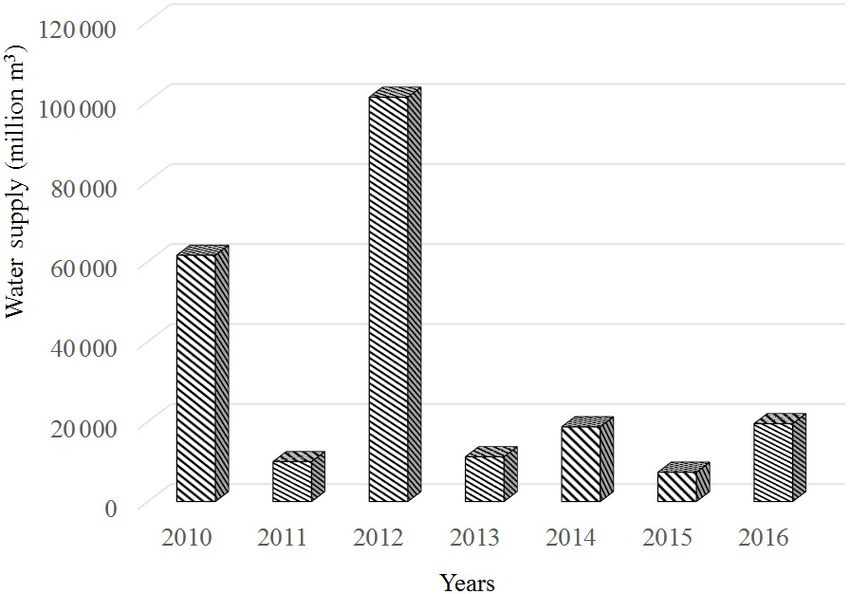
178                                      A. Ayeni and L. Ojifo: The socio-economics dynamics of Dam on Rural Communities

                                                                  Table 2. Purpose of the Water in the Dam.

                                                                                                    Frequency      Percent
                                                                            Domestic purpose                  98     62.4
                                                                            Industrial purpose                13      8.3
                                                                            Commercial purpose                36     22.9
                                                                            Cultural purpose                   5      3.2
                                                                            Total                         153        97.5
                                                                                                          157         100

                                                                  Table 3. Effect of Dam on Livelihood/Standard of Living of the
                                                                  respondent.

                                                                                                    Frequency      Percent
Figure 4. Monthly Water Discharge of Oyan Dam in 2007.
                                                                           Below average                   14          8.9
                                                                           Average                         19         12.1
                                                                           A little above average         109         69.4
Table 1. Oyan Dam Landuse Dynamics between 1984 and 2016.                  very high                        9          5.7

                           1984                2016                        Total                          151         96.2
                                                                                                          157          100
                     Area (ha)      %     Area (ha)     %
      Built-up           121.3     0.1         81.7   0.08
      Cultivated      70 860.4    72.4     90 320.4   92.3
                                                                  4.3   Socio-Economic Impacts of the Dam
      Floodplain      14 847.6    15.2      2191.1     2.2
      Forest           6624.7      6.8      2613.7     2.7        The socio-economic impacts of the dam on the neighboring
      Rock outcrop     2861.8      2.9        737.5    0.8
                                                                  communities was evaluated on the basis of the community
      Waterbody        2524.9      2.6      1896.3     1.9
                                                                  livelihood profiles, health status of the population, and social
      Total           97 840.7    100      97 840.7   100         impact of the dam on the communities.
                                                                     Table 2 shows the socio-economic benefits of the dam as
                                                                  argued by the respondents. The result shows that more than
                                                                  86 % of the respondents were fully aware of the dam in their
4.2   Spatio-Temporal Dynamics of the Oyan                        neighborhood. This signifies that the communities’ member
      Downstream Basin                                            understands the potentials and socio-economic benefits they
                                                                  can derive directly or indirectly from the dam. It also indi-
Table 1 and Fig. 5 show the six major landuse/landcover           cates that more than 62.4, 8.3, and 22.9 % of the respondents
classes identified around the Oyan dam for the two scenar-        use this dam for domestic, industrial and commercial purpose
ios (1984 and 2016).                                              purposes respectively (Table 2).
   The classes of landuse/landcover identified include built-        The results on sources of livelihood derivable from Oyan
up, forest, water body, cultivated land, floodplain and rock      dam show that about 70.1 % of the respondents are not de-
outcrop/bare surface. The results show that built-up de-          riving their livelihood from the dam while only 1.3 % of the
creased from 121.3 ha (0.1 %) in 1984 to about 81.7 ha            respondents claimed they are deriving their livelihood from
(0.08 %) in 2016 (Table 1 and Fig. 5). The changes signify        the dam. Table 3 reveals the effect of the dam on livelihood
the effect of dam development on small communities which          and/or standard of living of the respondents. It was observed
were either relocated or lost to the development. On the other    that about 18.9 % of the respondents are living “below aver-
hand, forest decreased from 6624.7 ha (6.8 %) in 1984 to          age”, 12.1 % are on the “average”, 63.3 % are above average’
2613.7 ha (2.7 %) in 2016.                                        while a fraction of about 5.7 % of the respondents had “high”
   However, water body relatively shows a stable slight           standard of living.
change. It decreases from with about 2524.9 ha (2.6 %) in            This study reveals that the health status of majority of
1984 to about 1896.3 ha (1.9 %) in 2016. Thus, the dynamic        the population is good as argued by 51.6 % respondents and
nature of this landuse/landcover observed in this basin can be    the presence of dam has nothing to do with their state of
associated with the variation in the water abstraction and pro-   health. Displacement and environmental degradation have
duction of the dam where the most dominant landuse (Culti-        been identified as the challenges experienced from time to
vated) demand more water.                                         time. Thus, communities expect more from this dam in terms

Proc. IAHS, 379, 175–180, 2018                                                                      proc-iahs.net/379/175/2018/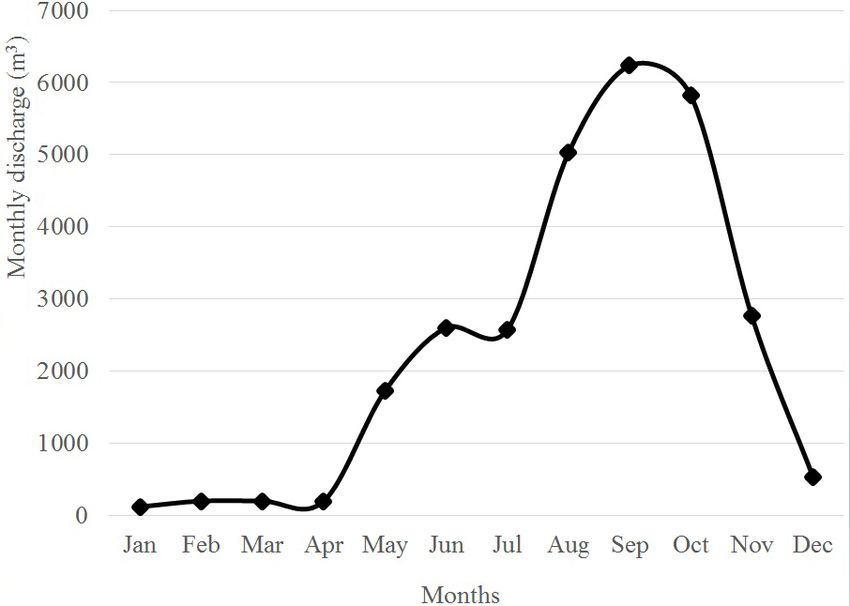
A. Ayeni and L. Ojifo: The socio-economics dynamics of Dam on Rural Communities                                                   179

Figure 5. Landuse Pattern of Oyan Dam in 1984 and 2016.

of employment of the local communities, compensation as            existence. Series of conflicts have also triggered from other
well as relocation of the displaced communities, and capacity      operational activities around the dam. These conflicts em-
building as pointed out by 36.3, 54.8, and 3.8 % respondents       anated from the inadequacy of water released for irrigation,
respectively.                                                      fisheries and raw water supply for domestic water uses in part
   These results revealed that the spatio-temporal changes         of Ogun and Lagos States. It is on this premise that the study
(reduction in water body and forest) around Oyan dam as            examines the prime purpose of dam construction, evaluate its
well as degraded and poor maintenance of dam and associ-           carrying capacity in terms of its depth, surface area extent,
ated infrastructure have affected the dam in varying degrees       volume of water generates and agricultural potential, spatio-
vis-à-vis reduction in dam level and storage capacity, inabil-     temporal analysis of the dam was examined between 1980
ity to meet the designed water supply capacity, and inabil-        and 2015 and lastly, socio-economic impacts of the dam de-
ity to generates hydro-electric power amongst others. These        velopment were carried out among its neighboring commu-
have had considerable adverse effects on designed functions        nities.
of the dam and the basin ecosystem, and therefore, resulted           The socio-economic impacts of the dam revealed that few
to continuous reduction in the serving condition and capacity      people are actually benefiting or deriving their livelihoods
of the dam especially on irrigation scheme, livelihoods and        from the dam. Thus, communities expect more from this dam
other socio-economic potentials.                                   in terms of employment of the local communities, compen-
                                                                   sation and relocation of the displaced communities.

5   Conclusions
                                                                   Data availability. Data are available at Ogun-Oshun River Basin
This study identified two major resource potentials of Oyan        Development Authority (OORBDA) head office, Abeokuta, Ogun
dam as at the 2016 vis-à-vis commercial water supply and           State, Nigeria.
irrigation scheme. It was observed that the commercial wa-
ter supply varied with season. Most of the water are supply
during the dry season with 2012 accounts for higher percent-       Competing interests. The authors declare that they have no con-
age of water supply. Irrigation scheme at Oyan upper section       flict of interest.
(8000 ha) and Makoloki farm settlement (9000 ha) were ob-
served to be under-utilization of water resource potential of
                                                                   Special issue statement. This article is part of the special issue
the dam while the 9-megawatt hydropower potential is yet to
                                                                   “Innovative water resources management – understanding and bal-
be tapped.
                                                                   ancing interactions between humankind and nature”. It is a result of
   The continuous release of water from Oyan Dam in the re-        the 8th International Water Resources Management Conference of
cent time has increased the occurrences of downstream flood-       ICWRS, Beijing, China, 13–15 June 2018.
ing at the lower part of the Ogun basin. For instance, there
have been persistence flooding ravaging the city of Lagos
over the year with significant effects on socio-economic ac-       Acknowledgements. The Authors are grateful to the Ogun-Osun
tivities. This also resulted to a situation where the irrigation   River Basin Development Authority (OORBDA) for providing
project of the dam has either been under-utilized or none in

proc-iahs.net/379/175/2018/                                                                     Proc. IAHS, 379, 175–180, 2018
180 A. Ayeni and L. Ojifo: The socio-economics dynamics of Dam on Rural Communities
historical Hydrological dataset. Ofoezie, I. E.: Human health and sustainable water resources de-
velopment in Nigeria: schistosomiasis in artificial lakes, Natural
Edited by: Wenchao Sun Resources Forum, 26, 150–160, https://doi.org/10.1111/1477-
Reviewed by: two anonymous referees 8947.00015, 2002.
Ogbeide, H. E. and Uyigue, E.: Access to safe drinking water
and schistosomiasis, in: Nigeria: survey on Ipogun Community,
Ondo State of Nigeria, submitted to the Society for Water and
References
Public Health Protection (SWAPHEP), 2004.
Ayeni, A. O., Cho, M. A., Mathieu, R., and Adegoke, J. O.: The lo- OORBDA: Ogun-Osun River Basin Development Authority
cal experts’ perception of environmental change and its impacts (OORBDA), 2017.
on surface water in Southwestern Nigeria, Environ. Develop., 17, Richter, B. D., Postel, S., Revenga, C., Scudder, T., Lehner, B.,
33–47, 2016. Churchill, A., and Chow, M.: Lost in development’s shadow: The
Chander, G., Markham, B., and Helder, D.: Summary of current ra- downstream human consequences of dams, Water Alternatives,
diometric calibration coefficients for Landsat MSS, TM, ETM+, 3, 14–42, 2010.
and EO-1 ALI sensors, Remote Sens. Environ., 113, 893–903, Richter, B. D. and Thomas, G. A.: Restoring environmental flows
2009. by modifying dam operations, Ecol. Soc., 12, 12, 2007.
Collier, M., Webb, R. H., and Schmidt, R. H.: Dams and rivers: Sivongxay, A., Greiner, R., and Garnett, S. T.: Livelihood impacts
primer on the downstream effects of dams, U.S. Geological Sur- of hydropower projects on downstream communities in central
vey Circular 1126, Denver, Colorado, USA, 1996. Laos and mitigation measures, Water Resources and Rural De-
de Vries, C., Danaher, T., Denham, R., Scarth, P., and Phinn, S.: velopment, 9, 46–55, 2017.
An operational invariant target sites, Remote Sens. Environ., 107, Taviano, C. and Marcelo, G.: The day after tomorrow: a handbook
414–429, 2007. on the future of economic policy in the developing world, The
Imevbore, A. M. A., Ofoezie I. E., and Obot E. A.: Report on the International Bank for Reconstruction and Development/The
study on snail and cyclopoid borne disease: problems of small World Bank, 2010.
scale water resources development Nigeria, submitted to the Webbe, G.: Schistosomiasis: Some Advances, British Medical Jour-
World Health Organization by the Institute of Ecology, O.A.U., nal (Clinical Research Edition), 283, 1104–1106, 1981.
Ile-Ife, Nigeria, 1986. WHO: Human Health and Dams, WCD Working Paper, 1999.
McCartney, M. and King, J.: Use of decision support systems to im- Williams, G. P. and Wolman, M. G.: Downstream effects of dams on
prove dam planning and dam operation in Africa, Colombo, Sri alluvial rivers. U.S. Geological Survey Professional Paper 1286,
Lanka: CGIAR Challenge Program for Water and Food (CPWF), Denver, Colorado, USA, 1984.
74 pp. (CPWF Research for Development Series 02), 2011. World Commission on Dams: Dams and development: a new frame-
work for decision-making, Earthscan, London, UK, 2000.
Proc. IAHS, 379, 175–180, 2018 proc-iahs.net/379/175/2018/You can also read