Systems Thinking Education-Seeing the Forest through the Trees - MDPI
←
→
Page content transcription
If your browser does not render page correctly, please read the page content below
systems
Case Report
Systems Thinking Education—Seeing the Forest
through the Trees
Sigal Koral Kordova 1, *      ID
                                   , Moti Frank 2 and Anat Nissel Miller 3
 1   Management of Technology Faculty, Holon Institute of Technology, Holon 58102, Israel
 2   Program of Human Resource and Management, Ramat-Gan Academic College, Ramat-Gan 5227528, Israel;
     moti.mf@gmail.com
 3   Industrial Engineering and Management Department, Ariel University, Ariel 40700, Israel;
     nissela@braude.ac.il
 *   Correspondence: sigalkord@gmail.com; Tel.: +972-5-0555-6400

 Received: 3 May 2018; Accepted: 6 July 2018; Published: 12 July 2018

 Abstract: Systems thinking is an indispensable tool in comprehending and analyzing real-world
 phenomena. Observed processes are naturally composed of many interconnected components
 which ought to be studied jointly rather than individually. Engineering systems thinking is a very
 valuable skill, which helps to successfully execute multi-disciplinary projects. In high-tech companies
 that deal with complex and dynamic systems projects, the need for engineers with high systems
 thinking skills is growing. Engineers with high systems thinking skills are able to understand the
 big picture and the project in its entirety, both functionally and conceptually, without necessarily
 knowing all of the small details. Systems thinking enables understanding the entire system beyond its
 components, and clarifies the importance of the isolated component as part of the system as a whole.
 Systems thinking helps understand how sub-systems connect to one whole system, and provides
 solutions for the client’s specifications and requirements. In addition, systems thinking enables
 perceiving the inter-relationships and mutual influence among the system’s components and other
 systems. The current study examined the development of systems thinking among engineers and
 engineering students. In addition, the personality traits of engineers with high systems thinking
 skills were examined by the Myers-Briggs Type Indicator (MBTI) personality type test. This article
 also presents the initial results of the development of a new systems thinking study course, taught as
 a pilot course to industrial and management engineering students. It seems that engineers with
 certain personality traits can acquire or improve their systems thinking capabilities through a gradual,
 long-term learning process and by acquiring the necessary tools. Additionally, the study includes
 recommendations for the continuation of ongoing research on developing systems thinking.

 Keywords: system thinking; systems approach; capacity for systems thinking; Myers Briggs Type
 Indicator (MBTI) personality type test

1. Introduction
     Breaking down complex problems into constituent elements is often the accepted method of
handling of complex assignments and questions. However, engaging in such deconstruction also
often blurs perception of the problem’s larger context. As stated by Senge [1]: “Systems thinking is
a discipline for seeing wholes, a framework for seeing interrelationships and repeated patterns of
events rather than just isolated incidences, seeing patterns of change rather than static “snapshots”.
It provides a scaffolding of principles, specifically tools and techniques developed in recent years,
and is a discipline that seeks to discover the constructs underlying the complex, thus enabling a
perception capable of discerning potential significant improvements possible with a minimum of effort

Systems 2018, 6, 29; doi:10.3390/systems6030029                              www.mdpi.com/journal/systems
Systems 2018, 6, 29 2 of 14
(the principle of leverage). It offers us a language that expands, changes, and reshapes our ordinary
ways of thinking regarding complex issues.
Clearly systems thinking will prove vital to students and graduates of technology management in
their professional careers, helping them see and grasp multidisciplinary systems without necessarily
being required to master the intricacies of each of their numerous parts.
2. Literature Review
The interrelationships of various system elements are the primary focus of the systems approach,
as the discipline is founded on the understanding that such interactions are equally significant as the
particular properties of the system components.
One of systems thinking’s pioneers is Ludwig von Bertalanffy [2], a biologist who perceived
systems thinking as a method of scientific investigation.
Bertalanffy [2] claimed that in order to understand what separates living matter from non-living
matter, one needs to look not only at the microscopic particles, but also how they influence one another
within the whole. Thereafter, he confirmed this viewpoint as a fundamental scientific approach,
claiming that the only way to fully understand why a phenomenon arises and persists is to understand
its parts in relation to the whole [3].
Bertalanffy [3] explained what systems thinking is: an approach that advocates viewing the
issue at hand as a whole, emphasizing the interrelationships among its components rather than the
components themselves, contrary to the traditional approach that understood a subject by analyzing
its individual parts.
Bertalanffy [3] focused on formulating a general systems theory that could explain all systems in
various fields of science since all systems are similar. The General Systems Theory (GST) contains a
system of arguments, based on inter-disciplinary comparison. According to the GST, application of the
theory to one specific scientific field helps solve problems and explain phenomena and processes in
other fields [4].
Sterman [5,6] defined systems thinking as the ability to see the world as a complex system,
in which we understand that ‘you cannot just do one thing’, that ‘everything is connected to
everything else’.
Senge [1] explained how to use the systems-thinking method in order to convert companies into
learning organizations.
Senge [1] describes systems thinking as:
• A discipline for seeing wholes
• A framework for seeing interrelationships, for seeing patterns of change rather than static
“snapshots”
• A set of general principles—distilled over the course of the twentieth century, spanning fields as
diverse as the physical and social sciences, engineering and management
• A specific set of tools and techniques
Senge and his colleagues [7] claimed that a good systems thinker, particularly in an organizational
setting, is someone who can see four levels operating simultaneously: events, patterns of behavior,
systems, and mental models. It is systems thinking that brings the disciplines of personal mastery,
mental models, shared vision and team learning all together.
According to Richmond [8], “Systems thinking is the art and science of making reliable inferences
about behavior by developing an increasingly deep understanding of underlying structure”.
Richmond [9] uses the paraphrase “forest thinking” to clarify the concept of systems thinking.
According to Richmond [9], “forest thinking” involves a “view from 10,000 m rather than focusing on
local trees” and “considering how the system influences systems on the other side of the line and how
these latter systems influence the former system”.Systems 2018, 6, 29 3 of 14
Richmond [10] presents four key questions about the term “systems thinking”: What is it? Why is
it needed? What works against its being adopted on a broader scale? And finally: What can we do to
increase both the speed and breadth of its adoption?
In Richmond’s [10,11] opinion, systems thinking is a continuum of activities that range from the
conceptual to the technical. The adoption of systems thinking occurs when we are standing back
far enough—in both space and time—to be able to see the underlying web of ongoing, reciprocal
relationships, interacting cycling to produce the patterns of behavior that a system is exhibiting.
You are employing a systems perspective when you can see the forest (of relationships), for the trees.
You are not employing a systems perspective when you get “trapped in an event”.
The term “thinking” combines learning and knowledge and includes various concepts such
as: parallel thinking, holistic thinking, reductionist thinking, critical thinking, creative thinking, etc.
The constructivism theory suggests that the human being is an active learner who constructs his/her
knowledge of experience on his/her efforts to give meaning to that experience. In the study presented
here, students were required to construct their knowledge by means of active experience and learning.
Social constructivism suggests that learners learn concepts or construct meaning about ideas
through their interaction with others and with their world, and through interpretations of that world
by actively constructing meaning [12].
One of the better-known researchers that refers to social constructivism theory is Vygotsky [12],
who states that ‘learners construct knowledge or understanding as a result of thinking and doing in
social contexts’.
By implementing systems thinking, learners relate new knowledge to their previous knowledge
and experience.
Systems thinking literature includes a vast range of areas of investigation, dealing mainly with
the analysis of complex organizations [1,13–17], social systems, economics, curriculum design [18],
social work, psychology, addiction therapy, the human body as a system, health, business, banking,
personal interrelationships, the global state of affairs, environment [19], instruction methodologies for
groups and teams [20,21], scientific and technological education [22], decision making [23], and project
management [24].
Traditional linear thinking approaches work against an understanding of how the different parts
of an organization or business work together and underplay or ignore the multifaceted nature of
complex problems. It has become essential to change the nature of the curriculum to emphasize the
interconnectedness of the various aspects of businesses and organizational systems as a whole [25].
It is clear that systems education, from informal learning to formal educational programs, is at
the foundation of the key leverages to develop new ways of more holistic thinking to ensure systemic
decision and policy making. The combination of capacity building with activities in which appropriate
systems tools are being used by the end-users who will directly benefit is a critical success factor for
long-term change in the way that management decisions and policy making can become systemic,
rather than focusing on treating the symptoms [25,26]. Formal education in systems thinking has
become essential. Many efforts are being put into ways to “infiltrate” the traditional teaching of
disciplines as isolated units and to apply the systems approach in schools, universities and informal
teaching programs (e.g., [25–30]). These programs can contribute significantly to the efforts of the
systems community in making systems thinking and systems education become integrated into society.
Research literature presents evidence of efforts to develop systems thinking through task-oriented
software, group dynamics, education, and training [31,32], demonstrating that systems thinking may
be acquired or learned in a variety of ways.
Badurdeen et al. [33] presented developing and teaching a multidisciplinary course in systems
thinking for sustainability. One of the reasons for using systems thinking to approach sustainability is
because systems thinking is an appropriate education approach to complex problems and could be
provided a kind of common language for students from different disciplines.
Another example is integrating systems thinking into sustainable manufacturing assessment.Systems 2018, 6, 29 4 of 14
Zhang et al. [34] presented a system of system methodologies grid in a sustainability
engineering setting, where different sustainable manufacturing problems have been associated with
system methodologies.
Zhang et al. [35] presented a novel approach using systems thinking principles to enhance
sustainable manufacturing research and manufacturing system sustainability management. According
to Zhang [35], this approach will not only benefit engineering management research by adopting
systems thinking philosophies in emerging sustainable manufacturing research and practice, but will
also assist enterprises in making strategic, tactical, and operational decisions by providing a deep
understanding of the behavior change over time. It was also found that success in this process is of
great importance to teachers/instructors/managers.
Students and graduates that demonstrate high levels of systems thinking are able to analyze
customer needs and demonstrate an aptitude for coping with multidisciplinary problems in the
business world.
For example, Kordova and Frank [27] conducted a capstone project with engineering students
to examine whether such a multifaceted assignment discernibly improved systems thinking among
participants. In this learning environment, the students constructed their own knowledge through
active learning and interaction with their teammates and teaching staff. As such, the project-based
learning environment supports the constructivist approach to teaching [27,36].
Some researchers refer to systems thinking as an innate ability. For instance, Hitchins [37]
states that the human brain can see similarities of patterns between disparate sets of information,
which presumably emanate from its drive to reduce perceived entropy, while Frank [38], Davidz and
Nightingale [31] concluded that this ability is most likely a combination of innate talent and
acquired experience.
Research Objectives
The research was conducted in two stages; the first stage examined factors that may potentially
provide the greatest benefit in systems thinking for students and graduates of technology management.
The main questions were as follows:
1. To what extent is it possible to train students and graduates for a systems-oriented position?
2. To what extent is the tendency towards systems thinking linked to personality traits?
3. To what extent is there a correlation between systems thinking capacity and supervisor evaluation?
The second stage of the study examined the extent to which it is possible to develop systems
thinking capability within the framework of a designated course. Study questions were as follows:
1. To what extent is it possible to develop systems thinking capability through a designated course
teaching the foundations and basic tools of systems thinking?
2. To what extent do differences exist in the ability to learn and develop systems thinking capabilities
between people from different disciplines?
3. Methodology
3.1. Study Population
Stage 1:
The study population included two groups:
• The first group included 55 master’s degree students from a management and technology faculty.
• The second group included 38 graduates involved in development projects in three companies
that develop integrated systems for defense and homeland security applications.Systems 2018, 6, 29 5 of 14
Stage 2:
The study population included 21 industrial engineering and management students,
15 mechanical engineering students, and 12 psychology students.
3.2. Study Tools
Stage 1:
The first study tool was the CEST (capacity for engineering systems thinking) assessment
questionnaire [39]. The capacity for engineering systems thinking characterizes the individual and can
be evaluated and predicted.
The questionnaire was distributed to the first group in stage 1, before and after completing
various graduate courses in systems engineering. It included 40 statement pairs, with items focusing
on preferences, specifically likes and dislikes towards activities, jobs, professions, or other personality
types. Respondents were asked to choose between the two statements according to their preference in
each statement pair (A marking preference for the first statement and B for the second).
Here are two example items from the questionnaire:
• Item No. 17
A. I think that every employee should gain interdisciplinary knowledge and general
knowledge in several fields.
B. I think that every employee should become an expert in his/her field. Learning more fields
may lead to sciolism (to know a little about many subjects).
• Item No. 22
A. I like to discuss the needs with the customer.
B. B. I prefer to leave the contact with the customer to marketing experts.
The participants of the second group of stage 1 were asked to complete the CEST assessment
questionnaire [39] and also the MBTI (Myers-Briggs Type Indicator) personality type test [40].
Additionally, supervisor evaluations were conducted to assess respondents’ systems thinking
capabilities [41].
The MBTI test is a tool to evaluate personality types using a psychometric questionnaire. The goal
of the test is to help people identify their dominant preferences, tendencies, and personality traits.
The questionnaire is based on the premise that people have four psychological functions through
which they experience the world: Natural energy orientation, Way of perceiving or understanding and
taking in information, Way of forming judgments and making choices and decisions, Action orientation
towards the outside world (Lifestyle).
The result of this questionnaire is one of the 16 character archetypes, as shown in Figure 1.
The current study examined the connection between self-reported dominant personality traits
(according to the MBTI research tool) and respondents’ systems thinking capacity.
We examined a different kind of reliability and validity of the CEST (capacity for engineering
systems thinking) assessment questionnaire. Two types of reliability were calculated: inter-judges
reliability and alpha coefficient reliability. Four types of validity are presented: content validity,
concurrent validity, contrasted group validity, and constructed validity.
Stage 2:
As a continuation of stage 1 of the study, we examined the extent to which it is possible to develop
systems thinking capability through engaging in a designated course aimed at teaching systems
thinking foundations and basic tools.Systems 2018, 6, 29 6 of 14
The course was based on Senge’s book The Learning Organization [1], and on Richmond’s
approach [8,9] to thinking skills. The course included basic foundations of systems thinking and
the five disciplines of a learning organization (personal skills and personal vision, mental models,
creating a shared vision, group learning, and systems thinking).
The course stresses the ways in which changes in thinking are created and the use of the
systems prototypes.
Systems 2018, 6, x FOR PEER REVIEW 6 of 14
Figure 1. MBTI character archetypes.
Figure 1. MBTI character archetypes.
The 14-week course was conducted with two separate classes, comprised of students studying
industrial
The 14-week engineering and management
course was and who
conducted with were also classes,
two separate employed in the industry
comprised during studying
of students their
studies.engineering and management and who were also employed in the industry during
industrial
During the course, the students were exposed to the theoretical approach at the base of systems
their studies.
thinking and, in addition, practiced analyzing events and processes using the classic Senge
During the course, the students were exposed to the theoretical approach at the base of
prototypes [1]. Moreover, the students presented examples from their personal experience at work
systems thinking and, in addition, practiced analyzing events and processes using the classic Senge
and from their daily reality. These examples were also examined using the systems tools.
prototypesThe [1].research
Moreover, the students
hypothesis presented
was that examples
by integrating fromthinking
systems their personal
tools inexperience at work and
analyzing systems
from processes,
their dailythe reality. These examples were also examined using the systems tools.
students will acquire systems thinking skills, and improve their system thinking
The research
abilities hypothesis
when faced was thatproblem
with a complex by integrating systems thinking tools in analyzing systems
in their organization.
processes,Table
the students will acquire
1 shows some systems
examples of howthinking
to use theskills, and improve
prototypes to analyzetheir system thinking abilities
events.
when faced with a complex problem in their organization.
Table 1. Examples of using the classic Senge prototypes.
Table 1 shows some examples of how to use the prototypes to analyze events.
Event Tools for Analysis
An enterprise is interested in dealing with a “Moving the problem” archetype—instead of solving it
high percentage of defective products in the examines the shifting of a specific problem to other solutions
production line by enlarging the required because the problem is unclear or because dealing with it
production quantities instead of establishing a comes at a high price. This is what happens when onlySystems 2018, 6, 29 7 of 14
Table 1. Examples of using the classic Senge prototypes.
Event Tools for Analysis
An enterprise is interested in dealing with a “Moving the problem” archetype—instead of solving it
high percentage of defective products in the examines the shifting of a specific problem to other
production line by enlarging the required solutions because the problem is unclear or because
production quantities instead of establishing a dealing with it comes at a high price. This is what happens
process that minimizes defective products. As a when only symptoms of the problem are addressed and
result, a situation in which surplus inventory not the root cause. The problem can than re-occur, in the
which cannot always be sold occurs. same form but also in another department.
“Success to the Successful” archetype—in which resources
are allocated to the most successful activity, which makes
Conflict between consumption and savings the unsuccessful ones even more unsuccessful because they
receive fewer resources. This is not necessarily the best
policy for the long term.
The same CEST questionnaire distributed during stage 1 was also distributed twice in the second
stage of the study—before embarking on the course and after completing it.
4. Results and Discussion
Stage 1:
Table 2 presents the comparative average scores of graduate management and technology students
before and after the systems engineering course. The course lasted two semesters, and respondents
completed the Frank questionnaire at three stages: at the beginning of the course, the end of the first
half, and the end of the second half.
Table 2. Paired samples test.
Paired Differences
95% Confidence Interval
Std. Std. Error Sig.
Mean of the Difference t df
Deviation Mean (2-Tailed)
Lower Upper
total_pre–
Pair 1 −2.63889 6.50069 1.53223 −5.87161 0.59383 −1.722 17 0.103
total_post1
total_post1–
Pair 2 18.12500 32.75583 7.32443 2.79480 33.45520 2.475 19 0.023
total_post2
total_pre–
Pair 3 18.19444 34.45805 8.12184 1.05886 35.33003 2.240 17 0.039
total_post2
The results of stage 1 are first shown in IEEM 2015 [26].
Table 2 shows no significant difference between average scores of respondents at onset of the
course and the end of the first semester (Sig. = 0.103). There was a significant difference between the
mean score of respondents at the end of the first semester when compared to the end of the course
(Sig. = 0.023). A significant difference was also found between the average score of respondents at
onset and course conclusion (Sig. = 0.039).
These results were first presented at IEEM 2015 [28] and are in line with previous studies such
as [27,31,32,38].
From these results, we can conclude that the second course provided more systems thinking tools
than the first course.
One explanation for this is the nature of the course given in the second semester, which mainly
dealt with systems content, as opposed to the course given in the first semester, which focused on
specific content.
According to these studies, engineers or managers can report about themselves or others—that
they notice details or immediately see the big picture.Systems 2018, 6, 29 8 of 14
Stage 1 of this study supports these findings. A significant correlation was found between
supervisor ranking of systems thinking capabilities and average scores of filled-in Frank questionnaires
(Sig. = 0.000, r = 0.855).
The respondents were asked to provide self-reports on their personal desire to engage in
systems-related projects; a significant correlation was found between this evaluation and the results of
the Frank questionnaire (Sig. = 0.000, r = 0.763).
In contrast to these findings, no correlation was found between capacity for engineering systems
thinking and years of employment experience.
The established possibility of distinguishing engineering systems thinking capacity, even after
only a few years of work experience, proves that apparently there are additional factors that strengthen
systems thinking acquisition. Among these factors, there is also the notion of inherent potential—which
seems to be an inseparable
Systems 2018, 6, x FORpart of those candidates who received high systems
PEER REVIEW 8 of 14 thinking scores,
even with little work The experience (measured in years).
established possibility of distinguishing engineering systems thinking capacity, even after
In addition toonlyall a few years of work experience, proves that apparently there are additional factors that
of the findings mentioned above, respondents were divided into personality
strengthen systems thinking acquisition. Among these factors, there is also the notion of inherent
groups according to the MBTIseems
potential—which questionnaire.
to be an inseparable part of those candidates who received high systems
thinking scores, even with little work experience (measured in years).
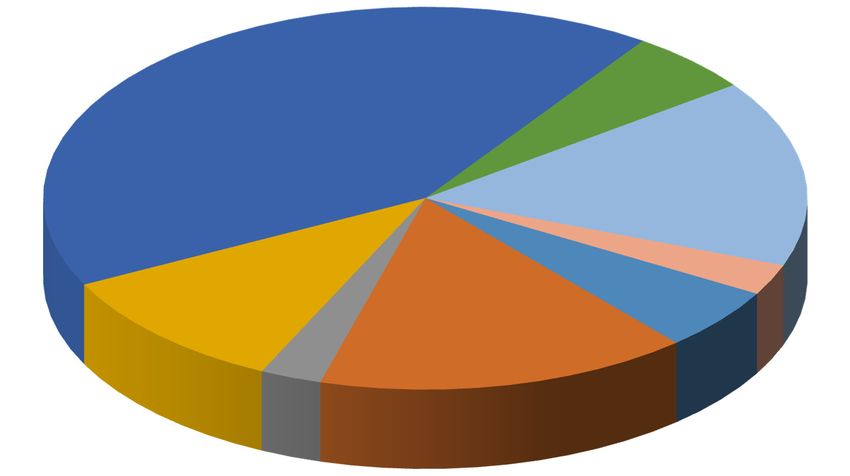
Study findings also support Meade’s results [42], according to which 57.9% of respondents belong
In addition to all of the findings mentioned above, respondents were divided into personality
to the STJ (Sensing,groups
Thinking,
accordingJudging) group. Character archetype distribution is presented in Figure 2.
to the MBTI questionnaire.
Study findings also support Meade’s results [42], according to which 57.9% of respondents
This finding emphasizes the fact that
belong to the STJ (Sensing, Thinking,a significant
Judging) group.percentage of distribution
Character archetype respondents belong to particular
is presented
in Figure 2. This
personality groups with unique traits. finding emphasizes the fact that a significant percentage of respondents belong to
particular personality groups with unique traits.
INTJ
5%
ESTJ
42%
ISTJ
16%
ESFJ
10% ENTJ
16%
ISTP
3%
ENFP
5%
ENTP
3%
Figure 2. Character archetype distribution according to MBTI questionnaire.
Figure 2. Character archetype distribution according to MBTI questionnaire.
Stage 2:
Analysis of questionnaire results showed no significant difference between average scores
Stage 2: before the designated systems thinking course (Time 1) and after its completion (Time 2) (t = −0.61,
Sig. = 0.5476).
Analysis of Table 3 illustrates results
questionnaire independentshowed
samples t-test
no outcomes.
significant difference between
average scores
before the designated systems thinking course
Table 3. (Time 1) and after its completion (Time 2) (t = −0.61,
t-Test Outcomes.
Sig. = 0.5476). Time N Mean Std Dev Std Err Minimum Maximum
1 21 54.00 8.69 1.89 39.00 66.00
Table 3 illustrates independent
2 18
samples
55.67
t-test
8.37
outcomes.
1.97 36.00 72.00
Diff (1-2) −1.67 8.54 2.74
Time Mean Table95% CL Mean Outcomes.
3. t-Test Std Dev 95% CL Std Dev
1 54.00 50.04 57.95 8.69 6.65 12.55
2 55.67 51.50 59.83 8.37 6.28 12.55
Time DiffN(1-2) −1.67Mean−7.23 Std
3.89 Dev 8.54 Std Err
6.96 Minimum
11.05 Maximum
1 Method
21 Variance
54.00DF T Value 8.69 Pr > |t| 1.89 39.00 66.00
2 Pooled
18 Equal55.67 37 −0.61
8.37 0.5476 1.97 36.00 72.00
Diff (1-2) −1.67 8.54 2.74
Time Mean 95% CL Mean Std Dev 95% CL Std Dev
1 54.00 50.04 57.95 8.69 6.65 12.55
2 55.67 51.50 59.83 8.37 6.28 12.55
Diff (1-2) −1.67 −7.23 3.89 8.54 6.96 11.05
Method Variance DF T Value Pr > |t|
Pooled Equal 37 −0.61 0.5476Systems 2018, 6, 29 9 of 14
Systems 2018, 6, x FOR PEER REVIEW 9 of 14
Figure
Figure 33 shows
shows the normal theoretical
the normal theoretical quantiles
quantiles at
at both
both time
time points
points (course
(course onset
onset on
on the
the left and
left and
course completion on the right). According the results of the Q-Q plots, the difference scores
course completion on the right). According the results of the Q-Q plots, the difference scores were were not
normally distributed.
not normally distributed.
Figure 3. Q-Q Plots.
Figure 3. Q-Q Plots.
Since normal distribution was not met, we used the Wilcoxon non-parametric test to compare
Since before
the scores normalanddistribution
after the was not met, we used the Wilcoxon non-parametric test to compare the
course.
scores before
The andof
results after the 4course.
Table clearly illustrate no significant difference between scores at both time
points (Sig. = 0.6881). 4 clearly illustrate no significant difference between scores at both time points
The results of Table
(Sig. This
= 0.6881).
result may be explained in several ways:
This result may be explained in several ways:
1. Small sample size. It is necessary to examine a larger group of students in order to draw stronger
1. Small sample size. It is necessary to examine a larger group of students in order to draw stronger
and more established conclusions.
and more established conclusions.
2. The present course format/curriculum failed to help develop participant systems thinking
2. The present course format/curriculum failed to help develop participant systems thinking
capabilities; it might be necessary to revise the course curriculum and/or teaching methods.
capabilities; it might be necessary to revise the course curriculum and/or teaching methods.
3. The course was given to industrial engineering and management students. Perhaps these
3. The course was given to industrial engineering and management students. Perhaps these students
students have intrinsically high systems thinking capabilities and the course induced no
have intrinsically high systems thinking capabilities and the course induced no improvement in
improvement in their systems thinking.
their systems thinking.
Table 4. Wilcoxon two-sample test.
Table 4. Wilcoxon two-sample test.
Wilcoxon Two-Sample Test
Statistic (S) 374.5
Wilcoxon Two-Sample Test
Exact Test
Statistic (S) 374.5
Two-Sided Pr >= |S – Mean| 0.6881
Exact Test
Two-Sided Pr >= |S – Mean| 0.6881
In order to examine the last hypothesis, questionnaires were distributed to two groups whose
members did not study the course: one group of students studying mechanical engineering and a
In order to examine the last hypothesis, questionnaires were distributed to two groups whose
second group of students studying towards their bachelor’s degree in psychology.
members did not study the course: one group of students studying mechanical engineering and a
Table 5 presents the analysis of variance when comparing total questionnaire scores among
second group of students studying towards their bachelor’s degree in psychology.
mechanical engineering, industrial engineering and management, and psychology students. This
Table 5 presents the analysis of variance when comparing total questionnaire scores among mechanical
comparison was carried out during Time 1 only.
engineering, industrial engineering and management, and psychology students. This comparison was
carried out during Time 1 only.Systems 2018, 6, 29 10 of 14
Systems 2018, 6, xTable 5. ANOVA
FOR PEER REVIEW comparing total score among three groups (Time 1 only). 10 of 14
Source Table 5.
DF ANOVA comparing total score among
Sum of Squares three
Mean groups (TimeF1Value
Square only). Pr > F
Model Source 2 DF 1777.65
Sum of Squares 888.82
Mean Square 8.05 Pr > F
F Value 0.0010
Error Model 45 2 4971.60
1777.65 110.48
888.82 8.05 0.0010
Corrected Total Error 47 45 6749.25
4971.60 110.48
R-Square Corrected Total
Coeff Var 47 Root MSE 6749.25 Grade Mean
R-Square Coeff Var Root MSE Grade Mean
0.263 22.30 10.51 47.12
0.263 22.30 10.51 47.12
Source Source
DF DF
Type III SS
Type III SS
Mean Square
Mean Square
F Value
F Value Pr > F
Pr > F
Group Group 2 2 1777.65
1777.65 888.82
888.82 8.058.05 0.0010 0.0010
TableTable 5 shows a significant difference exists between the three groups in total questionnaire
5 shows a significant difference exists between the three groups in total questionnaire scores at
scores at Time 1 (Sig. = 0.0010). Figure 4 indicates that the average scores of industrial engineering
Time 1 (Sig. = 0.0010). Figure 4 indicates that the average scores of industrial engineering and management
and management students were higher compared to those of mechanical engineering and psychology
students were higher compared to those of mechanical engineering and psychology students.
students.
Figure 4. Grade distribution of the three groups.
Figure 4. Grade distribution of the three groups.
Multiple comparisons were carried out to determine whether significant differences exist in total
scores among
Multiple the three groups,
comparisons as presented
were carried out toindetermine
Table 6. whether significant differences exist in total
scores among the three groups, as presented in Table 6.
Table 6. Tukey studentized range (HSD) test.
Means withTable TukeyLetter
6. Same
the studentized range
Are Not (HSD) test.Different
Significantly
Tukey Grouping Mean N Group
Means with
A the Same Letter
54.0 Are
21 Not Significantly Different
Industrial engineering
B
Tukey Grouping 42.4
Mean 15
N Mechanical engineering
Group
C 41.0 12 Psychology
A 54.0 21 Industrial engineering
B 42.4 15 Mechanical engineering
Since normal distribution
C was not met, 41.0we also
12 used a Kruskal-Wallace
Psychology non-parametric test to
compare the three groups’ total scores. Table 7 shows that a significant difference was found among
the three groups (Sig. = 0.0028).
Since normal distribution was not met, we also used a Kruskal-Wallace non-parametric test to
compare the three groups’ total scores. Table 7 shows that a significant difference was found among
the three groups (Sig. = 0.0028).Systems 2018, 6, 29 11 of 14
Table 7. Kruskal-Wallace Test (Time 1 only).
Sum of Scores Expected under Std Dev under Mean
Group N
Wilcoxon Scores H0 H0 Score
Industrial 21 678.00 514.50 47.96 32.28
Mechanical 15 REVIEW
Systems 2018, 6, x FOR PEER 290.50 367.50 44.8111 of 14 19.36
Psychology 12 207.50 294.00 41.86 17.29
Table 7. Kruskal-Wallace Test (Time 1 only).
Kruskal-Wallis Test
Sum of Scores Wilcoxon Expected under Std Dev under Mean
Chi-Square Group N
11.76 Scores H0 H0 Score
DF Industrial 2
21 678.00 514.50 47.96 32.28
Mechanical
Pr > Chi-Square 15
0.0028 290.50 367.50 44.81 19.36
Psychology 12 207.50 294.00 41.86 17.29
Kruskal-Wallis Test
Chi-Square 11.76
Figure 5 presents
DF score 2 distribution among the different groups. Industrial engineering and
management students demonstrated
Pr > Chi-
0.0028 an innate tendency for higher levels of systems thinking capability
Square
compared to mechanical engineering and psychology students.
One possible explanation
Figure for this
5 presents score finding
distribution maythebedifferent
among related to theIndustrial
groups. structured differences
engineering and between
management students
industrial engineering demonstrated students
and management an innate tendency
and those for higher levels who
students of systems
studythinking
other fields. It is
capability compared to mechanical engineering and psychology students.
reasonable to assume that among
One possible explanationpeople
for thiswho have
finding a systems
may be thinking
related to the structuredapproach, there is a tendency
differences between
to choose a multi-disciplinary
industrial engineering and profession
managementwhich,studentsby
andits very
those definition,
students who study requires systems
other fields. It is thinking.
This means reasonable
that people to assume
withthatanamong people
innate who havethinking
systems a systems thinking approach,
approach willthere is a tendency
prefer a profession that
to choose a multi-disciplinary profession which, by its very definition, requires systems thinking.
is systems-oriented,
This meanssuch as industrial
that people with an innateengineering andapproach
systems thinking management,
will prefer while those
a profession thatwhose
is natural
tendency is to see details will
systems-oriented, suchchoose a profession
as industrial engineeringthat
and requires
management, paying
while attention
those whosetonatural
the small details.
tendency
Similar findings is to see
to these details will
results were choose
alsoa presented
profession that
isrequires
Kordova’spayingprevious
attention to study
the small details.
[28,36].
Similar findings to these results were also presented is Kordova’s previous study [28,36].
Figure 5. Grade distribution of the three groups—Time 1.
Figure 5. Grade distribution of the three groups—Time 1.
5. Summary and Conclusions
5. Summary andThis study examined
Conclusions whether it is possible to train engineers and graduates for a systems-
oriented position in a formal teaching environment such as systems engineering courses or systems
This study examined
design. whether
The different coursesit is possible
teach to train
the engineering engineers
design and
process, and graduates
during fora systems
the course, a systems-oriented
position in amodel
formalis built; a model based on a structure related to requirements, functions, components and tests.
teaching environment such as systems engineering courses or systems design.
The full model also includes systems scenarios, material and design interfaces, as well as outputs and
The differentinputs.
courses teach the engineering design process, and during the course, a systems model is
built; a model based on a structure related to requirements, functions, components and tests. The full
model also includes systems scenarios, material and design interfaces, as well as outputs and inputs.
The main goals of these courses are: to provide knowledge about product design and development
processes; to provide knowledge about different technologies in different business environments;
to learn about methodologies and tools used for product and services design and development; to giveSystems 2018, 6, 29 12 of 14
students self-confidence in their personal ability to initiate and design new products/services, as well
as to present and “sell” their ideas and products to clients for design and development projects.
These subjects are a main part of systems engineering studies; however, according to the results of
the first part of the study, these courses focused primarily on specific engineering design processes and
did not provide sufficient tools for developing systems thinking skills among the course participants.
One of the study groups participated in an engineering design course, which was taught over a
two-semester period as part of the master’s degree program for systems engineering. The course lasted
two semesters, and respondents completed the CEST questionnaire [39] at three different time points:
at the beginning of the course, the end of the first semester, and the end of the second semester.
The results showed that there was no significant difference between systems thinking skills before
the course and after the first semester. However, a significant difference was found between the
students’ average score at the end of the first semester and their average score at the end of the course.
In addition, a significant difference was found between the students’ average score before the course
and their average score at the end of the second semester.
From these results, we can conclude that the second part of the course provides systems
thinking tools to a greater extent than the first part of the course, which mainly focused on specific
engineering design.
These results also show that it is necessary to create a systems thinking study course that deals
with specific methodologies and systems thinking tools. These findings are in line with the results
of Davidz and Nightingale [31] and Kasser [32], which showed that it is possible to acquire systems
thinking through education and training.
The study also examined the systems thinking skills of systems engineers as opposed to other
engineers who are partners in systems projects. It was found that the systems engineers’ score on the
systems thinking questionnaire was significantly higher than the other engineers’ scores (Sig. = 0.000).
In addition, these engineers’ managers were asked to evaluate the engineers’ tendency towards
systems thinking and to rank them on an ordinal scale. A significant correlation was found between
this ranking and the score on the questionnaire that evaluated the engineers’ system thinking (r = 0.855,
Sig. = 0.000).
In contrast to these results, no correlation was found between the systems thinking score and
number of years’ experience acquired by the engineer.
These findings stress that systems engineers with high systems thinking skills are capable of
understanding the general/big picture—functionally and conceptually—even without understanding
all of the small details.
The study findings show that despite the difficulty to define systems thinking, people know how
to evaluate the systems thinking skills of their work colleagues, and to identify those who immediately
see the big picture compared to those who tend to look at the small details.
The finding that shows no correlation between systems thinking skills and number of years’
experience may indicate that additional factors exist which foster this ability.
The fact that it is often possible to distinguish a capacity for engineering systems thinking, even
after only a few years of work experience, proves that apparently there are additional factors that
strengthen systems thinking acquisition. Among these factors, there is also the notion of innate
potential—which seems to be an inseparable part of those candidates who received a high CEST score,
even though they had little work experience (in years) [28].
This finding supports Frank’s claim [38] that systems thinking is a combination of an acquired
ability and an innate talent.
The current study found that a link exists between personality type and systems thinking skills.
The study found that 57.9% of the engineers in the sample belonged to the sensing, thinking, judging
(STJ) personality type, according to the MBTI questionnaire. This finding emphasizes that a large
percentage of engineers have unique personalities and traits.Systems 2018, 6, 29 13 of 14
The second part of the study presented a preliminary attempt to develop a systems thinking
study course. Since this is a pilot course, additional studies are needed with diverse sample groups
in order to strengthen the claim that this type of course is likely to improve its participants’ systems
thinking skills.
Author Contributions: S.K.K. was the main researcher of this study who prepared the literature review,
developed the study design and analyzed the results. M.F. developed the CEST (capacity for engineering
systems thinking) assessment questionnaire and conducted several studies for assessing the reliability and validity
of the questionnaire. A.N.M. conducted the pilot course presented at this paper. The main goal of this course was
to develop systems thinking capability.
Funding: This research was supported by Gordon Center for Systems Engineering at the Technion—Israel Institute
of Technology.
Acknowledgments: The authors would like to thank Guy Ribnikov for his contribution for the study findings.
Conflicts of Interest: The authors declare no conflict of interest.
References
1. Senge, P.M. The Fifth Discipline: The Art and Practice of the Learning Organization; Doubleday: New York, NY,
USA, 1991.
2. Bertalanffy, L. Problems of Life; John Wiley & Sons: New York, NY, USA, 1954.
3. Bertalanffy, L. General System Theory; George Braziller Inc.: New York, NY, USA, 1968.
4. Bertalanffy, L. General Systems Theory: Foundations, Development, Applications; George Braziller Inc.: New York,
NY, USA, 1969.
5. Sterman, J.D. Business Dynamics: Systems Thinking and Modeling for a Complex World; McGraw-Hill: New York,
NY, USA, 2000.
6. Sterman, J.D. Does Formal System Dynamics Training Improve People’s Understanding of Accumulation?
Syst. Dyn. Rev. 2010, 26, 313–334. [CrossRef]
7. Senge, P.M.; Klieiner, A.; Roberts, C.; Ross, R.B.; Smith, B.J. The Fifth Discipline Fieldbook: Strategies and Tools
for Building a Learning Organization; Currency Doubleday: New York, NY, USA, 1994.
8. Richmond, B. System dynamics/systems thinking: Let’s just get on with it. In Proceedings of the International
System Dynamics Conference, Sterling, Scotland, 11–15 July 1994; pp. 135–157.
9. Richmond, B. The “Thinking” in Systems Thinking: Seven Essential Skills; Pegasus Communications: Waltham,
MA, USA, 2000.
10. Richmond, B. Systems Thinking-Four Key Questions; High Performance Systems, Inc.: Honolulu, HI, USA,
1991.
11. Richmond, B. Systems Thinking: Critical Thinking Skills for the 1990s and Beyond. Syst. Dyn. Rev. 1993, 9,
113–133. [CrossRef]
12. Vygotsky, L.S. Thought and Language; MIT Press: Cambridge, MA, USA, 1986.
13. Ullmer, E.J. Work Design in Organizations: Comparing the Organizational Elements Model and the Ideal
System Approach. Educ. Technol. 1986, 26, 12–18.
14. Shenhav, Y. From Chaos to Systems: The Engineering Foundation of Organization Theory. Adm. Sci. Q. 1995,
40, 557–585. [CrossRef]
15. Nadler, G. The Planning and Design Approach; John Wiley & Sons, Inc.: Hoboken, NJ, USA, 1981.
16. Kaufman, R.A. Holistic Planning Model: A System Approach for Improving Organizational Effectiveness
and Impact. Perform. Instr. J. 1983, 22, 3–12. [CrossRef]
17. Katz, D.; Kahn, R.L. The Social Psychology of Organizations; Wiley: New York, NY, USA, 1978.
18. Dror, Y.A. System Approach towards the Integration of Curriculum Elements. In International Seminar
School-Based Curriculum Development; Tel Aviv University: Tel Aviv, Israel, 1984.
19. O’Connor, J.; Mcdermott, I. The Art of Systems Thinking; Thorsons: San Francisco, CA, USA, 1997.
20. Matthews, C.O. An Application of General System Theory (GST) to Group Therapy. J. Spec. Group Work 1992,
17, 161–169. [CrossRef]
21. Whitner, P.A. Gestalt Therapy and General System Theory; The University of Toledo Press: Columbus, OH,
USA, 1985.Systems 2018, 6, 29 14 of 14
22. Chen, D.; Stroup, W. General System Theory: Toward a Conceptual Framework for Science and Technology
Education for All. J. Sci. Educ. Technol. 1993, 2, 447–459. [CrossRef]
23. Graczyk, S.L. Get with the System: General Systems Theory for Business Officials. Sch. Bus. Aff. 1993, 59,
16–20.
24. Lewis, J.P. Mastering Project Management: Applying Advanced Concepts of Systems Thinking, Control and
Evaluation, Resource Allocation; McGraw-Hill: New York, NY, USA, 1998.
25. Bosch, O.; Nguyen, N.; Sun, D. Addressing the critical need for a “new way of thinking” in dealing with
complex issues facing our societies. Bus. Syst. Rev. 2013, 2, 48–70.
26. Robert, O.B. Systems Education for a Sustainable Planet; MDPI: Basel, Switzerland, 2018.
27. Kordova, S.; Frank, M. The T-Shape Dilemma (Depth versus Width) in Education of Industrial Engineering
& Management and Its Reflection in the Students Team Project. Ph.D. Thesis, Technion-Israel Institute of
Technology, Haifa, Israel, 2010.
28. Kordova, S.; Frank, M. Systems thinking—Innate or learned? Recent study findings. In Proceedings of
the 2015 IEEE International Conference on Industrial Engineering and Engineering Management (IEEM),
Singapore, 6–9 December 2015; pp. 1490–1493.
29. Bosch, O.; Nguyen, N.; Maeno, T.; Yasui, T. Managing complex issues through evolutionary learning
laboratories. Syst. Res. Behav. Sci. 2013, 30, 116–135. [CrossRef]
30. Bosch, O.; Nguyen, N.; Ha, T. Can advancements in economic and managerial practice be achieved without
systems thinking education as the foundation? Bus. Syst. Rev. 2014, 3, 33–53.
31. Davidz, H.L.; Nightingale, D.J. Enabling systems thinking to accelerate the development of senior systems
engineers. Syst. Eng. 2008, 11, 1–14. [CrossRef]
32. Kasser, J. A Proposed Framework for a Systems Engineering Discipline. In Proceedings of the Conference on
Systems Engineering Research, Hoboken, NJ, USA, 14–16 March 2007; pp. 1–14.
33. Badurdeen, F.; Gregory, R.; Luhan, G.A.; Schroeder, M.; Vincent, L.V.; Sekulic, D.P. Systems Thinking for
Sustainability: Envisioning Trans-disciplinary Transformations in STEM Education. Learning 2012, 11, 12.
34. Zhang, H.; Calvo-Amodio, J.; Haapala, K.R. Establishing foundational concepts for sustainable
manufacturing systems assessment through systems thinking. Int. J. Strateg. Eng. Asset Manag. 2015,
2, 249–269. [CrossRef]
35. Zhang, H.; Calvo-Amodio, J.; Haapala, K.R. A Systems Thinking Approach for Modeling Sustainable
Manufacturing Problems in Enterprises. In Proceedings of the International Annual Conference (IAC) of the
American Society for Engineering Management (ASEM), Minneapolis, MN, USA, 2–5 October 2013; pp. 3–5.
36. Frank, M.; Shaked, H.; Kordova, S. Systems Thinking—Foundation, Uses and Challenges; Nova Science
Publishers: Hauppauge, NY, USA, 2016.
37. Hitchins, D.K. Advanced Systems Thinking, Engineering, and Management; Artech House: Boston, MA, USA,
2003.
38. Frank, M. Knowledge, Abilities, Cognitive Characteristics and Behavioral Competences of Engineers with
High Capacity for Engineering Systems Thinking. Syst. Eng. 2005, 9, 91–103. [CrossRef]
39. Frank, M. Assessing the Interest for Systems Engineering Positions and Other Engineering Positions’
Required Capacity for Engineering Systems Thinking. Syst. Eng. 2010, 13, 161–174. [CrossRef]
40. The Myers & Briggs Foundation. Available online: http://www.myersbriggs.org/ (accessed on 8 July 2018).
41. Ribnikov, G.; Kordova, S. Developing Systems Thinking among Systems Engineers. Master’s Thesis,
HIT-Holon Institute of Technology, Holon, Israel, 2014.
42. Meade, K. Majors, Personality Types, & Systems Thinking in Engineering; Final Project; School of Sustainable
Engineered Systems, Arizona State University: Tempe, AZ, USA, 2011.
© 2018 by the authors. Licensee MDPI, Basel, Switzerland. This article is an open access
article distributed under the terms and conditions of the Creative Commons Attribution
(CC BY) license (http://creativecommons.org/licenses/by/4.0/).You can also read


