Impact of Movement Control Order (MCO) due to Coronavirus Disease (COVID-19) on Food Waste Generation: A Case Study in Klang Valley, Malaysia - MDPI
←
→
Page content transcription
If your browser does not render page correctly, please read the page content below
sustainability

Article
Impact of Movement Control Order (MCO) due to
Coronavirus Disease (COVID-19) on Food Waste
Generation: A Case Study in Klang Valley, Malaysia
Muhammad Heikal Ismail 1, * , Tinia Idaty Mohd. Ghazi 1 , Muhammad Hazwan Hamzah 2 ,
Latifah Abd Manaf 3 , Ramli Mohd Tahir 4 , Ahadi Mohd Nasir 4 and Ammar Ehsan Omar 4
 1    Department of Chemical and Environmental Engineering, Faculty of Engineering, UPM Serdang 43400,
      Malaysia; tinia@upm.edu.my
 2    Department of Biological and Agricultural Engineering, Faculty of Engineering, UPM Serdang 43400,
      Malaysia; hazwanhamzah@upm.edu.my
 3    Department of Environment, Faculty of Forestry and Environment, UPM Serdang 43400, Malaysia;
      latifahmanaf@upm.edu.my
 4    KDEB Waste Management Sdn Bhd, Shah Alam 40000, Malaysia; ramli@kdebwm.com (R.M.T.);
      ahadi@kdebwm.com (A.M.N.); ammar@kdebwm.com (A.E.O.)
 *    Correspondence: heikal@upm.edu.my; Tel.: +60-3-9769-4676

 Received: 11 September 2020; Accepted: 12 October 2020; Published: 25 October 2020

 Abstract: The outbreak of a neurological disorder was first discovered as a new coronavirus
 (2019-nCoV) in Wuhan, China. The infection spread rapidly in China and throughout the world,
 including Malaysia. Malaysia recorded its initial case on 25 January 2020 with intensifying numbers
 since March 2020. Due to this uncertain circumstance, Malaysia has introduced the Movement
 Control Order (MCO) with the main aim of isolating the source of the COVID-19 outbreak, which was
 effective from 18 March 2020. The restriction has observed fewer vehicles on the road with industrial
 and commercial activities being suspended. The objective of the study is to quantify the effects of
 MCO to food waste generation in town and district areas of Klang Valley, Malaysia. Food waste
 generation data was derived from the Project Delivery Department, KDEB Waste Management on a
 daily basis before (19 February–17 March 2020) and during the MCO (18 March–14 April 2020) at
 12 local authorities in Selangor, Malaysia. The data was obtained with the limitation of assumption
 that there is no waste compositional analysis to be conducted in 2020. Despite the stay-at-home order,
 food waste data showed a descriptive reduction of up to 15.1% during the MCO. Statistical analysis of
 food waste generation from one-way variance has shown that municipal and district local authorities
 recorded a significant reduction (p < 0.50) during the MCO. The food waste reduction during the
 MCO will deliver as the evidence-based results to push the need for policies in Malaysia as per the
 goals outlined in Sustainable Development Goals of global food loss and waste.

 Keywords: food waste generation; food waste management; coronavirus disease; movement control
 order; Malaysia

1. Introduction
     Coronavirus disease, which was named as COVID-19 by World Health Organization (WHO), is
spreading rapidly in almost entire regions of Asia and sustainably in most countries in Europe and
North America. The COVID-19 cases were found to be even more acute than SARS-CoV. A cumulative
81,109 test cases were recorded globally by 25 February 2020. As of 3 July 2020, the confirmed COVID-19
cases skyrocketed to 11,084,490, due to the vulnerable spread of the pandemic with 526,397 deaths [1].

Sustainability 2020, 12, 8848; doi:10.3390/su12218848                     www.mdpi.com/journal/sustainability
Sustainability 2020, 12, 8848                                                                      2 of 17

Limited information about novel and pathogenic coronaviruses due to the lack of definite treatment
has become a challenging and truly rigorous situation for all global scientists [1].
      The first COVID-19 case in Malaysia was identified on 25 January 2020 with relatively few reported
cases and largely confined to imported cases. It was until localized clusters began to significantly
emerge from March 2020, breaching the 2000 active cases mark by the end of March, from less than
30 cases earlier that month. Such explosive COVID-19 pandemic in Malaysia has called for pragmatic
preventive measures to be implemented, including intensive case diagnosis, precise tracking, and
compulsory two-week quarantine. Therefore, the Malaysian government has declared the enforcement
of the Movement Control Order (MCO) as the strategy of flattening the pandemic curve [2].
      There has been a significant reduction in traffic and industrial emission since most industrial and
commercial activities were strictly not allowed during the first phase of MCO. Higher frequency of
activity at home due to stay-at-home orders has possibly increased the percentage of household waste
being produced through over-purchasing, especially the food waste. The household is the primary
source of Municipal Solid Waste (MSW) in Malaysia. According to Khazanah Research Institute (KRI),
the household sector generates 44.5% of the total solid waste collection data, amounting to 6.1 million
tonnes a year. MSW consists of 20 different categories including food waste, which made up 50% of
total waste composition [3].
      Food waste is defined as food that is qualified for safe consumption but discarded due to spoilage.
Lower-income countries have reportedly wasted food during the production phase, while middle and
high-income countries wasted food during the last phase of the household [4]. An increasing earning
will contribute to higher amount of food waste due to easier affordability to food access. Food waste
quantity is increasing by over-buying, which causes products to already expire before consumption.
Due to high organic content, food waste creates a variety of adverse effects on the environment.
Food waste disposal through landfilling is estimated to increase the emission of greenhouse gasses to
50% by 2020 [5].
      Food waste management can be summarized into three important phases: reduce the waste
at sources, redefine the purpose through feeding, and regenerate the value to power generation or
compost products.
      Local production disruption occurred at sources, because the livestock, particularly poultry,
depended heavily on imported animal feed. However, 16 out of 33 most commonly consumed
agricultural products have more than 100% self-sufficiency ratios (SSR) to indicate higher domestic
production. Food production must be well coordinated after the pandemic to reduce the effect on
unintended food waste generation. Food waste valorization into animal feed that was usually adopted
by the rural community could be also integrated to the urban settlers [6].
      Food waste sources in Malaysia were derived from residential, commercial, institutional,
commercial, and city areas. In this study, food waste generation is determined daily through
its correlated total MSW collection in respective local authorities in Malaysia. The researchers are
therefore statistically quantifying food waste generation to observe the significance of MCO towards
food waste generation for the municipal and district areas in Klang Valley. The study shall provide
the evidence-based consensus for further policy development in Malaysia in regard to food waste
generation towards sustainable waste management.

2. Methods

2.1. Data Collection
     In Malaysia, solid waste management is managed by Solid Waste Management and Public
Cleaning Corporation (SWCorp), under the Ministry of Housing and Local Government, JPSPN, local
authority, and private concessionaires. The concessionaires are responsible towards comprehensive
monitoring of the MSW in each state. Selangor, which is located in Klang Valley, is taken as the sample
of the study by taking parallel development in Malaysia. The Selangor state government has appointed
Sustainability 2020, 12, 8848 3 of 17
KDEB Waste Management as the private concessionaire to do the waste collection and public cleansing
starting 1 November 2018. In this study, the data on Domestic Waste Collection throughout Selangor
was conducted by the Project Delivery Department, KDEB Waste Management on a daily basis from
19 February 2020 to 14 April 2020 (Table 1) to determine the relative changes of MSW through a waste
weighting method.
Table 1. Duration of solid waste data collection in Selangor.
Collection Period Collection Duration Abbreviation
Four weeks before MCO 19–25 February 2020 4WB MCO
Three weeks before MCO 26 February–3 March 2020 3WB MCO
Two weeks before MCO 4–10 March 2020 2WB MCO
One week before MCO 11–17 March 2020 1WB MCO
Week 1 of Phase 1 of MCO 18–24 March 2020 W1 P1 MCO
Week 2 of Phase 1 of MCO 25–31 March 2020 W2 P2 MCO
Week 1 of Phase 2 of MCO 1–7 April 2020 W1 P2 MCO
Week 2 of Phase 2 of MCO 8–14 April 2020 W2 P2 MCO
MCO, movement control order.
The solid waste collection in Selangor covers a total of 12 local authorities, which were selected
in this study. The local authority is categorized by its criteria and can be easily identified through
its name as shown in Table 2. City Council (Majlis Bandaraya) refers to the city, usually the center
of administration that has a population no less than 500,000 with the annual income of more than
RM100 million. Municipal Council (Majlis Perbandaran) refers to the city usually main town areas that
have a population more than 150,000 and annual income of more than RM20 million. District Council
(Majlis Daerah) refers to the other areas not mentioned previously with a population less than 150,000
and annual income of less than RM20 million [7].
Table 2. List of local authorities selected in the solid waste collection in Selangor.
City Council Municipal Council District Council
Majlis Bandaraya Petaling Jaya (MBPJ) Majlis Perbandaran Ampang Jaya (MPAJ) Majlis Daerah Kuala Langat (MDKL)
Majlis Bandaraya Shah Alam (MBSA) Majlis Perbandaran Kajang (MPKj) Majlis Daerah Sabak Bernam (MDSB)
Majlis Perbandaran Klang (MPK) Majlis Daerah Hulu Selangor (MDHS)
Majlis Perbandaran Selayang (MPS) Majlis Daerah Kuala Selangor (MDKS)
Majlis Perbandaran Sepang (MPSp)
Majlis Perbandaran Subang Jaya (MPSJ)
2.2. Data Proportional
The average solid waste generation for the first week of Ramadhan in Selangor recorded a decline
to 1112.27 tonnes per day, compared to the similar period of 1884.67 tonnes per day the previous
year [8]. Waste composition in 2019 showed that food waste made up 51% of the total solid waste
collection. This percentage has been used as the origin of direct proportional in food waste collection
for the similar period in 2019 to 2020. Thus, food waste percentage of 40.9% was taken as the basis of
average solid waste composition during the MCO in 2020 [9].
2.3. Limitation of Study
Food waste percentage of 40.9% has been used as the proportional assumption in this study since
thorough waste compositional analysis could not be conducted in 2020.
2.4. Statistical Analysis
The published results are expressed as mean ± standard deviation (SD) of triplicates. Relative
change (%) was used in descriptive statistics to analyze total food waste generation against the collectionSustainability 2020, 12, 8848 4 of 17
period in Selangor [10]. One-way ANOVA was performed to determine the effect of MCO on food
waste generation in municipal and district areas. ANOVA test employed Tukey’s post hoc analysis.
Student’s t-test was used to compare food waste generation against local authorities. All statistical
analyses were conducted with SPSS software (v.12, IBM, SPSS, New York, USA) at a significance level
of 0.05. Difference in means is marked with a letter in figures.
3. Results and Discussion
3.1. Effect of MCO to Total Food Waste Generation in Selangor
Table 3 describes the total food waste collection in Selangor for the period of before and during the
MCO. Total food waste generation for the overall collection period is 104,201 tonnes with a standard
error of 381.16, standard deviation of 1008.4, and sample variance of 1,016,955.1. Food waste collection
for the previous four weeks before the MCO recorded a consistent trend of minimal relative change.
One week before the MCO, 13,927.44 tonnes of food waste was recorded across Selangor. A relative
reduction change of 7.88% to total up to 12,830.48 tonnes of food waste was observed one week after
the MCO. A higher reduction of 14.76% was recorded in 11,871.70 tonnes of food waste for the second
week of MCO. The outbreak has caused temporary shutdown of commercial and industrial activities,
which has forced most people to stay at home [11].
Table 3. Food waste collection in Selangor before and during MCO.
4WB 3WB 2WB 1WB W1 P1 W2 P1 W1 P2 W2 P2
Period
MCO MCO MCO MCO MCO MCO MCO MCO
Food waste
13,938.0 13,757.4 14,040.8 13,927.4 12,830.5 11,871.7 11,820.7 12,015.3
(tonnes)
Relative change Reference
−1.3 0.75 −0.08 −7.95 −16.10 −17.83 −16.27
(%) value
Based on the previous study on eating behavior among Malaysian urbanites, factors such as
working away from home, working mothers, and food varieties have encouraged the practice of
eating-out recently [12]. Social transformation through rapid urbanization with many accessible food
premises has supported the change of eating pattern among the urbanites. Temporary closure of
most businesses during the MCO was observed by the decline of Malaysia’s Industrial Production
Index (IPI) at −4.9% year-on-year (YOY) in March 2020, the steepest since September 2009 [13]. Thus,
the shutdown of these non-essential workplaces has directly affected the food waste generation during
the MCO.
The reduction in food waste collection is consistently observed at a higher percentage of 15.13%
due to the extension of the MCO, to a total of 11,820.71 tonnes. There is a further decline as observed
in the third week of the MCO due to the stricter rules that were enforced. Extended MCO has further
slowed down the economic activities, which slumped 32% YOY in April, as the sharpest decline
on record [14]. In fact, stricter MCO rules have changed spending habits as people started saving
money and have instead been purchasing primarily essential goods like groceries, household supplies,
and health supplements against uncertainty over job and income security [15].
The traffic in the majority of physical shops decreased significantly, and during the MCO,
non-important enterprises were ordered to discontinue. Malaysians have therefore spent more time
online and are now ready to buy items online. Behavioral changes, such as working from home or
looking at new hobbies during the stay-at-home period, also provide new opportunities to deliver
online food. Revenue in online food delivery segment is projected to increase by +45.9% yoy to
reach RM875m in 2020. The segment has recorded an increment of users at +36.3% yoy with a total
of 6.9million due to MCO with projected market volume of Restaurant-to-Consumer Delivery with
RM622m [16].Sustainability 2020, 12, 8848 5 of 17
The fourth week of the MCO observed an increase of 1.4% of food waste levels to 12,015.29 tonnes.
This may be due to the official government announcement to open certain business sectors and
commercial activities [17]. Despite this, the status has still recorded a total reduction of 13.73% from
food waste collection before the MCO. This was attributed to the continuous non-operating order
for open space market and massive feast that usually escalates food waste generation [8]. In general,
people have started realizing the value of food since important food commodities including rice, beef,
and mutton have self-sufficiency ratio (SSR) of less than 100% [18].
3.2. Effect of MCO to Weekly Food Waste Generation in Selangor
Figure 1 illustrates food waste collection for 4 weeks before the MCO and the first 4 weeks of MCO.
From the figure, it was observed (and indicated with similar letter a) that there were no statistically
significant differences (p < 0.05) in food waste collection in Selangor against the weekly collection
period. Regardless of the consistent trend for the previous four weeks before the MCO, Selangor
recorded 2083.86, 1999.37, 1939.96, 1908.69, 1329.21, 2370.07, and 2296.27 tonnes of food waste one
week before the MCO. The first week of MCO recorded a slight daily reduction of food waste by
following the previous weekly trend. The MCO did not cause panic buying, which usually led to food
waste generation due to over-purchasing, since the government has assured that the food supply was
enough through the food security fund of RM1b [19,20].
The second week of MCO recorded consistent reduction of 1827.89, 1703.60, 1708.11, 1598.47, 947.80,
2049.27, and 2036.55 tonnes of food waste collection. Such steady reduction was recorded because
most people started to realize the value of food toward a more challenging phase of restructuring life
after COVID-19 recovery [21]. This is supported by the recent study that found that 70.6% of citizens
are aware about the Value Food No Waste awareness campaign conducted by SW Corp [22]. The study
also found that 96.9% prepared their own meals and 64.4% purchased them online during the MCO,
which has helped minimizing the waste because it was consumed sparingly [23].
The first week of the second phase of MCO reported 1708.93, 1650.49, 1695.55, 1585.81, 935.59,
2099.25, and 2145.09 tonnes of food waste. The values were found to be slightly reduced because the
people had started to familiarize with the new norm. How a person reacts to the outbreak is influenced
immensely by individual background, differences from others, and the community. A feeling of
stress, fear, and anxiety can be overwhelming and cause strong individual emotions throughout the
MCO [24,25]. Most of the people reacted to the initial phases of MCO positively as the platform to try
out new recipes [26].
There was even a Facebook group instantly joined by 1.922 million users to discuss on failed
food recipes, with the name Masak Apa Tak Jadi Hari Ini Official, that was humorously advised by the
Prime Minister on his aspiring speech [27]. This has become an intimidating trend that the members
of the Facebook group turned the food into intentionally lousy ones just to gain more likes and
engagement [28]. As the food was not prepared properly according to the number of appropriate
households, which was facing the increasing time spent and number of people staying at home during
the MCO, if not addressed properly, this will contribute to the avoidable amount of food waste [10].
In evidence to this situation, the second week of the second phase of MCO has documented an
increase of 1795.97, 1704.67, 1724.25, 1645.21, 953.64, 2071.65, and 2118.67 of consistent food waste
status pattern. Based on the survey conducted by vase.ai on Malaysian consumer patterns during
the COVID-19 outbreak, the percentage of stocked up food was increasing, compared from Phase
1. Fresh food, particularly, has observed the higher percentage of 75% from 1100 total respondents
rather than only 60% during Phase 1 [29]. This increment was also due to the exemption for several
businesses to operate with employees returning to work to contribute slightly to food waste generation
at the workplace.Sustainability 2020, 12, x FOR PEER REVIEW 6 of 17
Sustainability 2020, 12, 8848 6 of 17
Means that do not share a letter are significantly different.
WeeklyFood
Figure1.1.Weekly
Figure FoodWaste
WasteCollection
Collection in
in Selangor
Selangor (19th
(19 February
February2020–14 April
2020–14 2020).
April 2020).Sustainability 2020, 12, x FOR PEER REVIEW 8 of 17
Sustainability 2020, 12, 8848 7 of 17
Means that do not share a letter are significantly different.
Figure 2. Weekly
Weekly food waste collection comparison before and during the MCO between municipal
municipal areas
areas in
in Selangor.
Selangor.Sustainability 2020, 12, 8848 8 of 17
3.3. The Influence of MCO to Food Waste Generation in Municipal Areas of Selangor
The effect of MCO on food waste generation according to eight municipal areas in Selangor is
shown in Figure 2. Tukey’s post-hoc test, as observed with the different letters in the figure, has
shown that there is a statistically significant difference (p < 0.05) in food waste generation to the local
authorities in the municipal areas of Selangor. Food waste generation for the first four weeks before the
MCO is still parallel regardless of different local authorities. Indeed, food waste management is critical
in influencing the quality of life in urban areas since 70% of the global population is anticipated to
live in cities by 2050 [30] Urban food waste characterization must be studied before policymakers can
establish sustainable decisions toward this predicament [31]. Thus, the detailed food waste behavior
according to the municipal areas in Selangor is discussed further.
3.3.1. Majlis Bandaraya Petaling Jaya (MBPJ)
Now known as the leading growth center in Selangor, Petaling Jaya has recorded a consistently
high amount of food waste before the MCO with 3959.17 tonnes for its total population of 520,698
people [32]. There is a consistently gradual drop of food waste generation since the implementation of
MCO until week 2 of the second phase, with 1321.36 tonnes. Petaling Jaya is an area of high density
with a mixture of office and residential areas. A high number of property holdings of 217,930 that was
shut down due to MCO would explain the decline recorded [33]. In fact, a relatively moderate amount
of food waste must be attributed to its commitment towards becoming a green city.
Petaling Jaya registered the highest mean household income of the 140 administrative districts
with RM10,792 [34]. The ranks of the six highest income groups remained unchanged for several years.
Surprisingly, food waste generated by MBPJ was not equally high compared to a higher affordability of
purchasing food. Denouncing its green pledge, MBPJ provides Petaling Jaya Homeowners Low Carbon
and Green Initiative, which has in total waived assessment worth RM414,380.48 for homeowners
practicing green living [35]. The fiscally sustainable green approach by MBPJ has been directly observed
by a moderate amount of food waste for such a developed city [36].
3.3.2. Majlis Bandaraya Shah Alam (MBSA)
Parallel to its city council counterpart, Shah Alam has a similar food waste data trend to Petaling
Jaya, with 1595.60 tonnes before the MCO. This is almost parallel to the total population of 481,654 [32].
MBSA’s initiative is to achieve low carbon and green city education in the public sector, especially
hawkers and traders [37]. Despite a monthly salary of RM6800 that is sufficient for an average person
in Shah Alam to purchase more food, steady food waste reduction on certain points (i.e., 30th of
March) during the MCO has reflected the effectiveness of its various initiatives towards the green city
concept [38].
3.3.3. Majlis Perbandaran Ampang Jaya (MPAJ)
Ampang Jaya has one of the highest drops in food waste quantity, particularly on the 15th and
22nd of March, which are both Sundays. As no residential waste is collected on this day, it can be
deduced that the amount of waste generated by office/work-goers decreased. Waste levels have been
relatively the same during the second week of the MCO and a slight increase was observed during
the fourth week. The previous study on the consumption of 0.38 kg/cap/day of rice, eggs, and sugar
among the urban community of MPAJ has solely produced 4.5 kg/cap/day of food waste [31]. This has
indicated that food waste in MPAJ is primarily generated through the residential area with a population
of 800,000 [39].
3.3.4. Majlis Perbandaran Kajang (MPKj)
Kajang is among the highest food waste producers in Selangor before the MCO, attributed to
factories and residential activities, with 1800.82 tonnes. Increased COVID-19 cases in Hulu Langat,Sustainability 2020, 12, 8848 9 of 17 Kajang, with 357 did not affect food waste generation despite the people having been subjected under restricted MCO with difficult access to food [40] Apparently, high food waste generation was supported by the previous study, in that 50.1% of the respondents in MPKj were unable to identify the concept of institutional waste. Most of the respondents (
Sustainability 2020, 12, 8848 10 of 17
has somehow increased to 1727.33 tonnes during the second phase of MCO. This is attributed to
more leeway given for commercial activities being opened by the government since MPSJ is heavily
industrialized [17]. Higher average income for MPSJ households with RM6230 usually led to higher
tendency of overbuying [51,52]. The influence of households’ shopping routines through planned
shopping activities can help mitigate the avoidable amounts of food waste [53].
3.3.8. Majlis Perbandaran Sepang (MPSp)
As a municipal council, it is not necessary for MPS to produce high amount of food waste
generation. With only 797.25 tonnes of food waste before the MCO, the community in MPS has slightly
reduced its food waste generation to 744.94 and 718.6. Such low food waste generation is largely due to
the initial stage of developing process in MPSp as a spin-off from Kuala Lumpur International Airport
1 and 2 [54]. During the second week of MCO, food waste levels remained consistent at 710.54 and
702.82 tonnes whereby the overall drop was still observed during the week. Minimal residential area
with a total population of 212,050 has ascertained the assumption that food waste was generated solely
by the internal consumption and production within MPSp [55].
The local industry has attracted skilled workers since 2000, bringing trade and industry growth to
the rapid development of MPSp. Relatively higher mean monthly household income of Sepang at
RM10,121, dominated by airlines staff with premium salary, somehow did not increase food waste
generation in MPSp [56]. However, this has encouraged economic activities, as according to the MPSp
Local Plan 2025, 12 areas have been zoned as industrial parks, accumulating 3530 acres. The 196 acres
of light to medium industrial development in Sime Darby Property’s Serenia City will be continued
until 2025 [43]. Indeed, vast urbanization of MPSp is expected to change the pattern of food waste
generation for the next ten years.
3.4. The Influence of MCO to Food Waste Generation in District Areas of Selangor
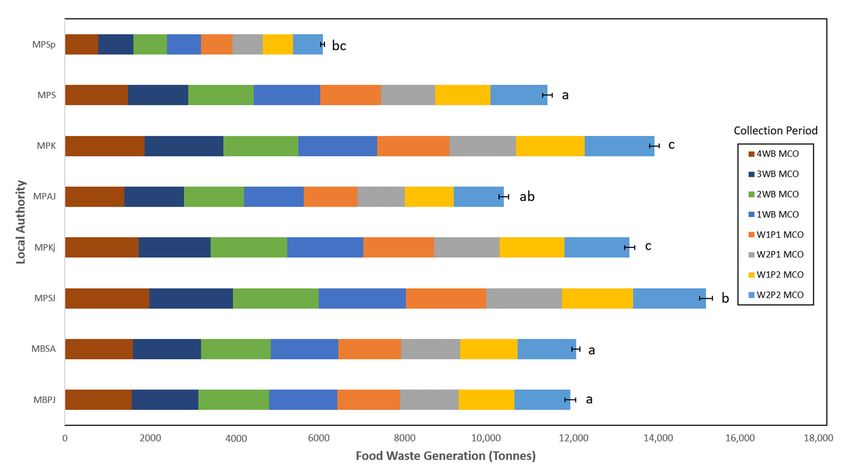
The weekly food waste generation tonnage comparison before and during the MCO according
to the local authorities in the rural area of Selangor can be significantly observed from the different
letters in Figure 3. It is an agreement that food waste collection for four weeks before the MCO was
consistent. MDKL, MDSB, MDHS, and MDKS recorded low food waste collection 1 week before the
MCO, at 382.73, 181.03, 394.80, 245.49 tonnes, respectively. The average low amount of daily food
waste in the district area of Selangor can be directly correlated to rural Tunisia with 301.01 tonnes.
The respondents have indicated positive food waste behavior and agreed that COVID-19 lockdown
has affected the waste levels of 93% respondents and the grocery purchasing preference of 80%. In fact,
the lockdown has improved the performance of food purchasing, which has driven towards a positive
change in food waste behavior [57].Sustainability 2020,12,
Sustainability2020, 12, 8848
x FOR PEER REVIEW 12 of 1711 of 17
Means that do not share a letter are significantly different.
Figure3.3.Weekly
Figure Weeklyfood
foodwaste
waste collection
collection comparison
comparison before and during the
the MCO
MCO between
betweendistrict
districtareas
areasof
ofSelangor.
Selangor.Sustainability 2020, 12, 8848 12 of 17
3.4.1. Majlis Daerah Kuala Langat (MDKL)
The food waste amount in MDKL, dominated by rural area, is significantly lower than the
urban area, which was previously discussed. MDKL recorded the highest food waste collection at
382.73 tonnes before reducing slightly to 376.38. The food waste collection fluctuates from 340.26 tonnes
to increase to 368.77 tonnes before being reduced back to 367.34 tonnes. The MDKL’s initiative of
building nine recycling centers was unfortunately a failure due to the apathy and ignorance among the
people towards the importance of proper waste treatment [58]. This reflects the low disposal of food
waste in rural areas where more houses give their food waste to their neighbors, which demonstrates a
brotherhood spirit in their communities [59].
3.4.2. Majlis Daerah Sabak Bernam (MDSB)
Tukey’s post-hoc test showed that there is a statistically significant difference (p < 0.05) in food
waste generation in MDSB compared to other local authorities in district areas. MDSB collected a
significantly lower total food waste of 181.03 tonnes before the MCO. The amount of food waste
reduced consecutively from 155.77 tonnes to 141.49 tonnes. Due to this, it has the highest percentage
drop by the second week of the MCO (21.84%) to 137.17 tonnes as any decrease in waste collected
would be a huge chunk in its collected waste portion. Since the land usage for industrial purpose in
MDSB is only at 0.05%, such minimal food waste generation might be solely contributed by the low
number of total population of 103,709 [60].
The opening of small commercial activities that made up merely 0.14% of total land usage in
MDSB had contributed to a slight increase of food waste to 143.31 tonnes. A percentage of 90.4% of
people in the traditional houses of Sabak Bernam did not use authorized waste management [61].
Since about 47% of the total area of Sabak Bernam is under agriculture, the traditional agricultural life
in Sabak Bernam conducted food waste disposal in nature by feeding to the livestock as grain and
plants as fertilizer, which confirmed the low amount of food waste being consistently collected [62].
The main factor affecting agricultural land suitability was rural gross domestic product, which is a
crude measure of the disposable income from farming activities. The study found that Sabak Bernam
was the most suitable area for paddy, oil palm, and coconut cultivation [63].
3.4.3. Majlis Daerah Hulu Selangor (MDHS)
MDHS recorded a total food waste before the MCO that is consistent with MDKL at 394.80 tonnes.
Declared as a COVID-19 red zone with 43 positive cases, MDHS was observed with the smallest
percentage drop by the second week of the MCO at 387.31 tonnes, compared to all local authorities [40].
It remained at consistent levels of 366.75 and 353.25 tonnes during the third week of the MCO. However,
waste levels started to slightly increase during the fourth week, close to before the MCO at 365.48 tonnes.
Despite there being no established literature on food waste behavior in Hulu Selangor, it can be deduced
to resemble the trend of rural area such as MDKL. As the tonnage drop difference is very small, the data
suggests that MCO does not significantly affect food waste generation in MDHS.
3.4.4. Majlis Daerah Kuala Selangor (MDKS)
Food waste generation in MDKS recorded a statistically significant difference (p < 0.05) compared
to the other local authorities in district areas of Selangor. MDKS recorded 245.49 tonnes of food
waste before the MCO until it was reduced to 220.34 tonnes and further declined to 214.40 tonnes.
The announcement of the Selangor government to designate Kuala Selangor as pioneer districts,
where agriculture projects will be created through Agricultural Economic Clusterisation initiative, has
ensured food security and sustainability in MDKS [64]. Interestingly, MDKS generated more waste up
to 281.74 tonnes and further to 282.38 for the following weeks when people started to get comfortable
with the restriction, which were further contributed to by the opening of several business activities.Sustainability 2020, 12, 8848 13 of 17
3.4.5. Summary of the Effect of MCO on Food Waste Collection in Municipal and District Areas
of Selangor
Food waste collection due to the implementation of MCO in Selangor has recorded significant
findings that will deliver as the evidence-based results to push the urge for stricter policies in Malaysia.
It was the consensus that the MCO has managed to reduce the food waste generation during the
restriction period for both municipal and district areas of Selangor. This is in particular to municipal
areas, which relatively recorded very high amounts of food waste before the MCO. On the contrary,
for the people in district areas, most of them resorted to the traditional food waste cycle by feeding it
to the livestock or as the fertilizer for the plants. Thus, it was clearly indicated by the minimal amount
of food waste before and during the MCO, with very slightly lower amount during the MCO.
3.5. Sustainable Food Waste Management
The booming world population and changing habits in developing countries could cause food
waste to rise by almost a third by 2030. [65]. Regrettably, in developing countries, solid waste
management has to address the lack of coverage of the collections and irregular collections; crude
open dumping and burns without air and water pollution control; fly and vermin cultivation; and
informal waste picker treatment and control [66]. Recently, the management of food waste in the
environment has been a major problem because of a lack of separation effort. It causes the technical,
financial, institutional, economic, and social factors that limit the development of an effective food
waste management system.
The study of the Boston Consulting Group (BCG) found that if current trends persist, annual food
waste would rise to 2.1 billion tonnes [67]. Household food waste is particularly important, since it
represents the largest fraction of the supply chain compared to other stages and usually helps to raise
the fraction of urban waste [68]. Food waste would probably continue to worsen as both individuals
and businesses recover from the disrupted food supply chain. Indeed, food prices and availability in
Malaysia is subjected to the global food supply chain. As Malaysia imports more than RM50bn worth
of food, domestic food consumption could be marginally affected by the chain disruption [69].
Recently, the Ministry of Domestic Trade and Consumer Affairs with the assistance of strategic
partners and food donors have developed Centre of Food Collection and Distribution (PPPM) for the
Food Bank Malaysia Program (FBMP) located in Bukit Angkat, Kajang. The center has been established
as a one-stop center for the donors to contribute food to the identified target groups with the main
focus to the community and students from B40. The second PPPM will be opened in Bandar Bahru,
Kulim as the center of food collection for the north region. The FBMP has managed to rescue 1984
metric tonnes of food, which has benefited 476,250 households [70]. Thus, the ministry is interested
to launch Program Food Bank Siswa (PFBS) with the focus on private universities, polytechnics, and
teaching institutes (IPG) [71].
The commitment of Selangor state towards green food waste management is reflected clearly from
the 2020 Budget, which saw an allocation of RM6.85 million for solid waste management, RM600,000
to set up recycling centers at all local councils, RM1.5 million for green volunteerism, and RM500,000
to plant 5000 trees statewide [72]. In fact, the sustainability city indicator in Sistem Malaysia Urban
Indicator Network (MURNInet), which includes resolving food waste issues, must be consistently
evaluated [7,73]. Apart from enhanced awareness on food waste separation, the campaign must be fed
well with a food waste recycle initiative by turning it into bio-fertilizer or potential bio-gas through
composting or anaerobic digestion [26].
Malaysia’s Ministry of Housing and Local Government has confirmed that only 24% of 38,000
tonnes of generated daily waste is separated and recycled, and 76% is sent to landfill [74]. There was
an 80% reduction in the quantity of waste received in six landfills in Selangor. KDEB confirmed that
the amount of waste collected by residential areas remained almost identical during the MCO and
until its implementation [11]. Landfills are usually deprived of environmental reduction measures
such as leachate reservoir systems and lining materials. The contamination cannot be mitigated wellSustainability 2020, 12, 8848 14 of 17
despite adequate landfill reduction measures [75]. Therefore, landfills with informal waste collection
require improved safety and management.
4. Conclusions
Malaysia has faced similar problems of the ever-growing rates of food waste generation: proper
technology, manpower, and scarcity of land and other facilities. Concurrent to this pandemic, the
researchers concluded that the MCO restrictions in Malaysia have major effects on the reduction of
food waste. The findings will give contribution of knowledge in the quantification and analysis of food
waste drivers in Malaysia. Additional considerations should be rendered in the field, for example,
industrial activities, weather conditions, biomass burning, and traffic density.
Author Contributions: M.H.I.: conceptualization, visualization, writing—original draft preparation. A.M.N.,
A.E.O.: methodology, data curation, investigation. R.M.T.: supervision. M.H.H., T.I.M.G. and L.A.M.:
writing—reviewing and editing, validation. All authors have read and agreed to the published version of
the manuscript.
Funding: This research was supported by Research Management Centre, Universiti Putra Malaysia through
the Vote Code of 9001103, Knowledge Transfer Grant Scheme (Ref: UPM/UCTC/900-3/2/KTGS20), and UC Seed
Fund for Collaborative Research Grant (Ref: GBG19-1789) for providing technical and financial support for the
preparation of the article.
Acknowledgments: A special thanks to the dedicated garbage collectors, particularly in Selangor, as the national
essential services during the MCO under KDEB Waste Management and Selangor State Government, Ministry
of Housing and Local Government for the promotion on waste segregation and Ministry of Environment and
Water for the initiative to promote sustainability in Malaysia. We greatly appreciate the front liners especially the
Director-General of Health Malaysia, Tan Sri Dato Seri Dr. Noor Hisham Abdullah, for their hard work during
this critical time. Congratulations to fellow Malaysians as we are entering the recovery phase. May the spirit and
commitment of Malaysians through #kitajagakita in facing this pandemic be with you.
Conflicts of Interest: The authors declare that they have no known competing financial interests or personal
relationships that could have appeared to influence the work reported in this paper.
References
1. Bhusare, B. COVID-19: Persistence, Precautions, Diagnosis and Challenges. J. Pure Appl. Microbiol. 2020,
14 (Suppl. S1), 823–829. [CrossRef]
2. Salim, N.; Chan, W.H.; Mansor, S.; Bazin, N.E.N.; Amaran, S.; Faudzi, A.A.M.; Zainal, A.; Huspi, S.H.;
Khoo, E.J.H.; Shithil, S.M. COVID-19 epidemic in Malaysia: Impact of lock-down on infection dynamics.
medRxiv 2020. [CrossRef]
3. Sundaram, J.K.; Gen, T.Z.; Jarud, R.K. Achieving Food Security for all Malaysians; Khazanah Research Institute:
Kuala Lumpur, Malaysia, 2019; pp. 1–78.
4. United States Department of Agriculture. The Impact of Food Waste; United States Department of Agriculture:
Washington, DC, USA, 2019.
5. Lim, W.J.; Chin, N.L.; Yusof, A.Y.; Yahya, A.; Tee, T.P. Food waste handling in Malaysia and comparison with
other Asian countries. Int. Food Res. J. 2016, 23, S1–S6.
6. Manaf, L.A.; Samah, M.A.A.; Zukki, N.I.M. Municipal solid waste management in Malaysia: Practices and
challenges. Waste Manag. 2009, 29, 2902–2906. [CrossRef] [PubMed]
7. Marzukhi, M.A.; Omar, D.; Leh, O.L.H.; Hamir, M.S.; Barghchi, M. Malaysian urban Indicators Network:
A sustainable development initiative in Malaysia. Eur. J. Soc. Sci. 2011, 25, 77–84.
8. Penghasilan Sisa Pepejal Menurun Ketika PKP, Ramadan. Available online: https://www.bharian.com.
my/berita/nasional/2020/05/686215/penghasilan-sisa-pepejal-menurun-ketika-pkp-ramadan (accessed on
12 July 2020).
9. SWCorp. Analytical Correlation on Solid Waste Data in Malaysia; SWCorp: Cyberjaya, Malaysia, 2020.
10. Jarjusey, F. Consumers’ Awareness and Knowledge about Food Waste in Selangor, Malaysia. Int. J. Bus.
Econ. Aff. 2017, 2, 91–97.
11. Marked Drop in Waste Sent to Landfills. Available online: https://www.thestar.com.my/metro/metro-news/
2020/04/11/marked-drop-in-waste-sent-to-landfills (accessed on 10 July 2020).Sustainability 2020, 12, 8848 15 of 17
12. Ali, N.; Abdullah, M. The food consumption and eating behaviour of Malaysian urbanites. Issues and
concerns. Malays. J. Soc. Space 2012, 3, 44–53.
13. MIDF Amanah Investment Bank Berhad, March 2020 Industrial Production Index IPI Fell Into Negative
Territory as the MCO Halts. MIDF Research, 12 May 2020.
14. MIDF Amanah Investment Bank Berhad, Record Low Decline in IPI but Recovery Expected Soon. MIDF
Research, 20 April 2020.
15. Leong, B. COVID’s Impact on Malaysia’s e-Commerce Market. Joint ASEAN Network 10, 16 April 2020.
16. Statista. Food Delivery in Malaysia: Projected User Growth; Statista: Hamburg, Germany, 2020.
17. More businesses may be allowed to reopen as Covid-19 curve flattens. The Edge Markets, 29 April 2020.
18. Department of Statistics Malaysia. Self-Sufficiency Ratio (SSR) 2018; Theater; Department of Statistics Malaysia:
Putrajaya, Malaysia, 2019; p. 1.
19. Prime Minister’s Office of Malaysia. Government Sets up Economic Action Council to Address Economic Woes;
Prime Minister’s Office of Malaysia: Selangor, Malaysia, 2020.
20. Unilever Malaysia. Will Covid-19 Change Our Relationship with Food Forever; Unilever Malaysia: Kuala Lumpur,
Malaysia, 2020.
21. KPMG in Malaysia. Post MCO Reset; KPMG in Malaysia: Kuching Sarawak, Malaysia, 2020.
22. Sinar Harian. SWCorp Lancar Kempen Value Food No Waste. SWM Environment, 23 May 2020.
23. SWCorp. Value Food No Waste Campaign Findings; SWCorp: Cyberjaya, Malaysia, 2020.
24. Ministry of Health Malaysia. Mental health and psychosocial support in Covid-19. Intervention 2020, 13,
235–247.
25. Ozamiz-Etxebarria, N.; Dosil-Santamaria, M.; Picaza-Gorrochategui, M.; Idoiaga-Mondragon, N. Stress,
anxiety, and depression levels in the initial stage of the COVID-19 outbreak in a population sample in the
northern Spain. Cad. Saude Publica 2020, 36, 1–9.
26. Ismail, M.H. Potensi pengurangan sisa makanan menuju norma baharu. Malaysia Gazette, 13 May 2020.
27. Prime Minister’s Office of Malaysia. Perutusan Khas Perdana Menteri (10 April 2020); Prime Minister’s Office
of Malaysia: Selangor, Malaysia, 2020.
28. Freeman, B.; Kelly, B.; Baur, L.; Chapman, K.; Chapman, S.; Gill, T.; King, L. Digital junk: Food and beverage
marketing on facebook. Am. J. Public Health 2014, 104, e56–e64. [CrossRef]
29. Hirschmann, R. Food items that Malaysians have been stocking up during the Movement Control Order
(MCO) period during the COVID-19 outbreak in 2020. Vase.ai, 25 May 2020.
30. Liu, C.; Mao, C.; Bunditsakulchai, P.; Sasaki, S.; Hotta, Y. Food waste in Bangkok: Current situation, trends
and key challenges. Resour. Conserv. Recycl. 2020, 157, 104779. [CrossRef]
31. Shafie, F.A.; Omar, D.; Karuppannan, S.; Ismail, N. Urban-Scale Material Flow Analysis: Malaysian Cities
Case Study. Int. J. Environ. Sustain. 2016, 5. [CrossRef]
32. Worldometer. Malaysia Demographics. worldometers.info, 28 August 2020.
33. Petaling Jaya City Council. Official Portal: Background of Petaling Jaya City Council; Petaling Jaya City Council:
Selangor, Malaysia, 2020.
34. Department of Statistics Malaysia. Report of Household Income and Basic Amenities Survey 2016; Department of
Statistics Malaysia: Putrajaya, Malaysia, 2017.
35. Priya, S.S. MBPJ offers waivers for green households. The Star, 29 May 2019.
36. Ju, S.R.; Zaki, S.A.; Choi, Y.K. Contextual modernization; New town planning in Petaling Jaya, of Malaysia.
J. Asian Archit. Build. Eng. 2011, 10, 93–100. [CrossRef]
37. The Star. Shah Alam on the right track to green city status, says mayor. The Star, 9 June 2017.
38. Salary Explorer. Average Salary in Shah Alam 2020; Salary Explorer: New York, NY, USA, 2020.
39. Hamid, A. Ampang Jaya sets sights on becoming a city. The Star, 1 January 2020.
40. Zulkifli, Z. COVID-19: Hulu Selangor zon merah. Sinar Harian, 10 April 2016; pp. 1–11.
41. Ramlee, W.; Sairi, A.; Azami, Z.; Sopian, K. Basic Perceptions of Integrated Waste Management Concepts in
Majlis Perbandaran Kajang Malaysia. Latest Trends Energy Dev. Environ. Biomed. 2007, 2, 87–90.
42. Abas, M.A.; Wee, S.T. Municipal Solid Waste Management in Malaysia: An Insight towards Sustainability.
SSRN Electron. J. 2016. [CrossRef]
43. The Edge Markets. Industrial market driving the economy. The Edge Communications Sdn.Bhd, 13 May 2019;
pp. 1–19.
44. Perumal, E. International awards spur Klang towards green city goal. The Star, 23 December 2017.Sustainability 2020, 12, 8848 16 of 17
45. Selayang Municipal Council. Background of Selayang; Official Portal of Selayang Municipal Council: Selangor,
Malaysia, 2010.
46. FAO. Global Food Losses and Food Waste—Extent, Causes and Prevention; FAO: Rome, Italy, 2011.
47. World Population Review. Malaysia Population 2020 (Live). Malaysia Population Density Map, 1 July 2020.
48. Chai, Y.H. Klang Valley High-Rise Residential Property Monitor (4Q2019): Property market will remain
initiatives-driven. The Edge Markets, 1 April 2020; pp. 1–13.
49. Garcia-Garcia, G.; Woolley, E.; Rahimifard, S.; Colwill, J.; White, R.; Needham, L. A Methodology for
Sustainable Management of Food Waste. Waste Biomass Valorization 2017, 8, 2209–2227. [CrossRef]
50. Liu, C.; Hotta, Y.; Santo, A.; Hengesbaugh, M.; Watabe, A.; Totoki, Y.; Allen, D. Magnus Bengtsson. Food
waste in Japan: Trends, current practices and key challenges. J. Clean. Prod. 2016, 133, 557–564. [CrossRef]
51. Sulaiman, N.F.A.R.; Ahmad, A. Save The Food for A Better Future: A Discussion on Food Wastage in
Malaysia. Int. J. Law Gov. Commun. 2018, 3, 12–21.
52. Salary Explorer. Average Salary in Subang Jaya 2020; Salary Explorer: New York, NY, USA, 2020.
53. Zainal, D.; Hassan, K.A. Factors Influencing Household Food Waste Behaviour in Malaysia. Int. J. Res. Bus.
Econ. Manag. 2019, 3, 56–71.
54. Masirin, M.I.H.M.; Ridzuan, M.B.; Mustapha, S.; Don, R.A.M. An Overview of Landfill Management and
Technologies: A Malaysian Case Study at Ampar Tenang 1. In Proceedings of the 1st National Seminar on
Environment, Development, and Sustainability: Ecological, Economic and Social Aspect, Selangor, Malaysia,
28–29 July 2008; pp. 157–165.
55. Worldometer. Malaysia Population (LIVE). Worldometer, 28 August 2020.
56. Department of Statistics Malaysia. Malaysian Economic Statistics Review; Department of Statistics Malaysia:
Putrajaya, Malaysia, 2020.
57. Jribi, S.; Ismail, H.B.; Doggui, D.; Debbabi, H. “COVID-19 virus outbreak lockdown: What impacts on
household food wastage? Environ. Dev. Sustain. 2020, 22, 3939–3955. [CrossRef]
58. Jereme, I.A.; Siwar, C.; Begum, R.A.; Alam, M.M. An assessment of waste management operation in Malaysia:
Case study on Kuala Langat and Sepang. Int. J. Environ. Waste Manag. 2015, 16, 133–143. [CrossRef]
59. Jereme, I.A.; Siwar, C.; Begum, R.A.; Talib, B.A. Addressing the problems of food waste generation in
Malaysia. Int. J. Adv. Appl. Sci. 2016, 3, 68–77. [CrossRef]
60. Portal Rasmi Pejabat Daerah dan Tanah Sabak Bernam. Profil Daerah; Portal Rasmi Pejabat Daerah dan Tanah
Sabak Bernam: Selangor, Malaysia, 2015.
61. Shakiba, N.; Shagar, P.; Hod, R. Solid Waste management in Kuala Selangor and Sabak Bernam. IOSR J.
Environ. Sci. Toxicol. Food Technol. 2014, 8, 41–46.
62. Ngah, I. Exploring Rural Transformation in Malaysia: A Case of Rice Cultivation Area in Sabak Bernam.
In Proceedings of the Ninth International Malaysia Studies Conference (MSC9), Kuala Terengganu, Malaysia,
18–20 August 2014.
63. Olaniyi, A.O.; Ajiboye, A.J.; Abdullah, A.M.; Ramli, M.F.; Sood, A.M. Agricultural land use suitability
assessment in Malaysia. Bulg. J. Agric. Sci. 2015, 21, 560–572.
64. Chan, D. More lands for agricultural in Selangor. New Straits Times, 7 September 2019; pp. 2–4.
65. Elks, S. By 2030 We Could Throw Away More Than 2 Billion Tonnes of Food; World Economic Forum: Colony,
Switzerland, 2018.
66. Jereme, I.A.; Siwar, C.; Alam, M.M. Waste Recycling in Malaysia: Transition from Developing to Developed
Country Waste recycling in Malaysia: Transition from developing to developed country. Indian J. Educ.
Inf. Manag. 2014, 4, 1–14.
67. Hegnsholt, E.; Unnikrishnan, S.; Pollmann-Larsen, M.; Askelsdottir, B.; Gerard, M. Tackling the 1.6-Billion-Ton
Food Loss and Waste Crisis; The Boston Consulting Group, Food Nation, State of Green: Boston, MA, USA, 2012.
68. ThinkCity. Covid-19 Crisis: Preserving Lives & Livelihoods, a Guide for Malaysian Policymakers; ThinkCity:
George Town, Malaysia, 2020.
69. Hamid, A.A.; Ahmad, A.; Ibrahim, M.; Rahman, N.N.A. Food Waste Management in Malaysia-Current
situation and future management options. J. Ind. Res. Technol. 2012, 2, 36–39.
70. Han, D.H. A recycling method of food waste by drying and fuelizing. J. Eng. Appl. Sci. 2017, 12, 3599–3603.
71. Unit Komunikasi Korporat KPDNHEP. PPPM Kajang Buka Lembaran Baharu; Official Portal of Ministry of
Domestic Trade and Consumer Affairs: Putrajaya, Malaysia, 2020.
72. Arumugam, T. ‘Selangor, a role model for green initiatives’. New Straits Times, 2 November 2019; pp. 12–15.Sustainability 2020, 12, 8848 17 of 17
73. Amirudin, N.; Gim, T.-H.T. Impact of perceived food accessibility on household food waste behaviors: A case
of the Klang Valley, Malaysia. Resour. Conserv. Recycl. 2019, 151, 104335. [CrossRef]
74. Bernama. Pahang sees 10-30pct drop in garbage collection during MCO. News Straits Times, 2 May 2020.
75. Ismail, S.N.S.; Manaf, L.A. The challenge of future landfill: A case study of Malaysia. J. Toxicol. Environ.
Health Sci. 2013, 5, 86–96. [CrossRef]
Publisher’s Note: MDPI stays neutral with regard to jurisdictional claims in published maps and institutional
affiliations.
© 2020 by the authors. Licensee MDPI, Basel, Switzerland. This article is an open access
article distributed under the terms and conditions of the Creative Commons Attribution
(CC BY) license (http://creativecommons.org/licenses/by/4.0/).You can also read