Restoration Hardware (NYSE:RH) - Consumer Retail Group Analysts: Caitlyn Liu, Harrison Thomas, Allen Cheng, Pete Matthews, Aidan Sommer, Megan ...

Page created by Joyce Peters
 
CONTINUE READING
Restoration Hardware (NYSE:RH) - Consumer Retail Group Analysts: Caitlyn Liu, Harrison Thomas, Allen Cheng, Pete Matthews, Aidan Sommer, Megan ...
Restoration Hardware
(NYSE:RH)
 Consumer Retail Group
 Analysts: Caitlyn Liu, Harrison Thomas, Allen Cheng, Pete
 Matthews, Aidan Sommer, Megan Syho
 Researchers: Andrew Cronin, Annie Lai, Benjamin Lee, Jimmy
 Ma, Sarah Johnston, Timothy Ma
 January 27th, 2021
Restoration Hardware (NYSE:RH) - Consumer Retail Group Analysts: Caitlyn Liu, Harrison Thomas, Allen Cheng, Pete Matthews, Aidan Sommer, Megan ...
Disclaimer

The analyses and conclusions of the Western Investment Club (“WIC") contained in this presentation are based on publicly available
information. WIC recognizes that there may be confidential information in the possession of the companies discussed in the presentation
that could lead these companies to disagree with WIC’s conclusions. This presentation and the information contained herein is not a
recommendation or solicitation to buy or sell any securities.

The analyses provided may include certain statements, estimates and projections prepared with respect to, among other things, the
historical and anticipated operating performance of the companies, access to capital markets and the values of assets and liabilities. Such
statements, estimates, and projections reflect various assumptions by WIC concerning anticipated results that are inherently subject to
significant economic, competitive, and other uncertainties and contingencies and have been included solely for illustrative purposes. No
representations, express or implied, are made as to the accuracy or completeness of such statements, estimates or projections or with
respect to any other materials herein. Actual results may vary materially from the estimates and projected results contained herein.

The sole responsibility for the content of this publication lies with the authors. Its contents do not reflect the opinion of the University
Students’ Council of the University of Western Ontario (“USC”). The USC assumes no responsibility or liability for any error, inaccuracy,
omission or comment contained in this publication or for any use that may be made of such information by the reader.
Restoration Hardware (NYSE:RH) - Consumer Retail Group Analysts: Caitlyn Liu, Harrison Thomas, Allen Cheng, Pete Matthews, Aidan Sommer, Megan ...
Table of Contents

I.     Business Overview

II.    Internal Analysis

III.   External Analysis

IV.    Investment Thesis

V.     Valuation

VI.    Risks and Mitigations

VII.   Catalysts

VIII. Investment Summary

IX.    Appendix
Restoration Hardware (NYSE:RH) - Consumer Retail Group Analysts: Caitlyn Liu, Harrison Thomas, Allen Cheng, Pete Matthews, Aidan Sommer, Megan ...
01
Business Overview
Restoration Hardware (NYSE:RH) - Consumer Retail Group Analysts: Caitlyn Liu, Harrison Thomas, Allen Cheng, Pete Matthews, Aidan Sommer, Megan ...
Company Overview
RH is a leading luxury retailer in the home furnishings marketplace

                                 Business Overview                                                   Financial Information

  ▪        RH (Restoration Hardware) is a luxury home retailer               Ticker                                                         NYSE:RH
           operating 68 galleries, 38 outlet stores, and 14 Waterworks       Share Price                                                          $454.52
           showrooms in the U.S. and U.K for a total of 120 stores
                                                                             52 Week Low-High                                           $73.14 - $524.02
  ▪        Assortment includes furniture, lighting, textiles, bath ware,
           décor, outdoor and garden, and child and teen furnishings         Enterprise Value                                               $11,906.7M

  ▪        The company is growing the presence of its hospitality            Market Capitalization                                          $10,350.9M
           business with 10 restaurants alongside its galleries in a         NTM EV / EBIT (1)                                                      15.5x
           unique approach to maximize the consumer experience
                                                                             NTM Price / Earnings (2)                                               24.2x

                                 52 Week Stock Chart                                                           Revenue
  $600                                                                 6M   4,000M           30.0%
                                                                                     24.5%
                                                                            3,500M                     20.4%                                              20.0%

                                                                                                                                14.3%
  $500                                                                 5M                                       12.9%
                                                                                                                                                   5.7%
                                                                            3,000M                                       1.2%              2.7%           0.0%

  $400                                                                 4M   2,500M                                                                        (20.0%)

  $300                                                                 3M   2,000M
                                                                                                                                                          (40.0%)

  $200                                                                 2M   1,500M
                                                                                                                                                          (60.0%)

                                                                            1,000M
  $100                                                                 1M
                                                                             500M
                                                                                                                                                          (80.0%)

      $0                                                               0M      0M                                                                         (100.0%)

                                                                                     2013    2014      2015    2016     2017    2018      2019     2020
                                                                                                       Revenue          YoY Growth %

(1) LTM EV/ EBIT 22.0x
(2) LTM Price / Earnings 62.6x
Restoration Hardware (NYSE:RH) - Consumer Retail Group Analysts: Caitlyn Liu, Harrison Thomas, Allen Cheng, Pete Matthews, Aidan Sommer, Megan ...
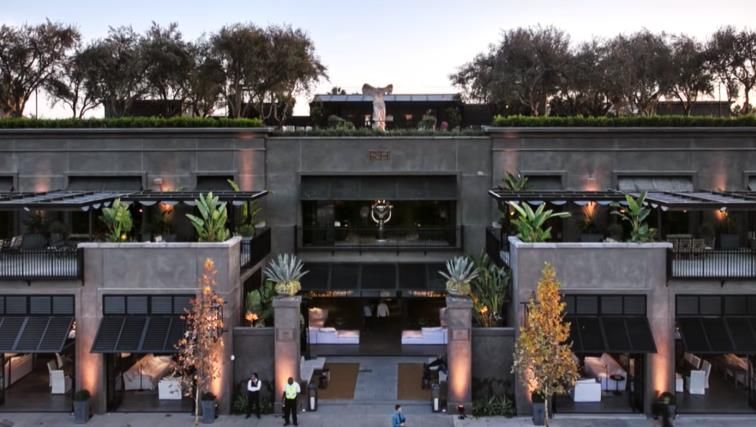
Business Overview: RH Galleries
Within the stores sales channel, RH operates a total of 82 RH Galleries and Waterworks Showrooms

                   Legacy Galleries vs. Design Galleries                               RH Hospitality & Products
                             Legacy Format        Design Gallery        ▪   With 10 new Design Gallery locations, RH offers the
  Number                          38                    24                  hospitality experience featuring beautiful architecture,
  Square Footage               8K Sq. Ft.           33K Sq. Ft.             cafes, wine vaults, barista bars, and restaurants
  Real Estate                Shopping Malls       Street Locations      ▪   RH Cafes track on average $5-6M sales annually
  % Assortment
Restoration Hardware (NYSE:RH) - Consumer Retail Group Analysts: Caitlyn Liu, Harrison Thomas, Allen Cheng, Pete Matthews, Aidan Sommer, Megan ...
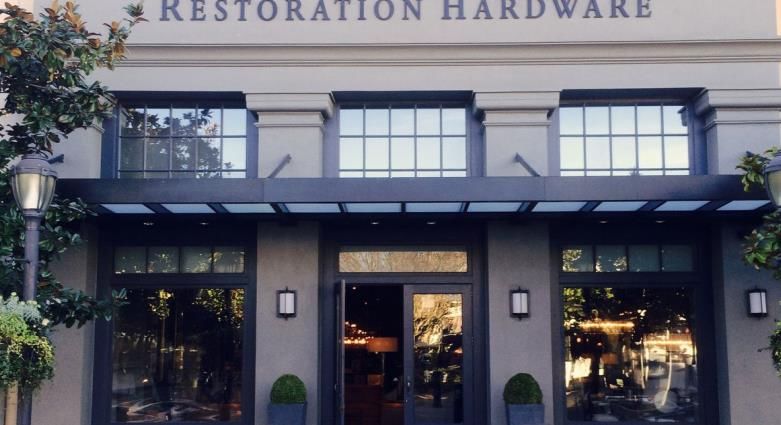
Business Overview: RH Design Galleries
RH’s new Design Galleries are more efficient than the prior format, driving higher average unit volumes

                                                            RH Design Gallery Strategy

                                         Design Gallery              Larger Bespoke             Indigenous Bespoke             Secondary Market
                                           Prototype                 Design Galleries             Design Galleries              Design Galleries

                         Size              33K sq. ft.                  90K sq. ft.                   80K sq. ft.                 10-18K sq. ft.

                                     To be implemented within          Located in top         Best second home markets      Smaller expressions of the
              Opportunity            2/3 of RH’s target markets, metropolitan markets & are     where the wealthy and          RH brand in markets
                                        more capital efficient        highly profitable       affluent visit and vacation    served by smaller players

                  Examples

                                          RH Nashville                RH New York                RH Palm Beach                  RH Milwaukee

Source: Company Filings, Jefferies
Restoration Hardware (NYSE:RH) - Consumer Retail Group Analysts: Caitlyn Liu, Harrison Thomas, Allen Cheng, Pete Matthews, Aidan Sommer, Megan ...
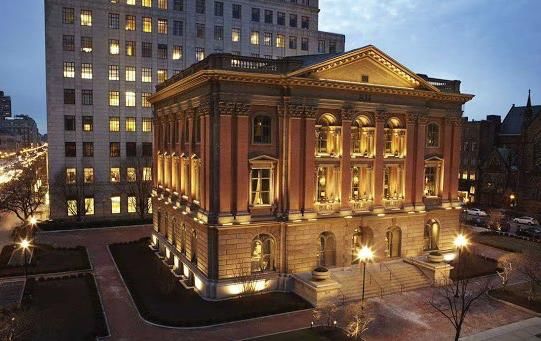
Business Overview: Sales Channels
RH has a fully integrated multi-channel business model, allowing for continued expansion & diversification

                      Revenue Contribution by Channel (1)                                                                                                   Revenue Contribution by Product Category (2)

                                                                                               Direct 44%                                                         Furniture                                   Non-
                                                                                                                                                                    68%                                      Furniture
                 Store 56%                                                                                                                                                                                     32%

                                                                                                                         Sales Channels

                   Galleries                                                 Outlet                                           E-Commerce                                              Source Books     Trade & Contract

          RH operates 82                                        38 Outlets located in                                 Ability to purchase                                           Series of ~10     Represents sales from
         galleries, either as                                    outlet malls, key to                                merchandise online, on                                      catalogs published   interior designers and
          design, legacy,                                        selling returned or                                     5 multiple RH                                          and mailed, created       customers that
         modern, or baby &                                          discontinued                                      websites, websites                                         in-house, primary        purchase with
           child and teen                                           merchandise                                        offer room-based                                         brand & advertising        assistance of
                                                                                                                           navigation                                                  vehicle               designers

                                  RH will continue to strengthen its brand through its multi-channel business model

(1) 2018 Annual Report, Store revenue represents retail stores, including Waterworks Showrooms, plus Outlet are Store, Direct revenues include sales through Source Books, websites, phone orders,
including the contract business and a portion of the trade business. 2019 data not available as no longer reported
(2) 2019 Annual Report
Restoration Hardware (NYSE:RH) - Consumer Retail Group Analysts: Caitlyn Liu, Harrison Thomas, Allen Cheng, Pete Matthews, Aidan Sommer, Megan ...
Business Overview: RH Business Model
Luxury furniture experience has historically been characterized by product inaccessibility, pricing
transparency, and underwhelming assortment breadth
                                                    Luxury Furniture Retail Industry vs. RH Business Model
                                           Designers                            Suppliers                                         Customer
                                                                                Retailer 1
                                        French Heritage
   Furniture

                                                                                Retailer 2
    Luxury

    Retail

                                                                              h Dealer 1
                                          Fendi Casa                             Dealer 2
                                                                            Interior Designer 1
                                         Boca do Lobo
                                                                            Interior Designer 2

                                       RH Design Partner                        Suppliers                                         Customer
   Business
    Model
     RH

                                       Partner Designer 1                          RH

                                       Partner Designer 2                  RH Interior Designer

                          Luxury Furniture Retail Industry                                                 RH Business Model
      ▪        Lack of or minimal pricing transparency for consumers                  ▪      RH’s differentiated business model cuts the time,
               transacting in multiple single-channels                                       complexity and expense associated with furnishing a home
      ▪        Underwhelming assortment breadth that does not span
               entire room sets, as displayed within RH galleries                     ▪      Removes the barrier between consumers and designers

      ▪        Designer products or full lines are often inaccessible                 ▪      Well-known, high-end artisans are in one single platform

                                     RH cuts the time, complexity, and expense associated with furnishing a home

Source: Company Filings, Jefferies
Restoration Hardware (NYSE:RH) - Consumer Retail Group Analysts: Caitlyn Liu, Harrison Thomas, Allen Cheng, Pete Matthews, Aidan Sommer, Megan ...
Business Overview: Supply Chain
Continued improvements to supply chain and fulfillment capabilities allow RH to manage customer orders
and distribution merchandise in an efficient and cost-effective manner
                                                         Value Chain

                          Sourcing            Retailer            Distribution & Delivery       End Consumer

                                                                   Distribution network
                     RH contracts with                              includes 2 furniture
                  third-party vendors to                          fulfilment centers and 1   Households in-excess
                       manufacture                                   smaller fulfillment       of $175K likely to
                       merchandise.             RH                 center. Home delivery     furnish entire rooms,
                  Approximately 70% of                              services is in 13 key     upper-middle tiered
                   products are sourced                             markets with a white      households will buy
                    from Asia and 16%                               glove home delivery          pieces as well.
                       from the US.                                   service for larger
                                                                          furniture.

               RH’s luxury brand continues to target top income households earning more than $175K annually

Source: Company Filings
02
Internal Analysis
Internal Analysis
RH has successfully expanded its margins and recently focused on transitioning their real estate strategy
from a leasing model to a development model, resulting in lower capital investment and lower rent
                             Number of Stores                                                                     Free Cash Flow Margin

 100                                                                                       700 M                 FCF          FCF Margin                           Projection Period       30%
                         85              83                86                  83
  80      69                                                                                                                                                                               20%
                                                                                           500 M
  60
                                                                   39                38                                                                                                    10%
  40                          28              32                                           300 M
               17                                                                                                                                                                          0%
  20
                                                                                           100 M
                                                                                                                                                                                           -10%
   0
           2016           2017              2018               2019        Q3 2020
                                                                                           -100 M                                                                                          -20%
                          Full Price Stores        Outlet Stores

                        Net Debt-to-EBITDA                                                                            Geographic Exposure
 6.0x    Capital-light real estate strategy                                                              1
                                                        5.2x                                                                                                           5
                                                                                                                                                                                       2
 5.0x     has lowered debt obligations                                                               1                                     1
                                                                 3.9x                                                                                      1                           4
 4.0x                                         3.5x                                                                                                                         2
                                                                        3.2x                                                                               1
                                                                                                                                                               3                       2
                                                                                                             1        1                                3
 3.0x                                                                                                                                                                      1   3
                                                                                                                          2        1           1
        2.0x                                                                        2.1x            20                                                                         1
                                                                                                                                                                           2
 2.0x                                                                                                                                                      1
                                                                                                                  2                    1
               0.9x           1.1x   0.9x
 1.0x                 0.7x                                                                                                                                 1       2
                                                                                                                                  8                1                           5
 0.0x
        2012   2013   2014    2015   2016     2017     2018      2019   2020        LTM
Internal Analysis
Management has greatly improved margins in the past four years with the introduction of Design Galleries
and membership platform, with a long-term outlook of 25% EBIT margin in the next five years
                                                                                       Historical GMROI/OMROI Analysis
 3.50x
 3.00x                     Management has improved inventory productivity by ~3x compared to 2016
 2.50x
 2.00x
 1.50x
 1.00x
 0.50x
     –

                                                                                                                                                1Q17A
           1Q13A

                   2Q13A

                            3Q13A

                                    4Q13A

                                            1Q14A

                                                    2Q14A

                                                            3Q14A

                                                                     4Q14A

                                                                             1Q15A

                                                                                     2Q15A

                                                                                             3Q15A

                                                                                                      4Q15A

                                                                                                               1Q16A

                                                                                                                       2Q16A

                                                                                                                               3Q16A

                                                                                                                                       4Q16A

                                                                                                                                                        2Q17A

                                                                                                                                                                3Q17A

                                                                                                                                                                        4Q17A

                                                                                                                                                                                1Q18A

                                                                                                                                                                                        2Q18A

                                                                                                                                                                                                3Q18A

                                                                                                                                                                                                        4Q18A

                                                                                                                                                                                                                 1Q19A

                                                                                                                                                                                                                          2Q19A

                                                                                                                                                                                                                                  3Q19A

                                                                                                                                                                                                                                          4Q19A

                                                                                                                                                                                                                                                  1Q20A

                                                                                                                                                                                                                                                           2Q20A

                                                                                                                                                                                                                                                                   3Q20A
                                                                                                     Trailing 4Q OMROI                            Trailing 4Q GMROI

                                    Operating Efficiency                                                                                                 Strong Industry-Relative Operating Margin

 LTM Margin from optimized operations,
  reopenings, real estate transformation                                                                      19.8%                                                 RH                                                                                19.8%

                                                                                                                                               The Home Depot                                                                         15.5%
                                                                                       14.4%
                                                                    11.3%                                                                       Williams-Sonoma                                                          11.8%
         9.7%
                                                                                                                                                At Home Group                                                            11.7%
                            4.7%               5.4%
                                                                                                                                               Lowe's Companies                                                   10.9%

                                                                                                                                                        Ethan Allen                 3.1%

         2016               2017               2018                 2019               2020                   LTM                                                       2.0%                7.0%                12.0%              17.0%                  22.0%
Annotated Stock Chart
RH stock rises with higher margins and elevated home spending from COVID-19 shutdowns

                                                           52-Week Annotated Stock Chart
   $600                                                                                                                                              6M

                                                                                                                                    5
   $500                                                                                                                                              5M
                                                                                                  3                 4
   $400                                                                                                                                              4M

   $300                                                     2                                                                                        3M

   $200                                                                                                                                              2M
                                       1

   $100                                                                                                                                              1M

       $0                                                                                                                                             0M
        Jan/20            Feb/20   Mar/20   Apr/20    May/20      Jun/20     Jul/20     Aug/20        Sep/20   Oct/20      Nov/20       Dec/20   Jan/21

  ▪1       March: COVID-19 related sell off, all RH retail locations are temporarily closed as cases reach thousands in the U.S
  ▪2       June 5: Q1 results are reported, most RH locations reopen, leading to a recovery and surge of sales in the upcoming quarter
  ▪3       September 10: Q2 results beat estimates with adjusted operating margin rising to 21.8%. RH Core demand is +7% in May, +32% in June,
           +34% in July, and +47% in August YoY driven by a more favorable product mix, operational improvements and increased demand
  ▪4       October: All RH Galleries and Outlets including 8 of the 10 restaurants reopen
  ▪5       December 10: Q3 results indicate strong demand trends despite the climate; operating income is up by 25% YoY from $89.2M to $111.2M,
           stemming from increases in product prices as well as decreased SG&A and compensation costs

Source: Company Filings
03
External Analysis
Luxury Market and Furniture Retail Positioning
US Luxury Consumer Goods, Furniture & Home Furnishings Landscape
                                                                                        Denotes inclusion in comps
                                       High/Luxury
   Product Quality/Brand Positioning

                                       Low/Value

                                                           Scale (US Revenues)
                                                     Low                         High

Source: Jefferies
Positioning RH as a Luxury Brand
The emergence of RH as a luxury brand has allowed it to more closely generate luxury margins

                                                Price Points Per Couch

  Restoration Hardware                          Williams Sonoma                      Wayfair

         $13,595.00                                 $3,295.00                          $769.99
                                Comparable Operating Margin to Luxury Brands
 30%      28.5%
                        25.5%
 25%
                                        21.0%
                                                          19.8%
 20%                                                                     16.8%   16.8%            16.7%
 15%

 10%

 5%

 0%
         Hermes        Kering          Ferrari             RH            LVMH    Tiffany         Burberry
External Analysis
RH’s focus on the high-end, $200K+ segment allows it to differentiate itself from popular eCommerce
players which focuses more on the downstream market
                       Product Resilience to eCommerce                                                                     High End Resilience to eCommerce

                Software                                                                  88.0%                                               High End
                   Music                                                               82.0%
            Video/DVD                                                                79.0%                                                    ($175K+)
                     PCs                                                             78.0%
                 Books                                                          66.0%
             Videogames                                                       62.0%                                                          Mass Market
          PC Accessories                                                      62.0%      Homogeneous                                        ($60K - $175K)
        Small Appliances                                                49.0%
           Event Tickets                                                    57.0%          Digitization

  Consumer Electronics                                         38.0%                                                                          Low End
          Housewares                                           38.0%                          Homogeneous
              Flowers                                          37.0%                                                                           ($60K)
                                                                                              Easy to Handle
                Office                                        35.0%
                 Toys                                       31.0%
                                                                                                                     Luxury Furniture Market is Highly Fragmented
              Auto Parts                              26.0%
        Sportings Goods                              24.0%
                 Apparel                            22.0%                                                        ▪    RH is the second largest player among the high-end/luxury
        Large Appliances                            21.0%
                                                                                          Non-homogeneous
                    Pets                         16.0%                                    Specialized Delivery        home furnishing retailers (“HF”), only trailing WSM
               Footwear                          15.0%
        Jewelry/Watches                          15.0%                                                           ▪    Comparable Pottery Barn brands accounted for ~$3B in
       Beauty/Cosmetics                       9.0%                                                                    sales in 2017 vs RH’s total sales of $2.4B in the same year
      Medical Supplies                      8.0%                                                                 ▪    Within the bespoke segment, products are highly
            Furniture                       8.0%
                                                                                          Non-homogeneous
          OTC Drugs                        6.0%                                            Greater Service            individualized with clients working with interior designers
    Home Improvement                      3.0%
            Groceries                     3.0%                                                                   ▪    HF market is more resilient to eCommerce trends as the
                                 0.0%        20.0%        40.0%         60.0%        80.0% 100.0%                     product moves upstream

Sources: Morgan Stanley ER, JPMorgan Initiating Coverage, Wayfair Investor Presentation
Furniture Market
Growth within both the global furniture market and US furniture store sales are steady

                            Global Furniture Market (US$B)                                                        US Furniture Store Sales (US$B)

                                                                                                                                                                       $68
                    3.7% CAGR                                                             $1,473           3.2% CAGR                                           $66
                                                                          $1,417 $1,384                                                           $64   $64
                                                                 $1,364
                                                       $1,309                                                                     $59    $60
                                              $1,250                                                                      $57
                                     $1,188
                            $1,128                                                                                  $53
                $1,072                                                                             $50      $51
 $1,023

   2012             2013     2014    2015     2016      2017     2018     2019    2020    2021     2012    2013    2014   2015    2016   2017    2018   2019   2020    2021

              Global Market for Luxury Furniture (US$B)                                                           RH Global Luxury Market Share

                    4.0% CAGR                                                         $30
                                                                            $29
                                                                $28                                                       10.1%
                                                 $26                                                                                            9.9%           10.0%
                                     $25
                           $24
      $23
                                                                                                          9.3%

     2017              2018          2019        2020           2021       2022      2023                 2017             2018                 2019            2020

Source: Jefferies
External Analysis
Positive demographics in $200K household and high proportion of furniture expenditure provides strong
runway for domestic growth
                                                                           Commentary                                                                                   Average US Furniture Expenditures Over Time
                                                                                                                                                                     $500                                                                  30%
  ▪                               Households >$200K are more likely to furnish entire
                                  rooms with RH, while those below that threshold typically                                                                          $400                                                                  20%
                                  buy individual pieces                                                                                                              $300                                                                  10%
  ▪                               RH has historically described its customer base as                                                                                 $200                                                                  0%
                                  households earning >$200k in income, which represents
                                                                                                                                                                     $100                                                                  -10%
                                  ~8.5% of households
                                                                                                                                                                       $0                                                                  -20%
                                                                                                                                                                             2007 2008 2009 2010 2011 2012 2013 2014 2015 2016 2017 2018

                                                                                                                                                                                             Annual Spend        Y/Y% Growth

                                       Number of $200K Households in the US                                                                                                 Household Furniture Expenditure By Income
                                  12                                                                                                                                 9.0%
    >200K Households (millions)

                                  10                                                                                                                                 8.0%
                                                                             8.9% CAGR                                                                               7.0%
                                  8                                                                                                                                  6.0%
                                  6                                                                                                                                  5.0%
                                                                                                                                                                     4.0%
                                  4                                                                                                                                  3.0%
                                                                                                                                                                     2.0%
                                  2
                                                                                                                                                                     1.0%
                                  0                                                                                                                                  0.0%
                                       2002
                                              2003
                                                     2004
                                                            2005
                                                                   2006
                                                                          2007
                                                                                 2008
                                                                                        2009
                                                                                               2010
                                                                                                      2011
                                                                                                             2012
                                                                                                                    2013
                                                                                                                           2014
                                                                                                                                  2015
                                                                                                                                         2016
                                                                                                                                                2017
                                                                                                                                                       2018
                                                                                                                                                              2019

                                                                                                                                                                              Lowest 20%   Second 20%   Third 20%   Fourth 20%   Highest 20%

Source: US Census, Jefferies, Company Filing
External Analysis
RH’s target customers are typically unaffected during an economic downturn

                                                 Changes in Net Worth by Wealth Quantile between 2001:Q1 and 2005:Q1
                      Total Net Worth Held by the Top 1% (99th to 100th Wealth Percentiles), Q1 2001=100             Total Net Worth Held by the 90th to 99th Wealth Percentiles, Q1 2001=100
                      Total Net Worth Held by the 50th to 90th Wealth Percentiles, Q1 2001=100                       Total Net Worth Held by the Bottom (1st to 50th Wealth Percentiles), Q1 2001=100
             170
             160
             150
             140
     Index

             130
             120
             110
             100
              90
              80
                         0           1           2           3           4      5     6     7     8      9     10      11      12      13       14       15      16       17       18      19          20
                                                                                                 Periods from Value Scaled to 100
                                                 Changes in Net Worth by Wealth Quantile between 2007:Q3 and 2017:Q3
                     Total Net Worth Held by the Top 1% (99th to 100th Wealth Percentiles), Q4 2007=100             Total Net Worth Held by the 90th to 99th Wealth Percentiles, Q4 2007=100
                     Total Net Worth Held by the 50th to 90th Wealth Percentiles, Q4 2007=100                       Total Net Worth Held by the Bottom (1st to 50th Wealth Percentiles), Q4 2007=100

             160
             140
             120
             100
     Index

              80
              60
              40
              20
               0
                     0       1   2       3   4       5   6       7   8       9 10 11 12 13 14 15 16 17 18 19 20 21 22 23 24 25 26 27 28 29 30 31 32 33 34 35 36 37 38 39 40
                                                                                                Periods from Value Scaled to 100

Source: Board of Governors of the Federal Reserve System (US)
04
Investment Thesis
Investment Thesis Overview
RH’s current business model and growth potential is underestimated by the market

 1
                                  ▪   RH is the only luxury retailer with scale due to its unique business model
                                  ▪   The company’s recent real estate strategy to pursue new larger design galleries show
      Unique Business Model           superior unit economics that establish a robust competitive advantage for RH
                                  ▪   New design galleries help to enhance RH’s luxury customer experience along with
                                      complementary interior design services and the RH membership program

  2
                                  ▪   RH can continue to drive value creation by expanding their store count and increasing
                                      margins in existing retail stores
 Domestic Growth & Continued
                                  ▪   The company has an extensive runway for growth domestically and internationally
       Transformation             ▪   Continued transformation of traditional legacy stores to more efficient design galleries
                                      is overlooked by the market

 3
                                  ▪   RH has significant potential to expand internationally
                                  ▪   The company recognizes that there is an immense opportunity to grow with no true
      International Expansion         competitor in the international market
                                  ▪   Management forecasts a majority of revenue to eventually come from their
                                      international segment
Thesis I: Unique Business Model
RH will continue to close stores operating as a Legacy Gallery, replacing them with new Design Galleries
and an integrated hospitality experience
                                                                  Store Count Breakdown
                                                                  1                                            2
                                                                                                         85              83            86            83
           74              71               70            70           67                 69

                                                                                                       73.9%           68.1%          62.3%        58.0%
                                                                                        79.7%

                                                                                                                       23.2%          29.0%        31.9%
                                                                                        11.6%          18.8%

         2011             2012             2013          2014          2015              2016           2017            2018          2019           2020
                                 Design Galleries   Legacy Galleries   Modern          Baby & Child and Teen       Waterworks Showrooms

                                                          2016                  2017                   2018                    2019           2020
       Design Galleries with Hospitality                    1                    1                       4                      8             10
       Design Galleries Store Count                         8                   13                      16                     20             22
       Legacy Galleries Store Count                        55                   51                      47                     43             40

  ▪1       In 2015, RH launched two new product categories, RH Modern and RH Teen. In May 2016, RH acquires 15 stores of Waterworks, a
           luxury bath and kitchen brand for $119.9M. Focus has been more recently to elevate brand rather than increase product offerings
  ▪2       Since opening the first hospitality experience in 2015 with RH Chicago, RH has continued to prioritise the hospitality experience and
           management expects to operate a total of 60-70 design galleries in the US and Canada from 22 currently

Source: Company Filings
Thesis I: Unique Business Model
RH’s real estate transformation is unique to other retailers by showcasing products in an architecturally
inspiring, upscale environment that ultimately drives sales and elevates the RH brand
             Legacy vs. Design Gallery Unit Economics                        Implications of New Design Galleries
                                                                      ▪   Sales, profits, and cash flows improve: higher average
                                                                          order values driven by purchases of multiple pieces,
                                                                          additional yield of 10-20% lift in DTC Revenue
                                                                      ▪   Low capital investment: RH is able to negotiate superior
                                                                          deals with landlords in high-end retail centers
                                                                      ▪   Luxury customer experience: hospitality from integrated
                                                                          restaurants and interior design services

                                                                          Store Economics Against Furniture Retailers

                       Larger design galleries with superior unit economics show a robust competitive advantage

Source: Company Filings, J.P. Morgan Initiating Coverage
Thesis I: Unique Business Model
RH is moving beyond a traditional leasing approach with a multi-pronged strategy that seeks to lower
capital requirements, improve unit economics, and drive significantly higher ROIC
                                                                                 Real Estate Strategy

                                         Real Estate Development Model                           Joint Venture Model                      Capital Light Model

    Mechanics                        ▪     Sale-leaseback or pre-selling the            ▪       Contribute value of lease to         ▪   Covenants and restrictions
                                           property                                             development in exchange                  limiting sale of properties
                                                                                                for profit interest in project       ▪   All of RH’s deals are capital light
                                     ▪     Leverage strength of RH balance sheet,
                                           operations, and strategic ability to sell    ▪       Used when RH can’t outright              as many landlords are offering to
                                           real estate                                          buy property                             subsidize their buildout cost

                                     ▪     Recoup/achieve gains on substantial          ▪       RH shares the upside of              ▪   65-100% of capital requirement
   Advantages                              amounts of capital                                   development with landlord                funded by landlord, versus
                                     ▪     Sale leaseback enables lower expenses                                                         35% to 50% previously
                                                                                        ▪       Minimal capital investment to
                                     ▪     As the main anchor tenant in                         operationalize the business          ▪   Recoup most, if not all, of capital
                                           shopping districts, RH can secure                                                             investment
                                           galleries 50% lower than prior stores

                                     ▪     Yountville: Acquired, developed, and         ▪       Gallery and Guesthouse in            ▪   RH executes 40-year lease.
     Examples
                                           executed sale leaseback at 4.26% cap rate.           Aspen: Developer will deliver to         Landlord contributes $20M TA
                                           Recouped vast majority of capital                    RH a substantially turnkey Gallery       toward $28M gallery for RH net
                                                                                                and Guesthouse, while RH retains         capital investment of $8M.
                                     ▪     Edina: Expect to complete sale leaseback
                                                                                                a 20% and 25% profits interest in        Development pro-forma
                                           in 1H20 at 5-5.25% cap. Expect to
                                                                                                properties, respectively                 projects return of capital within
                                           recoup most of investment
                                                                                                                                         8-10 months

       Pipeline                      ▪     Detroit, Morristown, Naples                      ▪      Not disclosed                     ▪   15 potential deals in
                                                                                                                                         development pipeline

Source: Company Filings, Jefferies
Thesis I: Unique Business Model
RH’s unique retail strategy strengthens the consumer experience and elevates the RH brand

                                                    A Luxury Customer Experience

             RH Hospitality              RH Interior Design               RH Membership                   Unique Products

     Direct Increase to Sales          Largest Interior Design          95% of Core Business               Wide Assortment
            New galleries with RH             Platform                         By 2017, the                RH’s product offerings
              Hospitality drive 2x         RH rolled out design            membership program                span a wide range
            more stores sales along      ateliers in all RH stores in      accounts for 95% of            including even outdoor,
            with a 10-20% increase      2016, using this service as a        the core business           rug, beach house, and ski
             in the DTC Channel         differentiator for the high-                                          house categories.
                                                end consumer               415,000 Members
            3-4x More Traffic                                            RH currently has 415,000            New Releases
             The café inside the                   65%                      members in 2020              Introducing new products
         Chicago 3 Arts Club tracks     Currently 65% of the retail                                        of RH Color and RH
         5-6M annual sales and was       business is coming from                 Benefits                  Contemporary in 2021
         the 7th most Instagrammed       members that use RH’s             RH Members program
              restaurant in 2018          interior design services          results in reduction in              Design
                                                                         returns and sales volatility,    RH works closely with a
              Unique Layout            Low Capital Intensity                 improved inventory
         The inspiring architectural                                                                     network of artisan partners
                                         This personalized service         management and larger            to develop products
         layout entices consumers        helps sell more with little              purchases
         to purchase the furniture         capital requirements

        RH has curated a full-scale luxury lifestyle brand by continuing to strengthen its services and offerings

Source: Company Filings
Thesis II: Domestic Growth and Continued Transformation
What is the opportunity for domestic growth?

                 Management Commentary                                                         RH Design Gallery Markets

 ▪    The CEO sees a “clear path to $4 billion to $5 billion in                    Addressable Market = Households with >$100K in
      North America revenues”                                                                          Income
 ▪    Management foresees having 60 to 70 locations in the
      United States and Canada
                                                                                                 Average Population of 894,111
 ▪    Introduce galleries at a pace of 5 to 7 per year from the
      current rate of 3 to 5

                                                                                             Average Addressable Market of 212,196

                             US Markets with Design Galleries (Excluding California and NYC)
 3,000,000
 2,500,000
 2,000,000
 1,500,000
 1,000,000
  500,000
        0

                                                           Population   Addressable Market
Thesis II: Domestic Growth and Continued Transformation
There is still room for RH to expand their business domestically

               Significant Expansion Opportunity                                                            Potential Market Characteristics
 100.0%                                                                                                                       Population      Addressable Market
                                                                                           Existing Design Galleries            894,111             212,196
  80.0%                                                                                    Potential Design Galleries          1,189,936            264,489
  60.0%
                                                                                             ▪     The company has opportunities to expand to 11 new
  40.0%                                                                                            markets with similar demographics to their current
  20.0%                                                                                            domestic galleries

   0.0%
                                                                                             ▪     Management willingness to grow domestic revenue lends
                                            1                                                      confidence to these projections
          Design Galleries    Modern Galleries     Potential Design Galleries

                                                                Potential Markets to Address
 1,800,000

 1,400,000

 1,000,000

  600,000

  200,000

 -200,000       Phoenix      Philadelphia   Washington   Fort Worth     Jacksonville    Montreal      Ottawa    San Antonio    Portland    Calgary   Edmonton

                                                                        Population     Addressable Market
Thesis II: Domestic Growth and Continued Transformation
Market for domestic growth is almost certain and is accretive to shareholders

                 Domestic Revenue Growth                                            Base Case Domestic Store Build
New Design Galleries                                            11   5
Retired Legacy Galleries                                         4
                                                                     4
Design Galleries
Total Selling Square Feet                                  418,000   3
Sales per square foot                                       $1,000   2
Discount for Gallery                                         -30%
Sales per square foot                                         $700   1

Accretive Revenue                                    $292,600,000    0
                                                                           2021   2022    2023   2024   2025    2026    2027   2028    2029    2030
Legacy Galleries
Total Selling Square Feet                                 -30,000                          Design Galleries     Secondary Galleries
Sales per square foot                                      $1,000
Premium for Legacy                                            10%
Sales per square foot                                      $1,100                        Operating Margin Expansion
Revenue Effect                                       -$33,000,000
                                                                     25.0%
Net Revenue Impact                                  $259,600,000
Operating Margin                                           20.0%     20.0%
Implied EBIT                                          $51,920,000    15.0%
Assumed EV/EBIT                                             15.5X    10.0%
Implied EV Addition                                 $804,760,000
                                                                         5.0%
Current EV                                        $11,654,800,000
Total EV                                          $12,459,560,000        0.0%
Percent of Enterprise Value                                  6.5%

                                                                                  Base Case Operating Margins       Street Operating Margins
          Upside through domestic markets is very likely
Thesis III: International Expansion
Can RH expand successfully expand in international markets?

               Management Commentary                                             Competitive Landscape in Europe
                                                                                           High Quality
 ▪   Management believes that, in the long run, 75% of
     revenue will be generated from international markets
 ▪   The CEO remarked that “there is a complete void in the
     market for a concept like (RH’s)”
                                                                    Cheap                                             Expensive
 ▪   CEO stated that RH has been offered retail partnerships
     from every continent excluding Antarctica

                                                                                            Low Quality
                                             Portion of Revenue from North America
 50.0%
              43.5%
 40.0%

 30.0%                              26.8%
                                                            23.5%
                                                                            19.1%             18.7%          18.0%
 20.0%

 10.0%

 0.0%
              Tiffany              Ferrari              LVMH                Kering           Burberry        Hermes
Thesis III: International Expansion
The addressable market for RH in Europe is significant

                        International Expansion is a Free Option                                       Limited Expansion Risk
International Revenue                                                             $0   ▪   Supply chain is largely insulated from international
Implied Domestic Revenue CAGR                                                  3.1%        expansion due to limited inventory held at stores
New Galleries Opened                                                              31
                                                                                       ▪   RH has successfully sourced locations in Europe that can
Legacy Stores Closed                                                              19
                                                                                           support their need for large square footage
Implied Upside (base case)                                                    55.8%
Exit Multiple                                                                 22.0X    ▪   Past initiatives to reduce SKUs and reduce
                                                                                           underperforming inventory have streamlined RH’s supply
Implied Upside (no int'l revenue)                                              0.0%
                                                                                           chain
Exit Multiple                                                                 14.0X
Average Home Furnisher Multiple                                               15.5x                       Addressable Market

                           Failed international expansion poses little risk                35 cities with 1mm+ pop. in Europe

                      20,000                                                   6.0%
                                                                                            214 cities with 1mm+ pop. in Asia
  Thousands (000’s)

                                                                               5.0%
                      15,000
                                                                               4.0%
                      10,000                                                   3.0%

                       5,000
                                                                               2.0%          10 cities with 1mm+ pop. in USA
                                                                               1.0%
                          0                                                    0.0%
                                      Europe                 United States
                                                                                            3 cities with 1mm+ pop. in Canada
                                      Millionaires     % of Population
Thesis III: International Expansion
Short-term international expansion is transparent while growth is uncertain in the long term

              Current Expansion Initiatives                                                   Base Case International Revenue

 ▪   RH's is starting its expansion into Europe, with first gallery            100.0%
     in U.K. and Paris opening in early 2022                                    80.0%

 ▪   Lease deals for galleries are finalized in central London,                 60.0%
     Munich and Dusseldorf and set to open by end of 2023                       40.0%

 ▪   The UK is one of the biggest and most rapidly growing                      20.0%
     segments in the luxury furniture market; success in this                    0.0%
     country can bring up to $600M in revenue if RH is able to                           2021     2022   2023   2024   2025   2026   2027   2028   2029    2030

     capture 2.5%-3% of the market share                                                           International Revenue      Domestic Revenue

                                                         International Store Build
 6

 5

 4

 3

 2

 1

 0
       2021           2022          2023          2024            2025          2026              2027             2028              2029           2030

                                                         Design Galleries   Secondary Galleries
05
Valuation
Comparable Companies Analysis
RH currently trades on a 20.2x EBIT multiple compared to peer mean of 20.9x despite a 19.8% margin

                                                          On an EV/EBIT basis RH currently trades higher in
                                                      comparison to home retailer peers. However, we believe this
                                                         is fair given RH is a luxury retailer and thus warrants a
                                                      higher premium. This is evident through RH’s higher EBIT
                                                                                  margins.

                                                      Share price appreciation will result from continued margin
                                                        expansion, earnings growth, and international growth.
Comparable Companies Analysis
RH has similar margins compared to luxury peers but trades more in line with home furnishers
                30.0%   28.5%   25.5%
                                        21.0%   19.8%
                20.0%                                   16.8%   15.5%
                                                                        12.8%
Margin

                                                                                11.8%   11.7%
EBIT

                                                                                                 10.9%
                10.0%                                                                                    3.1%
                0.0%
                         RMS    KER     RACE     RH     MC      HD      BRBY    WSM     HOME     LOW     ETH

                60.0x   50.1x   49.0x
                50.0x                   38.9x
EV/EBIT

                40.0x                           33.0x
                                                        26.5x
  LTM

                30.0x                                           21.7x   20.2x   17.9x    16.5x   16.1x   15.0x
                20.0x
                10.0x
                 0.0x
                        RMS     RACE    ETH     MC      BRBY    KER      RH     HOME     HD      WSM     LOW

                50.0x   39.1x
                40.0x           34.1x
EV/EBIT
 NTM

                30.0x                   22.8x   21.2x   19.2x   19.0x   17.3x   15.5x
                20.0x                                                                    14.8x   14.7x   13.3x
                10.0x
                 0.0x
                        RMS     RACE    MC      BRBY    KER     HOME     HD      RH     LOW      WSM     ETH
                15.0x
Net Debt/EBIT

                        9.9x
                10.0x
                                6.2x
     LTM

                 5.0x                   3.4x    2.5x    2.4x    2.0x    1.9x    1.8x    1.7x     1.6x
                                                                                                         NM
                 0.0x
                        HOME    ETH     RH      LOW     MC      KER     BRBY    HD      RACE     WSM     RMS
Valuation
RH has historically traded around ~30x EBIT multiple in 2017, the company increased EBIT margins from
15% to 20% since then which has resulted in a lower multiple compared to historical average
                            Multiple Expansion                                        EBIT Margins Consistent with Luxury Peers
                                                                                      35.0x                                            25%
   ▪         RH could realize multiple expansion with increased int’l                                                      21%
             presence, as shown in past retailers                                     30.0x
                                                                                                                                       20%
   ▪         More lucrative customer base and higher average basket                   25.0x

                                                                        NTM EV/EBIT

                                                                                                                                             EBIT Margin
             price compared to traditional home retailers                             20.0x   20%                                      15%
                                                                                                          11%
   ▪         Membership and hospitality segments command a                            15.0x                                28.6x       10%
             premium
                                                                                      10.0x
                                                                                              15.5x
   ▪         Successful expansion to European markets and margin                                          15.5x                        5%
                                                                                       5.0x
             improvements can warrant higher multiple as the current
             discount is due to worries about execution risk                             –                                             0%
                                                                                              RH      Home Retailers   Luxury Brands
        Under Armor: Multiple Expansion As Int’l Rises                     Ralph Lauren: Multiple Expansion As Int’l Rises

Source: Jefferies
Discounted Cash Flow Analysis – Base Case
The DCF shows that RH is trading at a discount to its intrinsic value
Free Cash Flow Build

                                                            2021E       2022E      2023E      2024E       2025E       2026E      2027E       2028E       2029E        2030E
Revenue                                                   2,969       3,110      3,289      3,482       3,681       3,847      4,046       4,238       4,413        4,593
EBIT                                                      629.5       665.6      710.4      759.1       809.9       854.1        906       957.7     1,006.3      1,056.5
 NOPAT                                                    497.3       525.9      561.2      599.7       639.8       674.8      716.0       756.6       795.0        834.6
 (+) D&A                                                  134.3       141.0      150.0      160.7       172.6       184.3      198.4       213.1       228.1        244.2
(-) Capital Expenditures                                 (109.9)     (115.1)    (121.7)    (128.8)     (136.2)     (142.4)    (149.7)     (156.8)     (163.3)      (170.0)
(-) Changes in Net working capital                        (90.2)        (0.6)      (0.8)      (0.9)       (0.9)       (0.7)      (0.9)       (0.9)       (0.8)        (0.8)
   Unlevered Free Cash Flow                               431.5       551.2      588.7      630.6       675.4       716.0      763.8       812.1       859.0        908.1
PV  Unlevered
Discount Period Free Cash Flow                           406.4 1      479.3 2   472.7 3    467.5 4      462.3 5     452.5 6    445.6 7    437.5 8     427.2 9       417.0 10

                                                                                                                        IMPLIED UPSIDE/(DOWNSIDE)
                                                                                                                                     Exit Multiple
WACC                                     Exit Multiple Method                                         70796.2%      20.0x     21.0x     22.0x        23.0x         24.0x
% Debt                         15.5%     Terminal Year EBIT                      $1,057                 6.3%      $779.70   $809.47   $839.23      $869.00       $898.77
% Equity                       84.5%     Exit Multiple                            22.0x                 7.3%      $715.55   $742.72   $769.89      $797.06       $824.23
                                         Terminal Value                         $23,243                 8.3%      $657.20   $682.02   $706.84      $731.66       $756.48
                                         WACC                                     8.3%                  9.3%      $604.07   $626.76   $649.46      $672.15       $694.84
                                         PV Terminal Value                      $10,674                10.3%      $555.64   $576.41   $597.18      $617.94       $638.71
                                         Sum PV UFCF                             $4,566
Cost of Debt                    8.9%
Tax Rate                       21.0%     Enterprise Value                       $15,240
After-Tax Cost of Debt          7.1%      % Enterprise Value                     70.0%

                                         Less: Debt                              $1,572                                IMPLIED UPSIDE/(DOWNSIDE)
Risk Free Rate                   2.5%    Add: Cash                                $148                                           Exit Multiple
Levered Beta                      1.10   Equity Value                           $13,815                55.8%       20.0x     21.0x       22.0x 23.0x              24.0x
Equity Risk Premium              5.5%                                                                   6.3%       71.5%     78.1%       84.6% 91.2%              97.7%
Cost of Equity                   8.5%    Fully Diluted Shares Outstanding         19.514                7.3%       57.4%     63.4%       69.4% 75.4%              81.3%
                                           Implied Share Price                    $708.0                8.3%       44.6%     50.1%       55.5% 61.0%              66.4%
                                           Current Share Price                    $454.5                9.3%       32.9%     37.9%       42.9% 47.9%              52.9%
WACC                            8.3%     Implied Upside/(Downside)                55.8%                10.3%       22.2%     26.8%       31.4% 36.0%              40.5%
06
Risks & Mitigations
Risks & Mitigations
Several risks could have adverse implications on the value of RH

                                                   Details                                   Mitigation

                                   ▪   RH's new business model includes         ▪   RH predicts unfulfilled orders will
                                       keeping light inventory, but sources         add $80-100MM to revenue in 2021
                                       70% of products from Asia
                                                                                ▪   RH is expanding U.S. manufacturing
     Supply Chain Bottlenecks      ▪   Mismanagement of supply chains               capabilities, potentially bolstering
                                       and pandemic-related disruptions to          product delivery and quality
                                       world trade could result in lost sales
                                       and lagging revenue growth               ▪   Transforming supply infrastructure
                                                                                    with new distribution center

                                                   Details                                   Mitigation

                                   ▪   Incremental tariffs on Chinese           ▪   “Being overly reactive and moving
                                       imports could be critical as 38% of          sourcing around in product
                                       RH's total merchandise sales are             categories like ours can present
    Trade Tension Between U.S.         sourced from China                           massively more risk.” said CEO
            and China                                                               Gary Friedman
                                   ▪   In case of strong tensions between
                                       U.S. and China, relocating               ▪   Management is mitigating the
                                       operations may need to be                    impacts through pricing and
                                       considered                                   sourcing adjustments
Risks & Mitigations
Several risks could have adverse implications on the value of RH

                                  CEO Gary Friedman is a Polarizing CEO

                                                                               Details
                                           ▪   Gary Friedman is an erratic CEO who promises lofty goals for the company
                                           ▪   From 1988 to 2001, Friedman worked for Williams-Sonoma until appointed as
                                               co-chief executive officer of RH in 2001
                                           ▪   He has a mission to grow RH into a global luxury brand and has devoted his
                                               career to achieving this goal – he is almost inseparable from the RH brand
                                           ▪   Friedman led the failed launch of RH Modern, causing a 70% decline in the
                                               stock price
                                           ▪   Following, RH executed a partial LBO of itself, issuing ~$1B in debt for share
                                               buybacks, giving Friedman over ~50% ownership at the time

                                                                              Mitigation

                                           ▪   The CEO owns approximately 10% of the company and has a majority of his
                                               net worth in the shares
                                           ▪   Friedman’s compensation plan is heavily tied to the performance of RH’s
                                               shares, incentivizing him to increase the value of RH’s stock
                                           ▪   Upon first joining RH, Friedman spent his own money to keep the company
                                               from going bankrupt in 2001, reinventing the company to become RH today
                                           ▪   Rather than chasing short term growth, RH management stays true to the
                                               furniture business by rejecting the idea of a mass integration of restaurants
                                               into the business
07
Catalysts
Catalysts
Successful execution of long-term strategy can appreciate market value by 6 – 8x in 2030

                     • Continued demand from COVID-19 related drivers could continue to increase sales and

                                                                                                                       Short Term
                       margins in Q4/Q1 2021 earnings
   Strong Q4/Q1      • Growth following COVID-19 normalization persists as the furniture purchase cycle is often
     Earnings          elongated
                     • Real estate transactions continue to grow, creating continued demand for luxury furniture

                     • RH is expanding to Europe with the first two galleries opening in the UK in 2022
                     • Management has already signed or is finalizing lease agreements for 5 other locations in
    International
                       Europe
     Expansion
                     • Continued store expansion in Europe and strong unit economics will deliver value to RH’s

                                                                                                                       Medium Term
                       shareholders

                     • Introduction of smaller RH galleries to secondary markets will generate greater margins and
                       sales for RH
  Further Domestic   • Expansion of large-scale galleries to underserved metropolitan markets will continue to drive
     Expansion         growth
                     • Introduction of new product lines will increase SSSG and drive growth

                     • Management achieves 2030 targets for RH

                                                                                                                       Long Term
                     • RH is successfully transitioned into a global luxury brand and develops a luxury ecosystem of
   Success in 2030
                       products & services
    Target Goals
                     • RH’s continued shift to luxury products further expands margins
                     • Growth opportunities in international markets still prevail
08
Investment Summary
Investment Recommendation

                          Recommendation

                   Buy RH (NYSE: RH) at $454.52
                          Target Price: $708
                        Implied Upside: 55.8%
9
Appendix
COVID-19 Related Drivers

                                                           Margin Expansion

30%

20%

10%                                                                                                                                 COVID-19
                                                                                                                                     Pandemic
 0%
         Q1 Q2 Q3 Q4 Q1 Q2 Q3 Q4 Q1 Q2 Q3 Q4 Q1 Q2 Q3 Q4 Q1 Q2 Q3 Q4 Q1 Q2 Q3
        2016 2016 2016 2015 2016 2016 2016 2016 2017 2017 2017 2017 2018 2018 2018 2018 2019 2019 2019 2019 2020 2020 2020

                                                                     EBIT Margin

               COVID-19 Margin Expansion                                                     Continued Demand Drivers

▪     Increases in wealth and home investment trends bolstered              ▪      RH is looking to sustain recent success through larger
      demand throughout the pandemic                                               stores and exploring “luxury demand’ vs. home furnishing
       –    Core business demand was +33% YoY                                      demand

▪     Sustained volume allowed for the spreading of fixed costs             ▪      Efforts will include the reopening of restaurants, store
                                                                                   capacity, and mailing source books
▪     Margins increased as a result of closing lower priced outlet
      stores and decreasing SG&A through not sending out                    ▪      ‘Brand elevation’ (higher prices and more volume from
      sourcebooks                                                                  producers) will result in sustained future margin growth
Product Quality
RH’s high prices are not just for the furniture

           Complimentary Interior Designers                                           Product Reviews

 ▪   RH has fully integrated the design process with a full      ▪   RH reviews on popular product review sites are not as
     design platform offered through their membership                positive as expected given the high price points of the
     program                                                         product

 ▪   RH’s high prices reflect the inclusion of design services   ▪   Reviews have become more positive following the
                                                                     transition to RH galleries from legacy stores
     and a superior retail experience
                                                                 ▪   RH has a 1.5 star rating on ConsumerAffairs.com
 ▪   Interior designers at RH are compelled to only purchase
     products from RH                                            ▪   Many consumers do not believe RH furniture is worth the
                                                                     price

                 Quality Relative to Peers                                                 Suppliers

 ▪   RH remains a premier furniture manufacturing company        ▪   70% of products were sourced from Asia, 16% from the
 ▪   The company shares third party vendors with other higher        USA and the remainder from other countries
     end furniture manufacturers, including Williams Sonoma      ▪   Approximately 38% of products are sourced from China
 ▪   RH differentiates their products through superior designs   ▪   Identical RH products have been found on Alibaba that are
     with their design partners and strong marketing through         being sold directly from the supplier at a fraction of the
     their catalogs                                                  cost
Customer Reviews and Segmentation
Their gallery renovation has increased overall customer retail experience

                               Overview                                                          Customer Segmentation

 ▪    Renovations from Restoration Hardware retail store to RH              ▪      RH targets casual customers and interior designers
      Gallery increased the overall customer retail experience              ▪      Customer profiles: 40+ y/o, annual income >$200K
      with increased walk-in buyers and sales figure
                                                                            ▪      Interior designers are not the main customer base
 ▪    Positive customer reviews from the store are usually
                                                                                    –     Immense investment in shopping/dining experience
      generated by their restaurants and interior design; New
      York Rooftop location has 4 stars ratings with 348 reviews                    –     Designers source from more cost-effective vendors
                                                                                    –     RH’s design service rivals with 3rd-party designers
 ▪    Quality of RH's furniture is still being questioned, general
      consensus on quality not matching its price range                             –     RH offers the “designer’s discount” to everyone

                                                   Case Study: RH New York Gallery Yelp Reviews

                         Number of Yelp Reviews                                                           Consensus
100
 80
 60                                                        52                   Before Gallery (Avg 1.5 stars)     After Gallery (Avg 3.5 stars)
 40
 20                 6                                      9
                    24                                     22
  0                                                                         • Poor customer service              • Great dining experience
           Before Gallery Opened                   After Gallery Opened     • Lack of selection                  • Beautiful interior design
                                                                            • Low quality items                  • Overpriced items
                   1-2 Stars       2.5-3.5 Stars     4-5 Stars
2030 Management Objectives

                         Objectives                                                 Gary Friedman Quote

▪   Management is working to establish a global luxury brand
    in 2030 by:
     –    Expanding into Europe                                 “If you were sitting with us in out leadership team conference room,
     –    Achieving double digit revenue growth rates by
                                                                you would see our view of what we believe the next decade could
          opening 5-7 new stores per year
     –    Realizing a mid-twenty percent operating margin (by   look like. At a compounded annual growth rate of 10% to 15% we
          closing down legacy and outlet stores)
                                                                would generate annual revenue of $7.4 to $11.5 billion. If you

                                                                assume an adjusted operating margin in the mid-twenties and a
                       Bigger Picture
                                                                continued expansion of our valuation multiples, our market value
▪   Gary Friedman sees RH as the premier luxury home brand
                                                                could be $50 to $70 billion in 2030, our roughly 6 to 8 times our
▪   The brand will continue to develop ecosystems and
    ancillary offerings to furniture to advance this notion     current value. If you’re looking for a comp, take a glance at Hermes,
▪   Friedman views the robust business model and provision      exactly ten years ago today.”
    of not only luxury goods but luxury experience as
    deserving of a luxury retail multiple
Domestic Growth Opportunities – Case Studies
How substantial is the opportunity to address domestic markets?

                                              New Markets to Enter

                         Population
    Target City                                                          Description
                           TAM

                          1,633,020       •     Opportunity to enter this new market by converting an abandoned
                                                retail space to a high functioning design gallery
      Phoenix
                                          •     An urban environment and concentration of wealth make this an
                           326,604              attractive opportunity

                          1,584,540       •     Opportunity to enter this new market by converting an abandoned
                                                retail space to a high functioning design gallery
    Philadelphia
                                          •     An urban environment and concentration of wealth make this an
                           253,526              attractive opportunity

                          1,564,490       •     Opportunity to convert existing legacy store into a design gallery
                                          •     RH would either find a new retail space and close an existing store,
    San Antonio
                                                or expand square footage to accommodate to fit gallery
                           281,608              specifications

      RH has the opportunity to enter 7 new markets with design galleries and convert 4 legacy stores
2021 Expansion Initiatives
Upcoming pipeline

                                                          Domestic

          RH San Francisco               RH Dallas                         RH Oak Brook                RH Jacksonville
  (Historic Bethlehem Steel Building)   (Knox Street)                    (Oak Brook Center)        (St. Johns Town Center)
             60,000 sqft                 96,000 sqft                         41,500 sqft                 48,500 sqft
            Expected 2021               Expected 2021                      Expected 2021               Expected 2021

                                                        International

                        RH England                        RH Paris                             RH London
                      (Location TBA)                    (Location TBA)                        (Location TBA)
                        Spring 2022                       Fall 2022                            Spring 2023
Domestic Markets
How substantial is the opportunity to address domestic markets?

                                                        New Markets to Enter
 2,000,000

 1,500,000

 1,000,000

  500,000

        0
             Phoenix            Philadelphia       Washington          Fort Worth           Jacksonville   Montreal          Ottawa
                                                          Population   Addressable Market

                                               Opportunity to Convert to Design Gallery
 2,000,000

 1,500,000

 1,000,000

  500,000

        0
                  San Antonio                          Portland                             Calgary                   Edmonton

                                                          Population   Addressable Market
International Expansion Initiatives
When will international expansion occur?

                         Commentary                                                                Execution Risk

 ▪   Expansion into Europe was delayed one year due to the                  ▪    RH’s individual store inventory policies mitigate the risk of
     impacts of COVID-19 on designing spaces                                     any supply chain risks
 ▪   Management is close to finalizing deals for galleries in               ▪    RH does not need to dramatically expand their supply
     Brussels and Madrid                                                         chain to meet international demand
 ▪   There are 98 cities in Europe with populations over half a             ▪    Management successfully reinvented the business over the
     million people., compared to 46 in the United States and                    past decade while expanding margins, offering conviction
     Canada                                                                      in the team’s ability to grow the business

                                                    Current Expansion Initiatives

      RH England                     RH Paris                     RH London                    RH Munich                    RH Dusseldorf
     (Location TBA)                (Location TBA)               (Location TBA)                (Location TBA)                (Location TBA)
      Spring 2022                    Fall 2022                    Spring 2023                  Lease Signed                  Lease Signed
International Operating Capabilities
Can the company sustain industry leading operating margins in international markets?

                     Operating Capabilities                                        Hermes Operating Margin

 ▪      CEO recently remarked that the European market will            35.0%
                                                                       34.5%
        have higher margins than the United States                     34.0%
                                                                       33.5%
 ▪      Limited need to organize inventory and deliver to the
                                                                       33.0%
        markets, causing their cost structure to be relatively         32.5%
        insulated                                                      32.0%
                                                                       31.5%
 ▪      Limited number of stores will drive outsized leverage          31.0%
                                                                       30.5%
 ▪      Minor expenses and capex will be the leading costs             30.0%
                                                                                       Americas       Rest of World

                                                           Net Debt to EBITDA
 6.0X                  5.2X                             5.0X
 5.0X
                                                                                3.8X
 4.0X

 3.0X                                                                                                  2.5X

 2.0X

 1.0X

 0.0X
                       2018                             2019                    2020                   LTM
Developing a Luxury Ecosystem
RH is in the process of establishing a global luxury brand

                                      Establishing a Luxury Ecosystem

                 RH Guesthouses                                         RH Residences

                                                 RH
         RH Yountville                          Luxury                      The World of RH
                                                Brand

                    RH3 Yacht                                             RH Color

  “Building an ecosystem of products, places, services and spaces that establish the RH brand as a global
                                             thought leader”
                                   Gary Friedman, Q3 Shareholder Letter
Case Study: LVMH
RH is in the process of establishing a global luxury brand

                                          LVMH Luxury Ecosystem

                              Fashion                        Wines & Spirits

                                                  LVMH
                                                                     Watches &
                      Hospitality                 Luxury
                                                                      Jewelry
                                                  Brand

                            Perfumes &
                                                                  Retail
                             Cosmetics
Management Overview
Gary Friedman is a polarizing, visionary CEO who has transformed RH into a luxury retailer

     Gary Friedman: Not Your Traditional CEO                                                             Key Events

 ▪   Community college dropout                                            ▪ 2014: Friedman resumes his role at RH, launches the first
                                                                            RH gallery
 ▪   Began working part-time at the Gap in 1977, became
     President and COO of Williams Sonoma in 2000                         ▪ 2017: Friedman buys back $1 billion in shares
 ▪   Friedman served as Chief Merchandising Officer for
     Williams Sonoma and Pottery Barn                                     ▪ 2019: Friedman sells 500,000 shares to settle marital
                                                                            agreements and for personal liquidity needs
 ▪   After being passed up for CEO at Williams Sonoma,
     Friedman was appointed Co-CEO of RH in 2001                          ▪ 2020: COVID-19 pandemic bolsters demand ; RH has a
                                                                            ~766% return since Friedman resumed as CEO

                    Ownership Breakdown                                                                Top 5 Holders
                                   5.0%                                                               8.3%
                                                                                                                            14.4%
                                                       7.1%
                                   9.0%

                                                                                           8.4%

                                   78.9%

                                                                                                                          11.6%
                                                                                                  9.1%
                     % Total Shares Outstanding
                                                                           Fidelity   T. Rowe Price     Gary Friedman   Berkshire Hathaway   BlackRock
     Insitutions   Individuals/Insiders    Public   Hedge Fund Managers
Quality Shareholder Base
RH has a strong shareholder base that will hold management accountable

             RH Ownership Breakdown                                        Strong Shareholder Interest
 100%                                                      ▪     Pelham Capital has invested over 9% of their AUM into
                                                                 RH
 90%
                                                           ▪     Durable Capital Partners has invested 10% of their AUM
 80%                                                             into RH
 70%                                                       ▪     These active shareholders with significant stakes in the firm
                                                                 will hold management accountable for capital allocation
 60%
                                                                 policies
 50%

 40%                                                                          Institutional Ownership
 30%                                                       80%
                                                           75%
 20%
                                                           70%
 10%                                                       65%
                                                           60%
  0%
                                                           55%
           Pelham Capital Ltd   Durable Capital Partners
                                                           50%
           Berkshire Hathaway   Gary Friedman
           Others
Management Compensation Plan
Key Management’s compensation is heavily tied to shareholder performance

                                             CEO Gary Friedman’s Compensation Plan                                                                              Details

                                                                                                                                     ▪   Gary Friedman’s plan includes the ability to earn 700,000
                                                                                                                                         new shares if all performance targets are met yearly
                                            175,000                                       $800
Number of Shares Where Restrictions Lapse

                                                                                                                                          –    If the twenty-day trading price of the stock reaches
                                                                                                                                               $650 in 2021 (Year 1) 58,333 new shares will be

                                                                                                 20 Day Trading Price for RH Stock
                                                      58,334   58,333   58,333   58,333
                                                                                                                                               issued
                                                                                                                                     ▪   Restrictions lapse up to one quarter
                                            116,667
                                                                                                                                     ▪   As a result of achieving the $358 price target set out in
                                                                                                                                         2017, Friedman received a compensation package worth
                                                      58,334   58,333   58,333   58,333   $650                                           $171 - $176 million in Q3 2020
                                                                                                                                     ▪   The additional price target of $500 was achieved in Q4 on
                                             58,333                                                                                      01/12/2021

                                                      58,334   58,333   58,333   58,333

                                                                                          $500
Market Views
RH will continue to outperform analyst expectations

                 Bear                                     Bull                                  WIC

 ▪   Bearish views persist from poor      ▪   RH is a unique luxury retailer     ▪   RH will continue to beat EPS
     financial performance from               that will successfully grow            predictions and outperform over
     2015-2016, and risky buybacks            volume and margins                     the long run, securing market
     occurring at the same time                                                      share and successfully capturing
 ▪   RH operates and is investing in a    ▪   Investments in the RH                  demand faster than the market
     declining industry of in-person          ecosystem and continued                currently believes
     retail                                   economic trends will drive price
 ▪   Competitive advantages are not           appreciation                       ▪   Long term growth will be
     as robust as they appear                                                        achieved far after the pandemic
 ▪   Questions about membership           ▪   CEO Gary Friedman will
     renewal rates, length of leases in       successfully lead a revolution     ▪   Market views this as a good
     an industry ripe for disruption          from middling retailer to a            company, we view the business
 ▪   Short interest is roughly 15% of         leading luxury brand with a            as great
     float                                    strong business model
Return on Invested Capital
ROIC has increased with RH’s Real Estate Transformation and New Real Estate Development Model

                                                             ROIC Graph
20.0%

18.0%                                                                                                                           17.16%
                                                                                                              16.35%
16.0%                                                                                                15.41%            15.08%            14.93%
                                                                 14.80%                                                                           14.93%
                                                        14.51%

14.0%                                                                                       13.04%
                                                                          12.00%
                                                                                   12.13%
12.0%

10.0%

 8.0%                                           6.65%

 6.0%
                                        3.82%
 4.0%           3.11%           3.03%
        2.00%
                        1.65%
 2.0%

 0.0%
Bespoke Furniture Manufacturers
RH has achieved luxury at scale and now offers a more desirable service than local, bespoke services

                   Restoration Hardware                                                  Bespoke Services

 ▪   RH has cultivated a brand of exclusivity and quality,          ▪   Customers of bespoke services primarily seek the
     allowing consumers to convey the same level of pride in            following in furniture:
     their homes but with a better customer experience                   –    Specific size requirements
      –    RH may be considered a Veblen good                            –    Adherence to certain style requirements
 ▪   The business offers superior customer service through               –    Incorporation of a customers’ preferred material
     providing:
                                                                         –    A sense of extravagance/uniqueness
      –    Designers and interior consultations
                                                                         –    Close collaboration with producers gives a sense of
      –    Customer support and return policies                               assurance with the product
      –    Enjoyable shopping experience
      –    The ability to test out products before buying           ▪   The bespoke furniture industry has search costs attached
 ▪   Customers are aware of the RH brand and quality, lowering          with finding a provider of both satisfactory service and
     the barrier of information required to make a purchase             quality
 ▪   Same feeling as buying custom due to price point, ability to   ▪   In many cases consumers loose the ability to tout the brand
     say this is RH                                                     name of their furnishings
                                                                    ▪   Significant time lags exist between order and delivery
Past Transformations of Storefronts
RH’s ability to transform large storefronts into immersive retail experiences is unparalleled in retail

                                                                                         RH Chicago
                   RH Greenwich                        RH Chicago
                                                                                    at the Historic Museum of
               at the Historic Post Office        at the Historic 3 Arts Club
                                                                                          Natural History
   Before
   After
Unique Retail Experience
RH’s transformation from legacy stores to galleries has created a consumer experience that cannot be
replicated
         Restoration Hardware Store                                                    RH Galleries

                                                        2013

           1. Normal retail experience                                        1. No inventory on hand
       2. Immense selection of inventory                                  2. Immersive shopping experience
              3. Small store space                                         3. Over double the selling space
         4. Undifferentiated mall tenant                                 4. Highly sought-after anchor tenant

                 RH Galleries are proven to be a destination within the communities they reside
                                      Hobbs + Black Architects

                    The most exciting concept in retail since the creation of the Apple store
                                             Citron Research
Significant Anchor Tenant
With the decline of physical retail, RH has become the only significant anchor tenant for shopping districts

                                             Case Study: RH Denver, The Gallery at Cherry Creek
                                       Before                                                                      After

  ▪        RH has been able to secure new galleries at a rent per square foot that is about 50% lower than their prior mall-based stores
  ▪        All of RH’s real estate deals will be capital light as many landlords are offering to subsidize their buildout cost
  ▪        65% to 100% of the capital requirement is expected to be funded by the landlord in upcoming years, vs. 35% to 50% previously

      “We believe when you step back and consider: one, we are building a brand with no peer; two, we are creating a
   customer experience that cannot be replicated online; and three, we have total control of our brand from concept to
    customer, you realize what we are building is extremely rare in today’s retail landscape, and we would argue, will also
                                               prove to be equally valuable.”

Source: Citron Research
Membership Model
The RH experience is enhanced by the RH Membership Model implemented in 2016, as well as RH’s
complementary interior design services
                              Benefits                                         RH Membership Count

 ▪   Improved customer experience                             420,000

 ▪   Lower cancellations and returns                          415,000

 ▪   Improved operational costs                               410,000
 ▪   Less variability in selling price
                                                              405,000
 ▪   Fewer individual shipments
                                                              400,000
 ▪   Simplified sales forecasting
                                                              395,000
 ▪   Reduced downstream implications on supply chain                         2018              2019                  2020

                 RH Member Contribution                                    RH Interior Design & Artisans

                                                              ▪    The RH Interior Design services are more capital-light
                                                              ▪    RH one of the largest interior design platforms
                                                              ▪    Differentiated experience from RH members and interior
                                                                   designers

              % RH Member Contribution To Core Business
              % RH Non-Member Contribution To Core Business
Store Efficiency
Management’s decision to increase store size and decrease sales per square foot is working

                                                Sales Per Selling Square Feet
 $1.50

 $1.40

 $1.30

 $1.20

 $1.10

 $1.00

 $0.90

 $0.80
            2015             2016                         2017                    2018                        2019     2020

                           Decreases in Sales Per Selling Square Feet are Expected
 40.0%
 30.0%
 20.0%
 10.0%
  0.0%
 -10.0%
 -20.0%
               2015                    2016                          2017                              2018          2019

                                    Change in Selling Square Feet   Change in Sales Per Selling Square Feet
Growth in Real Estate Transactions
Low rates have been a significant catalyst for growth in the luxury furniture market

                                   Furniture Purchase Cycle                                     Demand for Second Homes & Luxury Homes

 ▪                     The design and furniture purchase cycle is typically               ▪     Demand for second homes increased by 100% year over
                       elongated and will drive demand for well past the                        year in October
                       slowdown                                                           ▪     Low rates coupled with a desire to relocate have caused
 ▪                     RH experienced product shortages in Q3 as demand                         significant increases in demand for vacation homes
                       exceeded supply over the period                                    ▪     Luxury homes sales surged 60.7% in Q4 2020, indicating
 ▪                     Temporary shifts away from urban areas will generate                     the impact of rising asset prices on wealthy families
                       significant revenue for RH

                                                                    Home Sales in the United States
                       7,500
                                                                                                                                       6860       6690
                       7,000                                                                                               6570
  Thousands of Units

                       6,500                                                                                    5980
                                            5760                                                     5860
                       6,000    5420                    5270
                       5,500
                       5,000                                      4330                 4700
                       4,500                                                   3910
                       4,000
                       3,500
                       3,000
                               Jan-20      Feb-20      Mar-20     Apr-20      May-20   Jun-20       Jul-20     Aug-20      Sep-20     Oct-20     Nov-20
Case Study on RH Modern
Expansion initiatives have stumbled in the past

                                RH Modern Debacle                                                        Aftermath
  ▪       Management announced they were launching RH Modern, a line             ▪   Comparable sales fell from 15% to 4% YoY and
          of modern furniture with the potential to open standalone RH               management revised their sales guidance
          Modern stores
  ▪       Vendors had difficulty ramping production, delaying sales and
                                                                                 ▪   RH COO promptly resigned and was replaced by Gary
          deliveries                                                                 Friedman
  ▪       Customers were forced to wait months for deliveries and many           ▪   RH stock fell approximately 70% and took years to recover
          items were out of stock
  ▪       Critics believe RH rushed the opening and had incredibly strict
          deadlines for

                                                                     RH Stock Price
  $120

  $100

   $80

   $60

   $40

   $20

      $0
       Jan-15          Mar-15      May-15   Jul-15     Sep-15      Nov-15   Jan-16    Mar-16    May-16     Jul-16     Sep-16    Nov-16

WSJ, Chicago Tribune
Nebraska Furniture Mart – Buffett Study
RH bears a high resemblance to a longstanding Berkshire holding

                          The Story                                   Nebraska Furniture vs. Restoration Hardware

 ▪   Nebraska Furniture Mart (NFM) was founded in 1937 by
     Russian immigrant Rose Blumkin                                                           NFM                    RH
 ▪   From an initial $500 investment, Blumkin grew NFM into                                                      Largest store is
     the largest home retail store in the country                                           Largest store is
                                                                   Large Store Fixtures                          70,000 square
                                                                                          560,000 square feet
 ▪   In 1983 Warren Buffet purchased 80% of NFM at a $60                                                              feet
     million valuation
 ▪   NFM has maintained high profitability (sales/square foot)         Profitability        ~$1,000/sq. ft       ~$1,000/sq. ft
     while operating immense store fixtures

                   The RH Progression                                                                              Restaurants,
                                                                                          Wide selection of
                                                                       Customer                                 galleries and look
                                                                                            items drives
 ▪   With a larger focus being placed on galleries, RH is moving       Experience                                  books drive
                                                                                               volume
     towards larger store fixtures (100,000+ square feet) in                                                          volume
     select markets, increasing consumer touchpoints, available
     collections, and driving increased volume
                                                                       Price Point         Discount Pricing     Premium Pricing
      –    Larger stores may decrease sales per square foot, but
           will offer faster payback ratios and drive ~4x more
           volume than current stores
                                                                   RH’s high profitability in operating large fixtures
 ▪   Such efforts will continue to separate RH from
     competitors                                                              acts as a barrier of entry
You can also read