Living in a Multi-Risk Chaotic Condition: Pandemic, Natural Hazards and Complex Emergencies - MDPI
←
→
Page content transcription
If your browser does not render page correctly, please read the page content below
International Journal of
           Environmental Research
           and Public Health

Article
Living in a Multi-Risk Chaotic Condition: Pandemic,
Natural Hazards and Complex Emergencies
Mohammad Amin Hariri-Ardebili 1,2
 1    College of Engineering and Applied Science, University of Colorado, Boulder, CO 80309, USA;
      mohammad.haririardebili@colorado.edu; Tel.: +1-303-990-2451
 2    College of Computer, Mathematical and Natural Sciences, University of Maryland,
      College Park, MD 20742, USA

 Received: 30 June 2020; Accepted: 3 August 2020; Published: 5 August 2020

 Abstract: Humans are living in an uncertain world, with daily risks confronting them from various
 low to high hazard events, and the COVID-19 pandemic has created its own set of unique risks.
 Not only has it caused a significant number of fatalities, but in combination with other hazard sources,
 it may pose a considerably higher multi-risk. In this paper, three hazardous events are studied
 through the lens of a concurring pandemic. Several low-probability high-risk scenarios are developed
 by the combination of a pandemic situation with a natural hazard (e.g., earthquakes or floods) or
 a complex emergency situation (e.g., mass protests or military movements). The hybrid impacts
 of these multi-hazard situations are then qualitatively studied on the healthcare systems, and their
 functionality loss. The paper also discusses the impact of pandemic’s (long-term) temporal effects
 on the type and recovery duration from these adverse events. Finally, the concept of escape from a
 hazard, evacuation, sheltering and their potential conflict during a pandemic and a natural hazard is
 briefly reviewed. The findings show the cascading effects of these multi-hazard scenarios, which are
 unseen nearly in all risk legislation. This paper is an attempt to urge funding agencies to provide
 additional grants for multi-hazard risk research.

 Keywords: multi-risk; COVID-19; pandemic; natural hazard; protest; healthcare system

1. Background
      Human existence involves exposure to many hazards [1], and various low to high risk
scenarios. While understanding a hazard and its associated risks may help prevent or reduce adverse
consequences, in many instances, people are unaware of the risks involved, making it difficult to
fight against an invisible enemy. Risk aversion is a robust characteristic of human decision making,
meaning people are less likely to gamble on something when they are unsure if they will obtain the
desired outcome. However, planning for risks becomes even more challenging when considering that
we live in a multi-risk world with infinite natural and man-made hazards, many of which we cannot
control and can occur at any time.
      The year 2020 will be remembered in the U.S. for several reasons: (1) The coronavirus began
to spread throughout the nation starting in February, with the first confirmed case reported on 21
January, according to CDC (https://www.cdc.gov/mmwr/volumes/69/wr/mm6918e2.htm). (2)
There were multiple natural hazards (NH) around the country, including two devastating dam failures
in Michigan and over 500 earthquakes in western Nevada (https://www.sfgate.com/earthquakes/
article/Nevada-Tonopah-earthquakes-6-5-aftershocks-15283968.php), and an above-normal Atlantic
hurricane season expected (https://www.cnn.com/2020/05/11/us/2020-atlantic-hurricane-season-
fast-facts/index.html). (3) Complex emergency (CE) situations arose at both national (e.g., Black
Lives Matter protests) and international (e.g., U.S.–China and U.S.–WHO tensions) levels. Other

Int. J. Environ. Res. Public Health 2020, 17, 5635; doi:10.3390/ijerph17165635   www.mdpi.com/journal/ijerph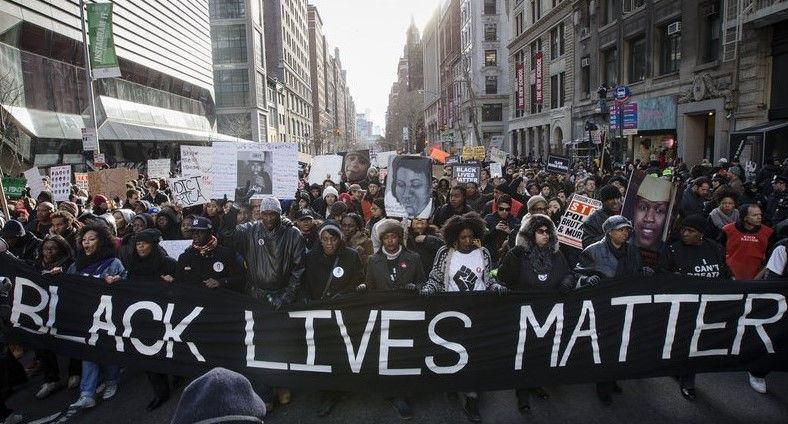
Int. J. Environ. Res. Public Health 2020, 17, 5635                                                      2 of 16

notable conditions included the ongoing climate crisis and economic contractions due to nation-wide
stay-at-home orders. For example, GDP fell 4.8% in Q1 2020, and unemployment increased by more
than 10% between April and May. Figure 1 illustrates the combination of multi-hazard factors that
many citizens are facing.

                                                                                    Natural
                                                                                    Hazards
                                    Epidemic/
                                                                  Economic
                                    Pandemic
                                                                   losses

                                          Fatality
                                                                                       Climate Change

                                                  Healthcare
                                                 Infrastructure         Unemployment
                                                   Network

                                                                       Protests
                                            Political
                                            Conflicts
                                                                   Complex Emergencies

                                                Figure 1. A multi-risk condition.

      This paper tries to briefly review three distinct risk sources that the U.S. is facing, Section 2;
followed by the concept of multi-risk analysis in Section 3. A perspective on low- to high-probability
risk scenarios for healthcare system impacts, functionality loss, and recovery duration is provided in
Section 4. Finally, the concept of NH-induced evacuation and sheltering during pandemic conditions
is revisited in Section 5.

2. Single-Hazard Risk

2.1. COVID-19 Pandemic
      In December 2019, the novel coronavirus pandemic, known as COVID-19, emerged from Wuhan,
China [2]. It is the most recent biological hazard and has resulted in a global outbreak. COVID-19 is
a potential zoonotic disease with a low to moderate mortality rate. Person-to-person transmission
may occur through droplets or direct contact [3], and therefore isolation of cases and contact tracing
are essential to controlling COVID-19 outbreaks, though the probability of successfully controlling an
outbreak decreases as the number of initial cases increases [4].
      As of 4 August 2020, there are about 4.8 million confirmed cases, 2.3 million recovered patients,
and about 160,000 deaths related to COVID-19 in the U.S. alone [5]. Multiple researchers have studied
the risks associated with a COVID-19 outbreak [6,7]. Although most of these studies are in preliminary
stages, different types of forecasting models have been proposed to predict the temporal and spatial
distributions of the virus when subjected to various constraints [8–10]. These projection models account
for factors such as the behaviors of citizens, impacts of social distancing, effectiveness of face coverings,
consequences of reopening, capacity of the healthcare system, pre-existing health conditions and age
groups [11,12]. It is noteworthy that there is an epistemic uncertainty (lack of current knowledge) [13]
in the exact number of infections and their spatial distribution. Therefore, making any decision about
the reopening of the states/cities is very difficult and challenging. This already caused extra political
problems and legal challenges. According to CNN (https://www.cnn.com/2020/07/16/politics/
georgia-kemp-mask-mandate/index.html), Georgia governor, Brian Kemp, announced that he is suing
Atlanta Mayor, Keisha Lance Bottoms, over the city’s mask mandate, claiming the measure violates his
emergency orders.
Int. J. Environ. Res. Public Health 2020, 17, 5635                                                                     3 of 16

     The risk of exposure to COVID-19 is an important factor in subsequent life loss (LL) estimations.
Among other factors, it is highly dependent on location, human concentration, and safety protocols.
An approximate COVID-19 risk map is shown in Figure 2a (as of 18 July 2020). The map is based
on incidence rate (i.e., the number of confirmed cases per 100,000 people), and since it accounts
for population density, it offers a more reliable metric for exposure risk. The map is subjected to
temporal changes.

   (a) Confirmed COVID-19 cases; adopted from Big Local News   (b) Natural hazards distribution; adopted from reddit

         (c) 2020 protests locations; adopted from USA Today   (d) Healthcare system distribution; adopted from KHN

      Figure 2. Spatial distribution of risk of exposure (pandemic), potential natural hazard, and mass
      gathering (of protests) across the U.S.; all maps are approximate and for illustration purposes only.

2.2. Natural Hazards
      Natural hazards are the result of a series of natural processes that have operated throughout earth’s
history [14]. Hazard analysis refers to a process of recognizing hazards that may arise from a system or
its environment, documenting their unwanted consequences, and analyzing their potential causes [15].
Natural hazards are classified as geophysical (e.g., earthquake, volcanic activity), meteorological
(e.g., tornado), hydrological (e.g., flood), climatological (e.g., drought), biological (e.g., epidemic),
and extraterrestrial (e.g., impact).
      Since the start of the COVID-19 pandemic in January 2020, several natural disasters have been
reported, including: (1) dozens of tornados in southern states in the U.S. between 12 and 13 April
(36 fatalities); (2) A 6.5 magnitude earthquake struck the western area of Nevada on 15 May, damaging
the main highway; (3) two dam breaks on 19 May in Michigan, U.S. (with 11,000 evacuees); (4) tropical
Storm Cristobal made landfall on 7 June, near the mouth of the Mississippi River and the island of
Grand Isle in Louisiana, brought winds of up to 85 km/h, and spawned a tornado in Florida; (5) seven
inches of rain caused flash floods in Wisconsin, washed out roads, and declared a state of emergency
on 29 June; and (6) as of late July, Hurricane Hanna has roared ashore onto the Texas Gulf Coast as a
Category 1 storm.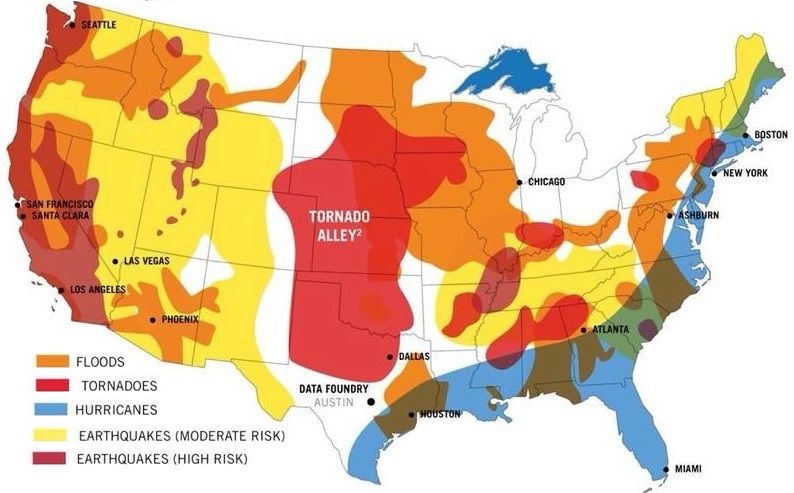
Int. J. Environ. Res. Public Health 2020, 17, 5635                                                     4 of 16

     In the U.S., FEMA provides the major disaster declarations every year [https://www.fema.gov/
disasters/year/2020?field_dv2_declaration_type_value=All]. Figure 2b is one of many maps showing
the approximate locations of various natural hazards across the country. The majority of risk maps for
natural disasters are developed based on their economic impact to properties (e.g., loss).

2.3. Complex Emergencies
      While multiple complex emergencies have developed since the start of the pandemic
(e.g., U.S.-China tensions, U.S. military movements in the Middle East), only those directly affected
by the spreading of COVID-19 inside U.S. borders are discussed in this paper. These can be
categorized into two main groups: (1) normal condition actions and (2) emergency condition responses.
Both categories are somewhat related to mass gatherings, which pose significant public health
challenges to health care professionals and governments [16]. Historically, sporting, religious, music,
and other mass gatherings have enabled the global spread of infectious diseases [17]; the situation
can become worse when face coverings, social distancing, and other preventative actions are not
fully observed by attendees. Authorities in each community must try to flatten the transmission
curve to give scientists more time to find a cure; however, mass gatherings move the needle in the
opposite direction.
      Multiple researchers have shown that the perceived risk of COVID-19 is affected by
politically-motivated interpretations of the risk. These patterns persist even in the face of state-level
mandates to close schools and non-essential businesses [18]. Studies show that political partisanship
may play a role in determining perceived risk during a pandemic, with potentially significant changes
in public health outcomes. According to Painter and Qiu [19], residents in Republican counties
are less likely to comply with stay-at-home orders than those in Democratic counties. Similarly,
Democratic-leaning counties responded more to recommendations from Republican governors than
from Democratic ones [20]. According to Adolph et al. [21], the results of the state-level database
analysis for five social distancing policies across all fifty states revealed that: all else equal, Republican
governors and governors from states with more President Trump supporters were slower to adopt
social distancing policies. Furthermore, it is reported that U.S. counties with lower per capita income
were associated with significantly reduced social distancing mandates [22]. Thus, the geographical
location of a pandemic is an important factor in its spread. According to Dincer and Gillanders [23],
in communities where corruption is endemic, observing social distancing during sheltering and
implementation of mitigation strategies is difficult. We should also highlight the mutual trust between
individuals and their communities [24], which yields a successful emergency mission during a
pandemic outbreak.
      The 2020 U.S. presidential election rallies are also a hot topic amongst voters. While many
believe the rallies should stop, President Trump did not cancel his June campaign in Tulsa, Oklahoma.
According to CNN (https://www.cnn.com/2020/06/25/politics/trump-tulsa-rally-coronavirus/
index.html), following this rally (20 June), at least eight staffers who were part of the rally preparation
tested positive, and the rest who attended the rally were quarantined. One may note that the
incubation period for COVID-19 is about 14 days, but the CDC (https://www.cdc.gov/coronavirus/
2019-ncov/hcp/clinical-guidance-management-patients.html) announced the median time of 4–5 days
(other resources reported similar data [25]). To date, there is no scientific research showing the
direct correlation between rallies and transmission of COVID-19. However, according to Fox
News (https://www.foxnews.com/politics/trump-campaign-says-two-more-staffers-who-attended-
tulsa-rally-tested-positive-for-coronavirus), at the same time as the rally, Tulsa County was experiencing its
own spike in infections, which drew concerns that Trump’s indoor rally could be a “super spreader” event for
the virus.
      One form of mass gathering during the pandemic has been protesting or marching by different
civil rights groups, and the U.S. has seen several such protests over the past three months. On 24 April,
nearly 1500 people gathered at the Wisconsin State Capitol in Madison to protest. Two weeks later,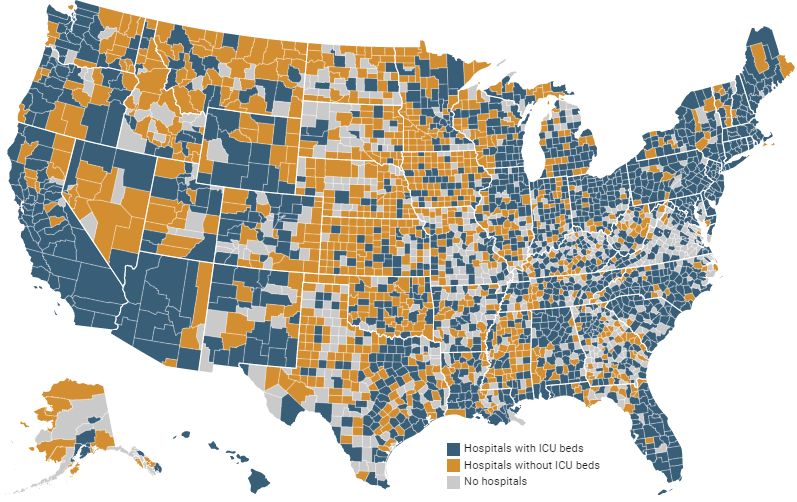
Int. J. Environ. Res. Public Health 2020, 17, 5635 5 of 16
the Wisconsin Department of Health Services confirmed 1986 cases of COVID-19. Of those, 72 people
reported having attended a large gathering, though patients were not asked specifically if they had
attended the protest [26]. It was observed that many protesters did not maintain a six-foot distance
from others or wear masks. On 15 April, there was a protest in Lansing, Michigan against the state’s
governor, Gretchen Whitmer, and her COVID-19 lockdown, Figure 3a. Again, there was no sign that
people were taking the COVID-19 related public health advice seriously.
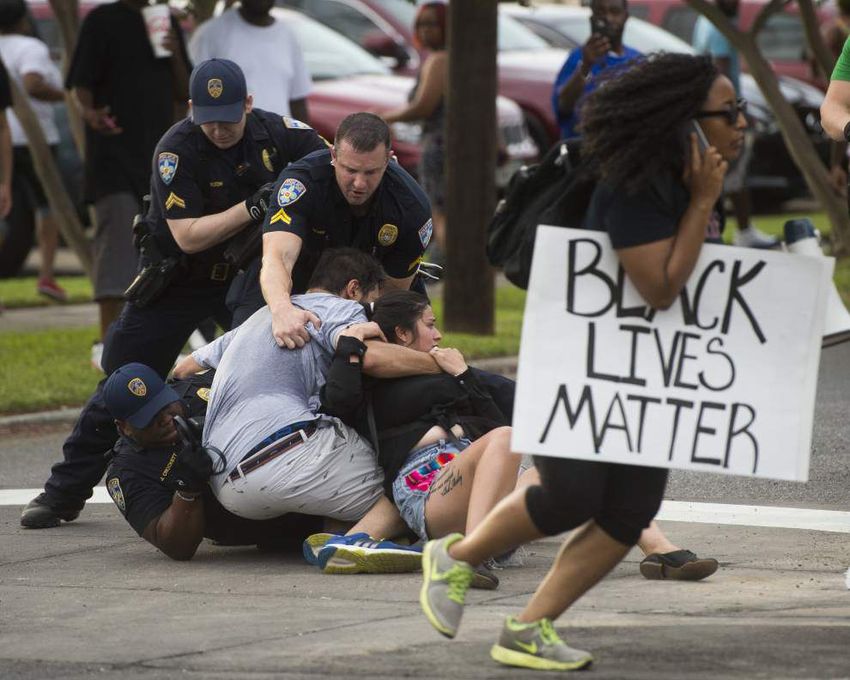
(a) Anti Whitmer adopted from NBC News (b) Black lives matter; adopted from NPR (c) Police-protests interaction;
adopted from The Advocate
Figure 3. Complex emergencies and protesting during COVID-19.
Following George Floyd’s death on June 1 by a white police officer in Minnesota, a new wave
of Black Lives Matter protests began in the U.S. While many worried about catching COVID-19
during these marches [27], they decided to take the risk anyway, Figure 3b. While some of the
protesters tried to follow public health advice (i.e., wearing masks, distancing, using hand sanitizer,
and getting tested for COVID-19), but there is no perfectly safe way to demonstrate in large groups
during a pandemic. Concerns about racism and discrimination have also arisen during the COVID-19
outbreak [28]. COVID-19 policy responses have disproportionately affected people of color and
immigrants-people who are over-represented in lower socioeconomic groups, have limited access to
healthcare, and work in precarious jobs [28]. The question for many was: “Which is worse: protesting
with an increased short-term risk of fatalities due to COVID-19 or staying at home and enduring
sustained systematic racism?”
For many black people and their allies, the risks associated with protesting did not outweigh the
risks of doing nothing, which some equated with “one in every 1000 black men dying at the hands of
police”. According to The Guardian (https://www.theguardian.com/us-news/2020/jun/03/protests-
police-covid-19-coronavirus-spread), it is impossible to know how many people at these marches were
asymptomatic carriers, and that is really scary. Protests, like those mentioned above, are now taking
place nation-wide; Figure 2c maps the locations of protests in the U.S. related to George Floyd’s death
and the larger Black Lives Matter movement.
Finally, the scenario was worsened by police tactics used to subdue protesters, Figure 3c.
According to Wired (https://www.wired.com/story/police-tactics-could-turn-protests-into-covid-
19-hot-spots/), some police tactics could turn protests into COVID-19 hot spots. While large crowds
already carry a risk of transmission, the situation is exacerbated when police deploy tear gas against
protesters, causing them to cough on each other (spraying virus-laden droplets into the environment),
or bus them to jails in groups. Tear gas and pepper spray make it nearly impossible to breathe while
wearing a mask, and mass arrests or detainments are very risky, not just for the people arrested but also
for the jail staff, the court staff, and their families. In any case, the police have to respond to vandalism
and theft (in any form) in which people try to damage public properties, steal from stores, and alter
the peaceful protest. Also, the police should confront anarchist agitators, and criminal opportunism
amid the chaos. It is important to note, therefore, that both protesters and police face significant
risks. According to the Military (https://www.military.com/daily-news/2020/06/10/national-guard-
covid-19-diagnoses-after-protests-are-disturbing-sign-fauci-says.html), an undisclosed number of the
roughly 1200 D.C. Guard members sent to respond to the protests now have COVID-19. Two members
of the Nebraska National Guard also tested positive.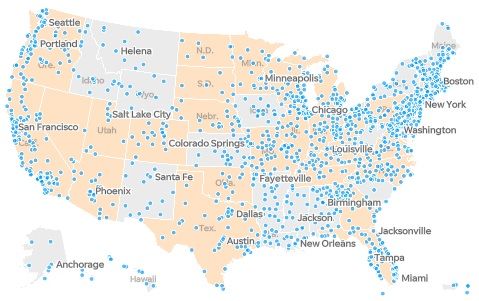
Int. J. Environ. Res. Public Health 2020, 17, 5635                                                        6 of 16

     The readers should note that all the statements (especially the political ones) throughout this
paper do not reflect the personal political view point of the author in any way. All the statements
are carefully selected from peer-reviewed documents and those reported by the news. None of the
statements aim to defend a political party and/or opinion, but to bring to the attention of readers, the
complex situation we are living.

2.4. Healthcare Availability
     Finally, all the above-mentioned hazard sources (and their combined effects) should be studied in
the context of the healthcare system performance, See Section 4. A better healthcare system may reduce
the devastating consequences of large-scale fatalities. According to KHN (https://khn.org/news/as-
coronavirus-spreads-widely-millions-of-older-americans-live-in-counties-with-no-icu-beds/), more
than half of counties in the U.S. have no hospital ICU beds, which poses a particular danger for more
than seven million 60+ years old people facing the spread of COVID-19. They released a map (based
on 2018 and 2019 reported data), showing the counties with and without hospitals, and counties that
do have ICU beds, Figure 2d. As can be seen, there is considerable heterogeneity in the distribution of
the ICU beds (with some having just one bed available for thousands of senior residents). One may
normalize the above-discussed multi-hazard sources with respect to the available healthcare system in
each county. In this way, the impact of the healthcare system (as a secondary hazard source, in case it
is not sufficient) is incorporated in overall risk calculation.

3. Multi-Hazard Risk
     Each of the individual risk factors explained in Section 2 can be catastrophic and devastating if the
individuals and/or society/community are not prepared already [29]. However, the critical question
is “Are we ready for combination of these risks?”. Therefore, we need to talk about the framework of
multi-risk analysis, keeping in mind the fundamental differences between hazard and risk:

                 Risk     ∼ Hazard × Impact on asset × Consequences of impact; Ref.[30]                       (1)
                 Risk     ∼ Hazard × Value at risk × Vulnerability; Ref.[31]                                  (2)

   The concept of multi-risk analysis is well established in natural hazards [30,31]. European
Commission [32] defines the multi-hazard assessment as:
      “to determine the probability of occurrence of different hazards either occurring at the same time or
      shortly following each other, because they are dependent from one another or because they are caused
      by the same triggering event or hazard, or merely threatening the same elements at risk without
      chronological coincidence.”
      Therefore, a multi-hazard assessment can be studied from two perspectives [33]:
•     Independent hazards threatening a given area: the main concern in this effort is harmonization of
      the hazard assessment, meaning that all should have a similar basis [31].
•     Hazard interactions, triggering or cascade effects: in this effort, the occurrence of one event could
      affect the probability of occurrence in others (usually accelerates them). Once this concept is
      propagated into a chain of events, the Bayesian networks framework can be used [34]. For two
      events with occurrence of e1 and e2 , the probability of e1 occurrence, P[e1 ], is:

                                              P[e1 ] = P[e1 |e2 ].P[e2 ] + P[e1 |ē2 ].P[ē2 ]                (3)

      where the bar sign presents the non-occurrence condition. This equation can be generalized for
      N events.
    Liu et al. [34] proposed a simple matrix approach to identifying the interactions between various
hazards. According to Figure 4a (upper part), the interaction of any two hazards Ei and Ej can
Int. J. Environ. Res. Public Health 2020, 17, 5635 7 of 16
be determined by understanding their impacts on one another. For three hazard sources in this
paper, such interactions are assessed in Figure 4a (lower part). While the single-hazard sources take
the diagonal cells, their clockwise influence/interaction fill out the off-diagonal cells. For example,
this matrix shows that occurrence of a natural hazard may spread the pandemic, while an ongoing
pandemic does not change the probability of occurrence of a natural hazard. Each of these major hazard
sources also has various sub-categories. For example, natural disasters include earthquakes, floods,
and hurricanes, while pandemics and epidemics include outbreaks of COVID-19 or an intensified
seasonal influenza.
Influence of
Ei Ei on Ej
High
Risk
Influence of
Ej on Ei
Ej
IMPACT
NH + Pandemic
NH None Spreads NH
None CE Spreads
Low
Shortage of Risk
healthcare
None Pandemic
LIKELIHOOD
(a) Multi-hazard interaction (b) Risk matrix (with hypothetical pandemic and
(top: generic relation; bottom: natural hazards lines)
interactions in this paper)
Figure 4. Matrix presentation of multi-hazard and multi-risk.
A combination of all single-hazard sub-categories and multi-hazard scenarios can be illustrated
on a risk matrix, Figure 4b. A risk matrix is a simple way to present the severity and probability of
various events [35], increasing the visibility of risks to assist with decision making. Assuming the
evaluation metric is the number of fatalities, a path can be developed connecting all the single natural
hazards [36]. The same approach can be followed to add in the effects of a pandemic. Presumably,
both the likelihood of fatalities and their impacts are increased (or may stay constant in some instances)
when a natural hazard occurs during a pandemic. This can be expanded for any combination of two or
three hazard sources (not shown in this figure).
Since this paper focuses on life loss (i.e., human fatalities) as a main metric for risk analysis, it is
important to distinguish the differences between individual and societal risk measures. The individual
risk, R I , is defined as the probability that an average unprotected person, permanently present at a
certain location, is killed due to a hazardous event [1]:
R I = P[ei ].P[ LL|ei ] (4)
where P[ei ] is the probability of hazardous event i, and P[ LL|ei ] is the probability of life loss due to ith
hazardous event.
On the other hand, the societal risk (the expected loss), RS , can be approximated as:
ZZ
RS = R I ( x, y).m( x, y)dxdy (5)
A
where m( x, y) is the population density at location ( x, y), and A is the area.Int. J. Environ. Res. Public Health 2020, 17, 5635 8 of 16
4. Multi-Hazard on Healthcare System
Arguably one of the most important tasks in any community is keeping the healthcare system
as resilient as possible. Resilience refers to the capacity of a system, community, or society to adapt
to potential hazards by resisting or changing in order to reach and maintain an acceptable level
of functionality and structure [37,38]. The concept of resilience was first introduced in the field
of psychology [39] and has been rapidly adopted by environmental [40] and social sciences [41].
Individual researchers have addressed the resilience of communities against natural hazards
(e.g., climate-resilient [42], earthquake-resilient [43], flood-resilient [44], pandemic-resilient [45],
and politically-resilient [46]).
The concept of resilience has risen in popularity during the COVID-19 pandemic, prompting
many researchers from various fields to re-evaluate their protocols, systems, and communities
to understand how they could recover from adverse effects of COVID-19. Among hundreds of
publications, the most notable have focused on medical resilience [47,48], mental resilience [49–51],
tourist resilience [52], food system resilience [53], supply chain resilience [54], educational system
resilience [55], and socioeconomic resilience [56,57]. Furthermore, several researchers have considered
the relationships and interactions between risk, hazard, uncertainty, and resilience in the era of
COVID-19 [58–64].
Figure 5 qualitatively illustrates a few potential scenarios (some with rare probability) that could
happen within a healthcare system. Again, our primary metric is loss of life, which should be controlled
(i.e., reduced) during a pandemic. Similar scenarios can be designed for social and economic aspects,
which are ignored in this paper. One may note that combining these three hazard sources with different
nature is a challenging task because their spatio-temporal domains are different. While most crises or
disasters are constrained within a relatively limited space and time, pandemics persist and reverberate
for months or even years [65]. Establishing our three main hazard sources as a NH, pandemic, and CEs,
the following five scenarios can be discussed, see Figure 5:
1. Pandemic only: This is a single-hazard scenario and assumes no other concurrent hazard threatens
the healthcare system. Based on this figure, the healthcare system is assumed to be initially in
either full functionality (i.e., 100%), in a degraded mode (>100%), or in an upgraded mode
(Int. J. Environ. Res. Public Health 2020, 17, 5635 9 of 16
3. Pandemic + CE: This is also a double-hazard situation in which multiple CEs (e.g., political
conflict, protests) occur during a pandemic. Each of these events, depending on their severity,
may or may not reduce the functionality of the healthcare system, including reductions in financial
resources, global collaborations, and/or data sharing. Compared to the pandemic-only scenario,
the recovery time is higher.
On the other hand, the occurrence of such CEs may impact the original pandemic transmission
curve by intensifying its peak and elongating its endurance time, see Figure 5 (transition from
light gray to darker one).
4. Pandemic + NH + CE: This is a very low-probability, high-consequence situation in which all
three hazard sources occur in a relatively short timeframe, though not necessarily at the same time.
Such a scenario might cause the largest functionality loss and longest recovery time. One may
recognize some states within the U.S. exposed to such multi-risk by overlapping the three maps
in Figure 2.
5. The final scenario is an intense version of any of the previous four scenarios. The healthcare
system in each county has a limited capacity (e.g., ICU rooms, ventilator machines), and may fail if
the imposed demand becomes higher than the “ultimate capacity” of the system [68]. A potential
solution is to flatten the transmission curve by imposing stronger stay-at-home orders.
Outbreak
Functionality NH Incident
Non-degrading system
Natural EC Occurrence
Complex Emergency
Outbreak Hazard Start/End Aged system
Minimum/Peak
100%
Pandemic-induced
Functionality loss Preparedness
3
NH-induced Functionality loss 1 4 1 Pandemic Only
2 Pandemic + NH
2
3 Pandemic + CE
4 Pandemic + NH + CE
CE-induced 5 Total Failure
Functionality loss
Ultimate capacity zone
Altered pandemic with CE 5
Original pandemic
(Different) recovery duration(s)
Failure duration
Time (not to scale)
Figure 5. Response and recovery of healthcare system under multi-hazard scenarios during pandemic;
Five color lines present the response/recovery of the healthcare system; color (red, blue and yellow)
circles show the occurrence of three hazard sources; the black circle shows the start and end point of
the resilience curves; the white circle presents the minimum resiliency (or peak pandemic); the light
and dark gray bell shapes are the pandemic progress over time in the original form and altered by CE,
respectively; and finally, the colored transparent rectangle on the top left side of the figure presents the
individual/cumulative functionality loss.
5. Multi-Hazard Evacuation Models
While each of the above-mentioned single hazards may lead to direct fatalities (the main metric
discussed in this paper), they may also cause some indirect effects. More specifically, the combination
of a pandemic with either NHs or CEs will cause higher infection rates and potentially more fatalities.
While mass gatherings due to CEs can be controlled or prevented to some extent, see Section 2.3,
evacuations forced by NHs are usually inevitable.Int. J. Environ. Res. Public Health 2020, 17, 5635 10 of 16
Evacuating a large number of people during a pandemic is challenging, given the public health
advice to slow the spread of new infections. As mentioned in Section 2.2, during the 2020 Michigan
dam failures, a total of 11,000 people were evacuated. The concept of crowd simulation was already
studied in different forms [69–71]. While there are multiple models to simulate the evacuation of people
during hazards, such as wildfires [72,73], earthquakes [74], and tsunamis [75], very little research can
be found that directly addresses this issue during a pandemic or epidemic [76]. Therefore, developing
such multi-hazard evacuation models is a missing link towards overall community resilience.
Figure 6 qualitatively presents a general framework to simulate the evacuations during a
concurring pandemic and natural hazard. Any new model should include microscopic and macroscopic
crowd models. While the microscopic models take into account spatial-temporal information at the
individual-level, city-level evacuations, sheltering, and effective social distancing are governed by
macroscopic models. A natural hazard usually hits the entire city (like during an earthquake) or just
part of it (like in a flood), forcing people to evacuate with little time. Having an emergency action
plan (EAP) is a key factor in responding quickly to hazards, as these plans guide people to the nearest,
safest shelters. One may isolate only a small portion of the city (as shown in Figure 6; top right) and
develop the model in three parts:
City Level
Regional Level
Microscopic
Microscopic analysis Macroscopic analysis analysis
Residential
Commercial
Evacuation Path Shelter
Service
Healthy Touching
evacuation [common objects]
Ventilation
(2)
(3)
Ri
Agenti
Vi
Direction
Natural (1)
Hazard
(4) Blocking
Crossing
Outbreak Free Mask Contagious Contagious with Not
with Symptom no Symptom infected Recovered
t0 t1 t2 t3
Figure 6. Evacuation and sheltering in pandemic era after a natural hazard; in city level figure (top left),
the circles and squares present different types of buildings; the timeline axis presents the pandemic era
before natural hazard occurrence, t0 , during staying inside a confined place, t1 , during evacuation, t2 ,
and during sheltering, t3 .
• Confined space crowd models investigate the occupants’ (or agents’) exposure inside a building
during a pandemic and right before or after a natural hazard. In this model, various factors,
such as the distance between individuals, the type of transmission contact (e.g., airborne, droplets),
and time of exposure, should be considered. The uncertainty associated with the spread of disease
can be addressed as one of four potential cases shown in Figure 6:Int. J. Environ. Res. Public Health 2020, 17, 5635 11 of 16
1. Direct physical contact (e.g., touching).
2. Within the social distance: the exposure might happen if the agent j falls within the social
distance (about 2.0 m) of agenti .
3. Being face-to-face within the social distance: the transmission of COVID-19 is higher when
the individuals are facing each other or their faces are at a certain angle of each other. This is
an important factor especially in commercial or service centers.
4. Being in the same confined area.
One may add the following further details to each of four above-mentioned cases:
– All cases are time-dependent and should be analyzed in the transient mode.
– All the interactions should be modeled between any two combination of agenti and agent j .
– Various constraints should be applied to the simulations including but not limited to:
using face covering, contagious with or without symptoms, etc.
• Evacuation models are divided into two parts: evacuating a building and heading towards a
shelter. For the latter, factors such as duration, length of travel, difficulty of paths, speed of
each individual, potential touching of common surfaces/objects, blocked paths by a group of
individuals, and violations of social distancing should be considered.
• Lastly, sheltering is another major concern during a pandemic, and the capacity of shelters should
be recalculated to account for safe distancing between individuals, as well as the length of time
evacuees will remain there. Among other factors, the functionality of ventilation systems should
be managed to avoid potential damage by a natural hazard.
During all three models, a portion of evacuees might become injured, which should be accounted
for in evacuation models and added to the resiliency of the healthcare system, Figure 5.
6. Conclusions
This paper highlights the importance and impacts of natural hazards and various complex
emergencies in a pandemic era and explains the concept of multi-hazard risk in three hazard scenarios.
Two major ideas are qualitatively proposed for future detailed research: (1) the need for resilience
models that explore the healthcare system under multi-hazard risk, potential forms of functionality
loss, and the recovery duration; and (2) the need for pandemic-specific evacuation and sheltering
models that also cover the risks posed by NHs.
While the skeleton of the paper was formed based on the data, hazards, and events that have
been reported in the U.S., the idea can be expanded to any other country without loss of generality.
While all countries in the world are fighting COVID-19 outbreak, natural hazards (from different
types) are also inevitable. For example, since January 2020, several major natural disasters have been
reported worldwide, including: (1) 5.3 magnitude earthquake on 22 March in Zagreb, Croatia [77] (one
fatality, 27 injured); (2) 5.1 magnitude earthquake on 7 May in Tehran, Iran (two fatalities, 38 injured);
(3) earth-fill dam break on 1 May in Uzbekistan (four fatalities, 50 injured, and 70,000 evacuees) [78];
(4) Tropical Storm Amanda, formed on 31 May, along the coast of Guatemala (at least 17 fatalities); (5)
Cyclone Harold [79] in the Solomon Islands, Vanuatu, Fiji, and Tonga between 1 and 6 April, which
destroyed many homes; (6) wildfire outbreaks in the west, southwest, and south of Iran that burned
more than 500 hectares of forest between 27 May and 3 June; (7) multiple floods impacted large tracts
of Southern China in June and July due to heavy rains, which affected more than 37 million people,
and left about 140 death/missing.
Also, add the ongoing (or new) international complex emergencies to this multi-hazard scenario.
The examples of ongoing challenges are: Hong Kong protests, the war/conflicts in the Middle East
(such as Syria, Yemen, Afghanistan), etc.
Some other types of complex emergencies are predictable; however, blocking them temporarily
may even cause extra future consequences. For example, the authorities in Iran have to face theInt. J. Environ. Res. Public Health 2020, 17, 5635 12 of 16
dilemma of canceling (due to COVID-19) nation-wide university entrance exam early August with
about 1.5 million participants (which practically cripple the entire educational system for the upcoming
academic year), or risking their lives by a half-a-day exam in the indoor classrooms/environments.
One major conclusion out of this paper is that a multi-hazard situation combining any three
hazard sources of pandemic, natural hazard, and complex emergency might have a cascading effect.
Since various dimensions of this problem is still unknown (i.e., we do not have a quantitative metric
to evaluate the risk, and we clearly are not prepared to face it), the authors implore governments
to allocate additional financial resources to multi-hazard risk research, paving the way for a safer,
less uncertain future. While the COVID-19 pandemic and all its consequences were unfortunate for the
society, some researchers note that it might yield positive impacts for future resilience design, plans,
and politics within built environments [65,80]. Last but not least, the author believes that anyone
in any position should contribute (to the extent possible) to improve the knowledge related to the
COVID-19 outbreak, and as Haas [81] truly said: “Risk analysts and risk analysis researchers should not be
shy about contributing our skills to important policy developments during this crisis.”
This paper proposed a multi-risk assessment framework in the following general form, g, in which
the risk increases in the presence of a pandemic, natural hazard, complex emergencies, and in the lack
of a sufficient healthcare system:
Pandemic, Natural Hazard, Complex Emergency
Multi Risk ∼ g (6)
Healthcare System
While this paper proposed a general framework, we did not present a quantitative example
(case study). At the time of publication of this paper, the world was in the middle of a COVID-19
pandemic, with no definite database on full interaction of different hazard sources. As a future
work, the idea presented in this paper can be applied to the database collected at the national
or international levels.
Funding: This research received no external funding.
Acknowledgments: The author would like to pay his tribute and appreciation to all front-line workers who are
fighting the COVID-19 pandemic.
Conflicts of Interest: The author declares no conflict of interest.
References
1. Jonkman, S.; Van Gelder, P.; Vrijling, J. An overview of quantitative risk measures for loss of life and
economic damage. J. Hazard. Mater. 2003, 99, 1–30. [CrossRef]
2. WHO. Coronavirus Disease 2019 (COVID-19): Situation Report 80; WHO: Geneva, Switzerland, 2020.
3. Wu, Y.C.; Chen, C.S.; Chan, Y.J. The outbreak of COVID-19: An overview. J. Chin. Med Assoc. 2020, 83, 217.
[CrossRef] [PubMed]
4. Hellewell, J.; Abbott, S.; Gimma, A.; Bosse, N.I.; Jarvis, C.I.; Russell, T.W.; Munday, J.D.; Kucharski, A.J.;
Edmunds, W.J.; Sun, F.; et al. Feasibility of controlling COVID-19 outbreaks by isolation of cases and contacts.
In The Lancet Global Health; Elsevier: Amsterdam, The Netherlands, 2020.
5. Johns Hopkins University of Medicine. Corovavirus Resource Center; Johns Hopkins University of Medicine:
Baltimore, MD, USA, 2020.
6. Wilson, N.; Kvalsvig, A.; Barnard, L.T.; Baker, M.G. Case-fatality risk estimates for COVID-19 calculated by
using a lag time for fatality. Emerg. Infect. Dis. 2020, 26, 1339–1441. [CrossRef] [PubMed]
7. Boulos, M.N.K.; Geraghty, E.M. Geographical tracking and mapping of coronavirus disease
COVID-19/severe acute respiratory syndrome coronavirus 2 (SARS-CoV-2) epidemic and associated events
around the world: How 21st century GIS technologies are supporting the global fight against outbreaks and
epidemics. Int. J. Health Geogr. 2020, 19, 8.
8. Petropoulos, F.; Makridakis, S. Forecasting the novel coronavirus COVID-19. PLoS ONE 2020, 15, e0231236.
[CrossRef]Int. J. Environ. Res. Public Health 2020, 17, 5635 13 of 16
9. Fanelli, D.; Piazza, F. Analysis and forecast of COVID-19 spreading in China, Italy and France. Chaos Solitons
Fractals 2020, 134, 109761. [CrossRef]
10. Anastassopoulou, C.; Russo, L.; Tsakris, A.; Siettos, C. Data-based analysis, modelling and forecasting of the
COVID-19 outbreak. PLoS ONE 2020, 15, e0230405. [CrossRef]
11. Grasselli, G.; Pesenti, A.; Cecconi, M. Critical care utilization for the COVID-19 outbreak in Lombardy, Italy:
Early experience and forecast during an emergency response. JAMA 2020, 323, 1545–1546. [CrossRef]
12. Yamana, T.; Pei, S.; Shaman, J. Projection of COVID-19 Cases and Deaths in the US as Individual States
Re-open May 4, 2020. medRxiv 2020. [CrossRef]
13. Der-Kiureghian, A.; Ditlevsen, O. Aleatory or epistemic? Does it matter? Struct. Saf. 2009, 31, 105–112.
[CrossRef]
14. Nelson, S. Natural Hazards and Natural Disasters; Natural Disaster & Assessing Hazards and Risk, Tulane
University: New Orleans, LA, USA, 2018; Last Viewed May 2020.
15. Hariri-Ardebili, M. Risk, Reliability, Resilience (R3) and beyond in dam engineering: A state-of-the-art
review. Int. J. Disaster Risk Reduct. 2018, 31, 806–831. [CrossRef]
16. McCloskey, B.; Zumla, A.; Ippolito, G.; Blumberg, L.; Arbon, P.; Cicero, A.; Endericks, T.; Lim, P.L.;
Borodina, M. Mass gathering events and reducing further global spread of COVID-19: A political and public
health dilemma. Lancet 2020, 395, 1096–1099. [CrossRef]
17. Memish, Z.A.; Steffen, R.; White, P.; Dar, O.; Azhar, E.I.; Sharma, A.; Zumla, A. Mass gatherings medicine:
Public health issues arising from mass gathering religious and sporting events. Lancet 2019, 393, 2073–2084.
[CrossRef]
18. Barrios, J.M.; Hochberg, Y. Risk Perception Through the Lens of Politics in the Time of the Covid-19 Pandemic;
Technical Report; National Bureau of Economic Research: Cambridge, MA, USA, 2020.
19. Painter, M.; Qiu, T. Political Beliefs Affect Compliance with COVID-19 Social Distancing Orders. SSRN
3569098. Available online: https://ssrn.com/abstract=3569098 (accessed on 6 July 2020).
20. Grossman, G.; Kim, S.; Rexer, J.; Thirumurthy, H. Political Partisanship Influences Behavioral Responses
to Governors’ Recommendations for COVID-19 Prevention in the United States. SSRN 3578695. Available
online: https://ssrn.com/abstract=3578695 (accessed on 6 July 2020).
21. Adolph, C.; Amano, K.; Bang-Jensen, B.; Fullman, N.; Wilkerson, J. Pandemic Politics: Timing State-Level Social
Distancing Responses to COVID-19; American Political Science Association: Washington, DC, USA, 2020.
22. Kavanagh, N.M.; Goel, R.R.; Venkataramani, A.S. Association of County-Level Socioeconomic and Political
Characteristics with Engagement in Social Distancing for COVID-19. medRxiv 2020, 4, 2020.
23. Dincer, O.C.; Gillanders, R. Shelter in Place? Depends on the Place: Corruption and Social Distancing in American
States; SSRN: Rochester, NY, USA, 2020.
24. Seddighi, H. Trust in Humanitarian Aid From the Earthquake in 2017 to COVID-19 in Iran: A Policy
Analysis. In Disaster Medicine and Public Health Preparedness; Cambridge University Press: Cambridge, UK,
2020; pp. 1–4.
25. Ferretti, L.; Wymant, C.; Kendall, M.; Zhao, L.; Nurtay, A.; Abeler-Dörner, L.; Parker, M.; Bonsall, D.;
Fraser, C. Quantifying SARS-CoV-2 transmission suggests epidemic control with digital contact tracing.
Science 2020, 368, eabb6936. [CrossRef] [PubMed]
26. VanEgeren, J. 72 COVID Positive After Attending Large Event; WMTV: Madison, WI, USA, 2020.
27. Resnick, B. What Public Health Experts Want Critics to Know About Why They Support the Protests. 2020.
Available online: https://www.vox.com/science-and-health/2020/6/6/21279592/protest-pandemic-covid-
19-risk-second-wave-systemic-racism (accessed on 6 June 2020).
28. Devakumar, D.; Shannon, G.; Bhopal, S.S.; Abubakar, I. Racism and discrimination in COVID-19 responses.
Lancet 2020, 395, 1194. [CrossRef]
29. Bedford, J.; Farrar, J.; Ihekweazu, C.; Kang, G.; Koopmans, M.; Nkengasong, J. A new twenty-first century
science for effective epidemic response. Nature 2019, 575, 130–136. [CrossRef]
30. Schmidt, J.; Matcham, I.; Reese, S.; King, A.; Bell, R.; Henderson, R.; Smart, G.; Cousins, J.; Smith, W.;
Heron, D. Quantitative multi-risk analysis for natural hazards: A framework for multi-risk modelling.
Nat. Hazards 2011, 58, 1169–1192. [CrossRef]
31. Marzocchi, W.; Garcia-Aristizabal, A.; Gasparini, P.; Mastellone, M.L.; Di Ruocco, A. Basic principles of
multi-risk assessment: A case study in Italy. Nat. Hazards 2012, 62, 551–573. [CrossRef]Int. J. Environ. Res. Public Health 2020, 17, 5635 14 of 16
32. European Commission. Risk Assessment and Mapping Guidelines for Disaster Management; Technical Report,
Commission Staff Working Paper, SEC (2010) 1626 Final, Brussels; European Commission: Brussels,
Belgium, 2010.
33. Liu, Z.; Nadim, F.; Garcia-Aristizabal, A.; Mignan, A.; Fleming, K.; Luna, B.Q. A three-level framework for
multi-risk assessment. Georisk Assess. Manag. Risk Eng. Syst. Geohazards 2015, 9, 59–74. [CrossRef]
34. Liu, Z.; Nadim, F.; Vangelsten, B.V.; Eidsvig, U.; Kalsnes, B. Quantitative multi-risk modelling
and management using Bayesian networks. In Landslide Science for a Safer Geoenvironment; Springer:
Berlin/Heidelberg, Germany, 2014; pp. 773–779.
35. Ni, H.; Chen, A.; Chen, N. Some extensions on risk matrix approach. Saf. Sci. 2010, 48, 1269–1278. [CrossRef]
36. Komendantova, N.; Mrzyglocki, R.; Mignan, A.; Khazai, B.; Wenzel, F.; Patt, A.; Fleming, K. Multi-hazard and
multi-risk decision-support tools as a part of participatory risk governance: Feedback from civil protection
stakeholders. Int. J. Disaster Risk Reduct. 2014, 8, 50–67. [CrossRef]
37. Waller, M.A. Resilience in ecosystemic context: Evolution of the concept. Am. J. Orthopsychiatry 2001,
71, 290–297. [CrossRef] [PubMed]
38. Bruneau, M.; Chang, S.E.; Eguchi, R.T.; Lee, G.C.; O’Rourke, T.D.; Reinhorn, A.M.; Shinozuka, M.; Tierney, K.;
Wallace, W.A.; Von Winterfeldt, D. A framework to quantitatively assess and enhance the seismic resilience
of communities. Earthq. Spectra 2003, 19, 733–752. [CrossRef]
39. Johnson, J.L.; Wiechelt, S.A. Introduction to the special issue on resilience. Subst. Use Misuse 2004, 39, 657–670.
[CrossRef]
40. Van der Leeuw, S.E.; Aschan-Leygonie, C. A long-term perspective on resilience in socio-natural systems.
In Micro-Meso-Macro: Addressing Complex Systems Couplings; World Scientific: London, UK, 2005; pp. 227–264.
41. Magis, K. Community resilience: An indicator of social sustainability. Soc. Nat. Resour. 2010, 23, 401–416.
[CrossRef]
42. Vallejo, L.; Mullan, M. Climate-Resilient Infrastructure; OECD: Paris, France, 2017.
43. Nikolaou, S.; Kourkoulis, R.; Diaz-Fanas, G. Earthquake-Resilient Infrastructure: The Missing Link.
In Proceedings of the Geotechnical Earthquake Engineering and Soil Dynamics V, Austin, TX, USA, 10–13
June 2018; pp. 79–90. [CrossRef]
44. Lhomme, S.; Serre, D.; Diab, Y.; Laganier, R. Analyzing resilience of urban networks: A preliminary step
towards more flood resilient cities. Nat. Hazards Earth Syst. Sci. 2013, 13, 221. [CrossRef]
45. Litman, T. Pandemic-Resilient Community Planning: Practical Ways to Help Communities Prepare for, Respond
to, and Recover from Pandemics and Other Economic, Social and Environmental Shocks; Victoria Transport Policy
Institute: Victoria, BC, Canada, 2020.
46. Takian, A.; Raoofi, A.; Kazempour-Ardebili, S. COVID-19 battle during the toughest sanctions against Iran.
Lancet 2020, 395, 1035. [CrossRef]
47. Legido-Quigley, H.; Asgari, N.; Teo, Y.Y.; Leung, G.M.; Oshitani, H.; Fukuda, K.; Cook, A.R.; Hsu, L.Y.;
Shibuya, K.; Heymann, D. Are high-performing health systems resilient against the COVID-19 epidemic?
Lancet 2020, 395, 848–850. [CrossRef]
48. Legido-Quigley, H.; Mateos-García, J.T.; Campos, V.R.; Gea-Sánchez, M.; Muntaner, C.; McKee, M. The
resilience of the Spanish health system against the COVID-19 pandemic. Lancet Public Health 2020,
5, e251–e252. [CrossRef]
49. Santarone, K.; McKenney, M.; Elkbuli, A. Preserving mental health and resilience in frontline healthcare
workers during COVID-19. Am. J. Emerg. Med. 2020, 38, 1530–1531. [CrossRef] [PubMed]
50. Plomecka, M.B.; Gobbi, S.; Neckels, R.; Radziński, P.; Skórko, B.; Lazerri, S.; Almazidou, K.; Dedić, A.;
Bakalović, A.; Hrustić, L.; et al. Mental Health Impact of COVID-19: A global study of risk and resilience
factors. medRxiv 2020. [CrossRef]
51. Rahman, M.; Chowdhury, M.; Garcia-Ballestas, E.; Florez, W.; Agrawal, A.; Moscote-Salazar, L.R. COVID 19
and Resilience: Neurosurgical perspectives. World Neurosurg. 2020, 426. [CrossRef]
52. D’Orazio, M.; Bernardini, G.; Quagliarini, E. Sustainable and resilient strategies for touristic cities against
COVID-19: An agent-based approach. arXiv 2020, arXiv:2005.12547.
53. Worstell, J. Ecological resilience of food systems in response to the COVID-19 crisis. J. Agric. Food Syst.
Community Dev. 2020, 9, 1–8. [CrossRef]Int. J. Environ. Res. Public Health 2020, 17, 5635 15 of 16
54. Golan, M.S.; Jernegan, L.H.; Linkov, I. Trends and applications of resilience analytics in supply chain
modeling: Systematic literature review in the context of the COVID-19 pandemic. In Environment Systems &
Decisions; Springer: Berlin/Heidelberg, Germany, 2020; pp. 222–243.
55. Hart, C.; Nash, F. Teacher Resilience during COVID: Burnout and Trauma; RTI Press: Research Triangle Park,
NC, USA, 2020.
56. Baldwin, R.; Evenett, S. COVID-19 and Trade Policy: Why Turning Inward Won’t Work; VoxEU: London,
UK, 2020.
57. Amekudzi-Kennedy, A.; Labi, S.; Woodall, B.; Marsden, G.; Grubert, E. Role of Socially-Equitable Economic
Development in Creating Resilient and Sustainable Systems: COVID-19-Related Reflections. Engineering
2020. [CrossRef]
58. Bostrom, A.; Bohm, G.; OConnor, R.E.; Hanss, D.; Bodi-Fernandez, O.; Halder, P. Comparative risk science
for the coronavirus pandemic. J. Risk Res. 2020, 1–10. [CrossRef]
59. Bryce, C.; Ring, P.; Ashby, S.; Wardman, J. Resilience in the face of uncertainty: Early lessons from the
COVID-19 pandemic. J. Risk Res. 2020, 1–8. [CrossRef]
60. Barton, M.A.; Christianson, M.; Myers, C.G.; Sutcliffe, K. Resilience in action: Leading for resilience in
response to COVID-19. BMJ Lead. 2020. [CrossRef]
61. Sadati, A.K.; MH, B.L.; Bagheri Lankarani, K. Risk Society, Global Vulnerability and Fragile Resilience;
Sociological View on the Coronavirus Outbreak. Shiraz E-Med. J. 2020, 21, e102263. [CrossRef]
62. Collins, A.; Florin, M.V.; Renn, O. COVID-19 risk governance: Drivers, responses and lessons to be learned.
J. Risk Res. 2020, 1–10. [CrossRef]
63. Aven, T.; Bouder, F. The COVID-19 pandemic: How can risk science help? J. Risk Res. 2020, 1–6. [CrossRef]
64. Dryhurst, S.; Schneider, C.R.; Kerr, J.; Freeman, A.L.; Recchia, G.; Van Der Bles, A.M.; Spiegelhalter, D.;
van der Linden, S. Risk perceptions of COVID-19 around the world. J. Risk Res. 2020, 1–13. [CrossRef]
65. Trump, B.D.; Linkov, I. Risk and resilience in the time of the COVID-19 crisis. In Environment Systems and
Decisions; Springer: Berlin/Heidelberg, Germany, 2020.
66. Fakhruddin, B.; Blanchard, K.; Ragupathy, D. Are we there yet? The transition from response to recovery
for the COVID-19 pandemic. In Progress in Disaster Science; Elsevier: Amsterdam, The Netherlands,
2020; p. 100102.
67. Menoni, S.; Schwarze, R. Recovery during a crisis: Facing the challenges of risk assessment and resilience
management of COVID-19. Environ. Syst. Decis. 2020, 40, 1–10. [CrossRef]
68. Jovanovic, A.; Klimek, P.; Renn, O.; Schneider, R.; Chakravarty, S.; Brown, J.; DiGennaro, M.; Liu, Y.; Pfau,
V.; Jelic, M.; et al. Assessing resilience of healthcare infrastructure exposed to COVID-19: Emerging risks,
resilience indicators, interdependencies and international standards. Environ. Syst. Decis. 2020. [CrossRef]
69. Pelechano, N.; Malkawi, A. Evacuation simulation models: Challenges in modeling high rise building
evacuation with cellular automata approaches. Autom. Constr. 2008, 17, 377–385. [CrossRef]
70. Kuligowski, E.D.; Peacock, R.D.; Hoskins, B.L. A Review of Building Evacuation Models; US Department of
Commerce, National Institute of Standards and Technology: Washington, DC, USA, 2005.
71. Pelechano, N.; Badler, N.I. Modeling crowd and trained leader behavior during building evacuation.
IEEE Comput. Graph. Appl. 2006, 26, 80–86. [CrossRef]
72. Shen, T.S. ESM: A building evacuation simulation model. Build. Environ. 2005, 40, 671–680. [CrossRef]
73. Shi, J.; Ren, A.; Chen, C. Agent-based evacuation model of large public buildings under fire conditions.
Autom. Constr. 2009, 18, 338–347. [CrossRef]
74. Bernardini, G.; D’Orazio, M.; Quagliarini, E.; Spalazzi, L. An agent-based model for earthquake pedestrians’
evacuation simulation in urban scenarios. Transp. Res. Procedia 2014, 2, 255–263. [CrossRef]
75. Goto, Y.; Affan, M.; Nurdin, Y.; Yuliana, D.K.; Ardiansyah. Tsunami evacuation simulation for disaster
education and city planning. J. Disaster Res. 2012, 7, 92–101. [CrossRef]
76. King, M.A.; Niven, A.S.; Beninati, W.; Fang, R.; Einav, S.; Rubinson, L.; Kissoon, N.; Devereaux, A.V.;
Christian, M.D.; Grissom, C.K. Evacuation of the ICU: Care of the critically ill and injured during pandemics
and disasters: CHEST consensus statement. Chest 2014, 146, e44S–e60S. [CrossRef] [PubMed]
77. Čivljak, R.; Markotić, A.; Capak, K. Earthquake in the time of COVID-19: The story from Croatia (CroVID-20).
J. Glob. Health 2020, 10, e010349. [CrossRef] [PubMed]
78. Putz, C. 70,000 Evacuated After Breach in Uzbek Dam, Investigation Into Failure Launched; The Diplomat: Tokyo,
Japan, 2020.Int. J. Environ. Res. Public Health 2020, 17, 5635 16 of 16
79. World Meteorological Organization. Tropical Cyclone Harold Challenges Disaster and Public Health Management;
World Meteorological Organization: Geneva, Switzerland, 2020.
80. Keenan, J.M. COVID, resilience, and the built environment. In Environment Systems and Decisions; Springer:
Berlin/Heidelberg, Germany, 2020; pp. 1–6.
81. Haas, C. Coronavirus and risk analysis. Risk Anal. 2020, 40, 660. [CrossRef] [PubMed]
c 2020 by the authors. Licensee MDPI, Basel, Switzerland. This article is an open access
article distributed under the terms and conditions of the Creative Commons Attribution
(CC BY) license (http://creativecommons.org/licenses/by/4.0/).You can also read