VIETNAM CLIMATE RISK COUNTRY PROFILE - World Bank Group
←
→
Page content transcription
If your browser does not render page correctly, please read the page content below
CLIMATE RISK COUNTRY PROFILE

         VIETNAM
ACKNOWLEDGEMENTS
The Vietnam Climate Risk Profile is part of a series of Climate Risk Country Profiles developed jointly by the World Bank
Group (WBG) and the Asian Development Bank (ADB). The profiles synthesize most relevant data and information for climate
and disaster risk reduction and adaptation to climate change; and is designed as a quick reference source for development
practitioners to better integrate climate resilience in development planning and development operations. This effort was led by
Xianfu Lu (ADB) and Ana E. Bucher (WBG).

The profile was written by Alex Chapman (NEF Consulting), William Davies (NEF Consulting), and Yunziyi Lang (WBG). The
design and typesetting were produced by Chris Phillips (Circle Graphics). Sources on climate and climate-related information
are linked through the WBG’s Climate Change Knowledge Portal (CCKP), which is periodically updated to reflect the most
recent publicly available climate analysis. The team is grateful for all comments and suggestions received from the sector,
regional, and country specialists on climate change.

DISCLAIMER
This work is a product of the staff of the World Bank Group (WBG) and the Asian Development Bank (ADB) with external
contributions. The findings, interpretations, and conclusions expressed in this work do not necessarily reflect the views of either
The WBG or the ADB, their Board of Executive Directors, or the governments they represent.

The WBG and ADB do not guarantee the accuracy of the data included in this work. All maps were produced using the
shapefiles approved by the Cartography Unit of the WBG. The boundaries, colors, denominations and any other information
shown on these maps in this work do not imply any judgment on the part of the WBG and the ADB concerning the legal status
of any territory, or any endorsement or acceptance of such boundaries.

© 2018 The World Bank Group
1818 H Street NW
Washington DC, USA
Telephone: 202-473-1000
Internet: www.worldbank.org

© 2018 Asian Development Bank
6 ADB Avenue, Mandaluyong City, 1550 Metro
Manila, Philippines
Tel +63 2 632 4444;
Fax +63 2 636 2444
Internet: www.adb.org

All rights reserved.
CONTENTS

KEY MESSAGES .  .  .  .  .  .  .  .  .  .  .  .  .  .  .  .  .  .  .  .  .  .  .  .  .  .  .  .  .  .  .  .  .  . 2

COUNTRY OVERVIEW .  .  .  .  .  .  .  .  .  .  .  .  .  .  .  .  .  .  .  .  .  .  .  .  .  .  .  .  .  .  . 2

CLIMATOLOGY  .  .  .  .  .  .  .  .  .  .  .  .  .  .  .  .  .  .  .  .  .  .  .  .  .  .  .  .  .  .  .  .  .  .                               4
  Climate Baseline .  .  .  .  .  .  .  .  .  .  .  .  .  .  .  .  .  .  .  .  .  .  .  .  .  .  .  .  .  .  .  .  .  .  .  .  .  .  .  .       4
     Key Trends .  .  .  .  .  .  .  .  .  .  .  .  .  .  .  .  .  .  .  .  .  .  .  .  .  .  .  .  .  .  .  .  .  .  .  .  .  .  .  .  .       5
  Climate Future .  .  .  .  .  .  .  .  .  .  .  .  .  .  .  .  .  .  .  .  .  .  .  .  .  .  .  .  .  .  .  .  .  .  .  .  .  .  .  .  .      6
     Model ensemble .  .  .  .  .  .  .  .  .  .  .  .  .  .  .  .  .  .  .  .  .  .  .  .  .  .  .  .  .  .  .  .  .  .  .  .  .  .  .         6
     Temperature Changes .  .  .  .  .  .  .  .  .  .  .  .  .  .  .  .  .  .  .  .  .  .  .  .  .  .  .  .  .  .  .  .  .  .  .  .             8
     Precipitation changes  .  .  .  .  .  .  .  .  .  .  .  .  .  .  .  .  .  .  .  .  .  .  .  .  .  .  .  .  .  .  .  .  .  .  .  .          8

CLIMATE CHANGE AND NATURAL HAZARD RISK .  .  .  .  .  .  .  .  .  .  .  .  .  .  .  .  .  . 10
     Heat Waves .  .  .  .  .  .  .  .  .  .  .  .  .  .  .  .  .  .  .  .  .  .  .  .  .  .  .  .  .  .  .  .  .  .  .  .  .  .  .  .  .       11
     Drought  .  .  .  .  .  .  .  .  .  .  .  .  .  .  .  .  .  .  .  .  .  .  .  .  .  .  .  .  .  .  .  .  .  .  .  .  .  .  .  .  .  .      11
     Flood .  .  .  .  .  .  .  .  .  .  .  .  .  .  .  .  .  .  .  .  .  .  .  .  .  .  .  .  .  .  .  .  .  .  .  .  .  .  .  .  .  .  .  .   12
     Tropical Cyclones and Storm Surge .  .  .  .  .  .  .  .  .  .  .  .  .  .  .  .  .  .  .  .  .  .  .  .  .  .  .  .  .  .                 14

CLIMATE CHANGE IMPACTS .  .  .  .  .  .  .  .  .  .  .  .  .  .  .  .  .  .  .  .  .  .  .  .  .  .  .  . 16
  Climate Change Impacts on Natural Resources  .  .  .  .  .  .  .  .  .  .  .  .  .  .  .  .  .  .  .  .  .  .  .  .  .  . 16
     The Coastal Zone  .  .  .  .  .  .  .  .  .  .  .  .  .  .  .  .  .  .  .  .  .  .  .  .  .  .  .  .  .  .  .  .  .  .  .  .  .  . 16
  Climate Change Impacts on Economic Sectors  .  .  .  .  .  .  .  .  .  .  .  .  .  .  .  .  .  .  .  .  .  .  .  .  .  . 18
     Urban and Energy  .  .  .  .  .  .  .  .  .  .  .  .  .  .  .  .  .  .  .  .  .  .  .  .  .  .  .  .  .  .  .  .  .  .  .  .  . 20
  Climate Change Impacts on Communities .  .  .  .  .  .  .  .  .  .  .  .  .  .  .  .  .  .  .  .  .  .  .  .  .  .  .  . 21
     Human Health .  .  .  .  .  .  .  .  .  .  .  .  .  .  .  .  .  .  .  .  .  .  .  .  .  .  .  .  .  .  .  .  .  .  .  .  .  .  . 22
     Poverty and inequality .  .  .  .  .  .  .  .  .  .  .  .  .  .  .  .  .  .  .  .  .  .  .  .  .  .  .  .  .  .  .  .  .  .  . 24

POLICIES AND PROGRAMMES .  .  .  .  .  .  .  .  .  .  .  .  .  .  .  .  .  .  .  .  .  .  .  .  .  .  . 25
  National Adaptation Policies and Plans .  .  .  .  .  .  .  .  .  .  .  .  .  .  .  .  .  .  .  .  .  .  .  .  .  .  .  .  .                  25
  Climate-Related Priorities of the WB and ADB .  .  .  .  .  .  .  .  .  .  .  .  .  .  .  .  .  .  .  .  .  .  .  .  .  .                     25
     Asian Development Bank - Country Partnership Strategy  .  .  .  .  .  .  .  .  .  .  .  .  .  .  .  .  .  .  .                             25
     World Bank – Country Partnership Framework .  .  .  .  .  .  .  .  .  .  .  .  .  .  .  .  .  .  .  .  .  .  .  .                          26

CLIMATE RISK COUNTRY PROFILE — VIETNAM                                                                                                           1
KEY MESSAGES

•     Projected temperature increases in Vietnam are similar to the global average, ranging between 1.0 and 3.4°C
      by 2080–2099 when compared with the 1986–2005 baseline. The range in possible temperature rises
      highlights the significant differences between 21st century emissions pathways.
•     Rises in annual maximum and minimum temperatures are expected to be stronger than the rise in average
      temperature, likely amplifying the impacts on human health, livelihoods, and ecosystems.
•     There is considerable uncertainty around future precipitation trends and the intensity of extreme events, in
      particular due to the current generation of climate models’ poor performance simulating El Niño Southern
      Oscillation (ENSO).
•     Vietnam’s low-lying coastal and river delta regions have very high vulnerability to rising sea-levels. Depending
      on the emissions pathway 6–12 million people will potentially be affected by coastal flooding by 2070–2100
      without effective adaptation action.
•     Climate change is likely to increase the population affected by fluvial flooding, projected to be in the range of
      3–9 million people by 2035–2044 depending on the emissions pathway.
•     Losses of agricultural productivity are projected for key food and cash crops, multiple drivers have been
      proposed, including saline intrusion and shifts in the viable geographical range of plant species.
•     As temperatures rise the increase in heat stress on the Vietnamese population will lead to negative health
      outcomes, particularly for poorer communities and outdoor laborers.

COUNTRY OVERVIEW

V
         ietnam is a Southeast Asian nation with an extensive coastline and diverse but generally warm climate
         including temperate and tropical regions. In 2016 Vietnam’s population was estimated at 93 million,
         approximately one third of whom live in the metropolitan areas of its two mega-cities, Hanoi and Ho Chi
Minh City. The relative contribution of agriculture, forestry, and fishing to the country’s economy has declined
in recent years due to the rapid growth of the industry and service sectors; as of 2017 the agricultural sector
contributed 15.3% of gross domestic product, this is somewhat mismatched against an employment contribution of
around 40.3% of the country’s labor force (see key country indicators in Table 1). Rice production has a particularly
vital role for the country in terms of food security, rural employment and foreign exchange, employing two-thirds
of the rural labor force and positioning Vietnam as consistently one of the world’s largest rice exporters. Vietnam’s
long coastline, geographic location, and diverse topography and climates contribute to its being one of the most
hazard-prone countries of the Asia-Pacific region. Given that a high proportion of the country’s population and
economic assets (including irrigated agriculture) are located in coastal lowlands and deltas and rural areas face
issues of poverty and deprivation, Vietnam has been ranked among the five countries likely to be most affected by
climate change. It has been estimated that climate change will reduce national income by up to 3.5% by 2050.1

1
    Arndt, C., Tarp, F., & Thurlow, J. (2015). The economic costs of climate change: A multi-sector impact assessment for Vietnam.
    Sustainability: 7: 4131–4145.

CLIMATE RISK COUNTRY PROFILE — VIETNAM                                                                                               2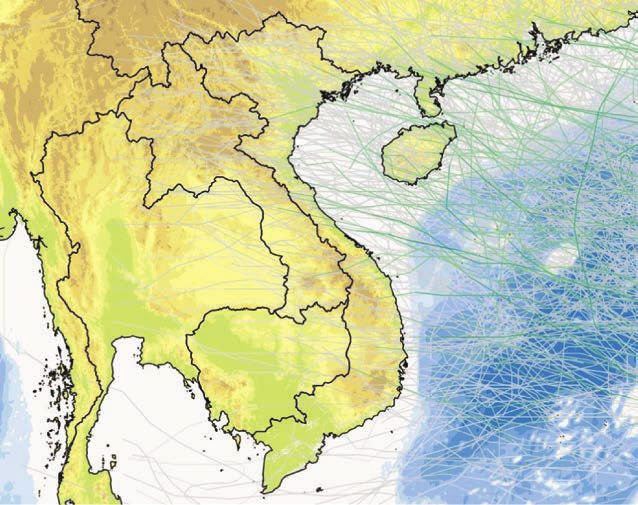
Vietnam demonstrates dedication to combating climate change through a range of national policies and concrete
adaptation measures. In 2011, the National Climate Change Strategy was issued, outlining the objectives for
2016–2050. In 2012, the National Green Growth Strategy was approved, which includes mitigation targets
and measures. In 2013, the Law on Natural Disaster Prevention and Control was enacted, aiming to address
diverse natural hazards that affect the country, which are primarily climate related. Additionally, the 2014 Law on
Environment includes a full chapter on climate change. Vietnam ratified the Paris Agreement on November 3, 2016
and the associated Nationally Determined Contribution.

This document aims to succinctly summarize the climate risks faced by Vietnam. This includes short and long-
term changes in key climate parameters, as well as impacts of these changes on communities, livelihoods and
economies, many of which are already underway. This is a high-level synthesis of existing research and analyses,
focusing on the geographic domain of Vietnam, therefore potentially overlooking some international influences
and localized impacts. The core data presented is sourced from the database sitting behind the World Bank’s
Climate Change Knowledge Portal (CCKP). This document also aims to direct the reader to many useful sources
of secondary data and research.

TABLE 1.  Key indicators

Indicator                                                          Value                                      Source
Population Undernourished                                          10.7% (2014–2016)                          FAO, 2017
National Poverty Rate                                              7.0% (2015)                                ADB, 2018
Share of Wealth Held by Bottom 20%                                 7.1% (2014)                                WB, 2018
Net Migration Rate                                                 –0.04% (2010–2015)                         UNDESA, 2017
Infant Mortality Rate (Between Age 0 and 1)                        1.9% (2010–2015)                           UNDESA, 2017
Average Annual Change in Urban Population                          2.1% (2010–2015)                           UNDESA, 2018
Dependents per 100 Independent Adults                              59.5 (2015)                                UNDESA, 2017
Urban Population as % of Total Population                          35.9% (2018)                               CIA, 2018
External Debt Ratio to GNI                                         42.5% (2015)                               ADB, 2017a
Government Expenditure Ratio to GDP                                28.7% (2016)                               ADB, 2017a

Notre-Dame GAIN Index Ranking (2016)
         The ND-GAIN Index ranks 181 countries using a score which calculates a country’s vulnerability to climate
         change and other global challenges as well as their readiness to improve resilience. The more vulnerable a
 96th
         country is the lower their score, while the readier a country is to improve its resilience the higher it will be. Norway
         has the highest score and is ranked 1st (University of Notre-Dame, 2018).

CLIMATE RISK COUNTRY PROFILE — VIETNAM                                                                                              3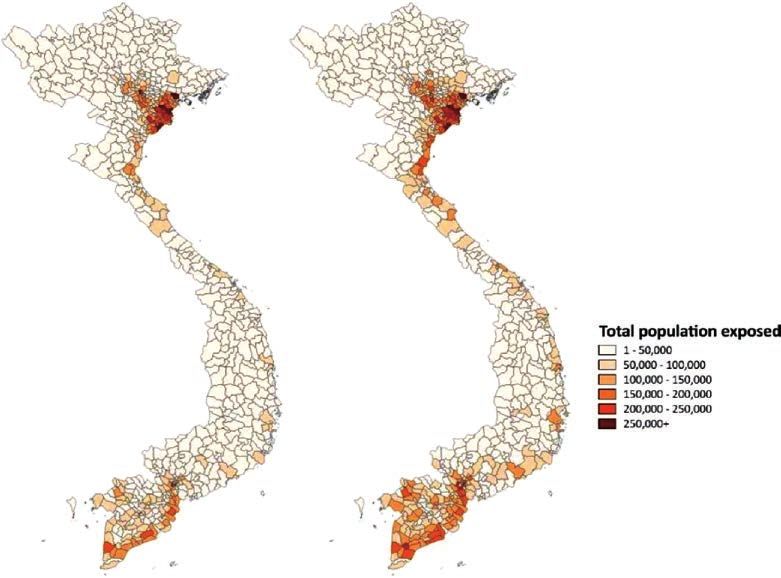
CLIMATOLOGY

Climate Baseline
Overview
Vietnam has both a tropical climate zone and a temperate climate zone, with all of the country experiencing the
effects of the annual monsoon (see the country’s annual climate cycle in Figure 1). Rainy seasons correspond to
monsoon circulations, which bring heavy rainfall in the north and south from May to October, and in the central
regions from September to January. In the northern regions, average temperatures range from 22–27.5°C in
summer to 15–20°C in winter, while the southern areas have a narrower range of 28–29°C in summer to 26–27°C
in winter (see regional changes in Figures 2 and 3). Vietnam’s climate is also impacted by the El Niño Southern
Oscillation (ENSO), which influences monsoonal circulation, and drives complex shifts in rainfall and temperature
patterns which vary spatially at a sub-national level.. El Niño has also been shown to influence sea-level,2 drought
incidence3 and even disease incidence.4

Annual Cycle

FIGURE 1.  Average monthly temperature and rainfall in Vietnam (1901–2016)5
               30ºC                                                                                                      320 mm

               25ºC                                                                                                      240 mm
Temperature

               20ºC                                                                                                      160 mm     Rainfall

               15ºC                                                                                                      80 mm

               10ºC                                                                                                      0 mm
                         Jan     Feb     Mar     Apr     May     Jun     Jul    Aug     Sep     Oct     Nov     Dec

                                                         Rainfall           Temperature

2
              Muis, S., Haigh, I. D., Guimarães Nobre, G., Aerts, J. C. J. H., & Ward, P. J. (n.d.). Influence of El Niño-Southern Oscillation on Global
              Coastal Flooding. Earth’s Future, 6(9), 1311–1322.
3
              Sano, M., Buckley, B.M. and Sweda, T. 2009. Tree-ring based hydroclimate reconstruction over northern Vietnam from Fokienia
              hodginsii: eighteenth century mega-drought and tropical Pacific influence. Climate Dynamics, 33, 331–340.
4
              Thai, K.T., Cazelles, B., Van Nguyen, N., Vo, L.T., Boni, M.F., Farrar, J., Simmons, C.P., van Doorn, H.R. and de Vries, P.J. 2010. Dengue dynamics
              in Binh Thuan province, southern Vietnam: periodicity, synchronicity and climate variability. PLoS Neglected Tropical Diseases, 4, pp. 747.
5
              World Bank Climate Change Knowledge Portal (2018). Climate Data: Historical. URL: https://climateportal.worldbank.org.

CLIMATE RISK COUNTRY PROFILE — VIETNAM                                                                                                                              4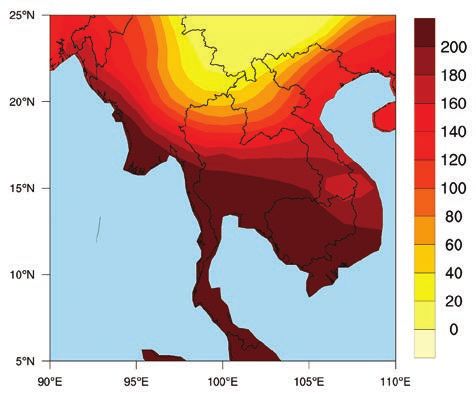
Spatial Variations

FIGURE 2.  (Left) Annual maximum temperature, (centre) annual mean temperature, and (right)
annual minimum temperature (°C) in Vietnam over the period 1901–20166

FIGURE 3.  Annual mean rainfall (mm) in Vietnam over the period 1901–20167

Key Trends
Temperature
Mean annual temperature has increased by 0.5–0.7°C since 1960, with the rate of increase most rapid in southern
Vietnam and the Central Highlands. In the period 1971–2010 the rate of warming is estimated at 0.26°C per
decade, this is reported as being almost twice the rate of global warming over the same period.8 Greater warming
has been identified in winter months than in summer months. The frequency of ‘hot’ days and nights has increased
significantly since 1960 in every season, and the annual frequency of ‘cold’ days and nights has decreased
significantly.

6
    World Bank Climate Change Knowledge Portal (2018). Climate Data: Historical. URL: https://climateportal.worldbank.org.
7
    World Bank Climate Change Knowledge Portal (2018). Climate Data: Historical. URL: https://climateportal.worldbank.org.
8
    Nguyen, D. Q., Renwick, J., & Mcgregor, J. (2014). Variations of surface temperature and rainfall in Vietnam from 1971 to 2010.
    International Journal of Climatology: 34: 249–264

CLIMATE RISK COUNTRY PROFILE — VIETNAM                                                                                                5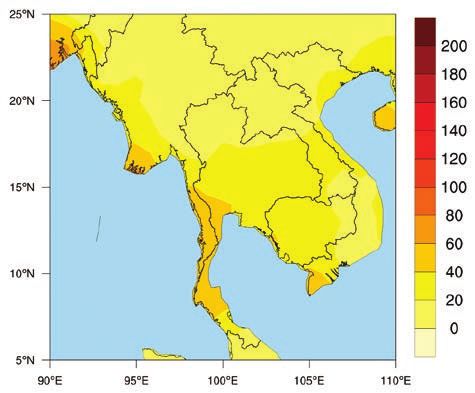
Precipitation
Mean rainfall over Vietnam does not show any significant increase or decrease on a national level since 1960.
The proportion of rainfall falling in heavy events has not changed significantly since 1960, nor has the maximum
amount falling in 1-day or 5-day events. However, on a sub-national level some changes are significant, the general
trend has been towards increased rainfall in central regions, and reduced rainfall in northern and southern regions.9
El Niño remains a major influencer of trends in precipitation.10

Climate Future
RCPs
The Representative Concentration Pathways (RCPs) represent four plausible futures, based on the rate of
emissions reduction achieved at the global level. For more background please refer to the World Bank Climate
Change Knowledge Portal (CCKP) metadata. For reference, Table 2 provides information on all four RCPs over
two time periods. In subsequent analysis RCP 2.6 and 8.5,
the extremes of low and high emissions pathways, are the
                                                                  A Precautionary Approach
primary focus. RCP2.6 would require rapid and systemic
global action, achieving emissions reduction throughout
                                                                  Studies published since the last iteration of
the 21st century sufficient to reach net zero global
                                                                  the IPCC’s report (AR5), such as Gasser et
emissions by around 2080. RCP8.5 assumes annual
                                                                  al. (2018), have presented evidence which
global emissions will continue to increase throughout
                                                                  suggests a greater probability that earth will
the 21st century. Climate changes under each emissions
                                                                  experience medium and high-end warming
pathway are presented against a reference period of
                                                                  scenarios than previously estimated. Climate
1986–2005 for all indicators.
                                                                  change projections associated with the
                                                                  highest emissions pathway (RCP8.5) are
Model ensemble                                                    presented here to facilitate decision making
                                                                  which is robust to these risks.
Climate projections presented in this document are
derived from datasets made available on the World
Bank’s Climate Change Knowledge Portal (CCKP),
unless otherwise stated. These datasets are processed outputs of simulations performed by multiple General
Circulation Models (GCM) developed by climate research centers around the world and evaluated by the IPCC
for quality assurance in the CMIP5 iteration of models (for further information see Flato et al., 2013). Collectively,
these different GCM simulations are referred to as the ‘model ensemble’. Due to the differences in the way GCMs

9
     Katzfey, J., McGregor, J., Suppiah, R. (2014) High-resolution climate projections for Vietnam: Technical Report. CSIRO, Australia.
10
     Nguyen, D. Q., Renwick, J., & Mcgregor, J. (2014). Variations of surface temperature and rainfall in Vietnam from 1971 to 2010.
     International Journal of Climatology: 34: 249–264

CLIMATE RISK COUNTRY PROFILE — VIETNAM                                                                                                    6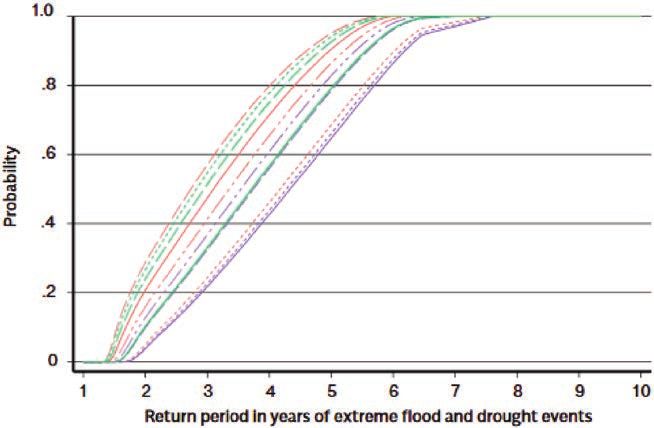
TABLE 2.  Projections of average annual temperature anomaly (°C) in Vietnam in 2040–2059
and 2080–2099 from the reference period of 1986–2005 for all RCPs. The table is showing the
median of 16 GCM model ensemble and the 10–90th percentiles in brackets.11

                     Annual Average of                                                                Annual Average of
                     Monthly Maximum                        Annual Average                            Monthly Minimum
     Scenario        2040–2059                 2080–2099    2040–2059           2080–2099             2040–2059        2080–2099
     RCP2.6          1.2                       1.2          1.0                 1.0                   1.1              1.0
                     (0.5, 1.9)                (0.5, 2.1)   (0.5, 1.7)          (0.4, 1.9)            (0.5, 1.8)       (0.4, 2.0)
     RCP4.5          1.5                       2.1          1.4                 1.8                   1.4              1.9
                     (0.7, 2.5)                (1.1, 3.2)   (0.8, 2.1)          (1.1, 2.9)            (0.7, 2.0)       (1.2, 2.9)
     RCP6.0          1.2                       2.3          1.1                 2.0                   1.1              2.2
                     (0.5, 2.0)                (1.4, 3.7)   (0.6, 1.6)          (1.4, 3.1)            (0.4, 1.7)       (1.4, 3.3)
     RCP8.5          2.0                       4.1          1.6                 3.4                   1.7              3.7
                     (1.1, 2.9)                (2.5, 5.7)   (1.1, 2.6)          (2.6, 5.1)            (1.1, 2.6)       (2.6, 5.1)

TABLE 3.  Projections of average temperature anomaly (°C) in Vietnam for different seasons
(3-monthly time slices) over different time horizons and emissions pathways, showing the median
of 16 GCM model ensemble and the 10–90th percentiles in brackets.2

                                  2040–2059                                                  2080–2099
     Scenario                     Jun–Aug                   Dec–Feb                          Jun–Aug                   Dec–Feb
     RCP2.6                       1.0                       1.0                              1.0                       1.1
                                  (0.5, 1.6)                (0.3, 1.7)                       (0.4, 1.7)                (0.4, 2.0)
     RCP4.5                       1.3                       1.3                              1.8                       1.9
                                  (0.9, 1.7)                (0.7, 2.1)                       (1.2, 2.5)                (0.9, 2.8)
     RCP6.0                       1.1                       1.0                              2.1                       2.1
                                  (0.7, 1.5)                (0.6, 1.5)                       (1.5, 2.9)                (1.3, 3.0)
     RCP8.5                       1.7                       1.7                              3.6                       3.5
                                  (1.3, 2.3)                (1.0, 2.6)                       (2.8, 4.8)                (2.4, 5.2)

represent the key physical processes and interactions within the climate system, projections of future climate
conditions can vary widely between different GCMs. This is particularly the case for rainfall related variables and at
national and local scales. Exploring the spread of climate model outputs can assist in understanding uncertainties
associated with climate models. The range of projections from 16 GCMs on the indicators of average temperature
anomaly and annual precipitation anomaly for Vietnam under RCP8.5 is shown in Figure 4.

11
      World Bank Climate Change Knowledge Portal (2018). Climate Data: Projection. URL: https://climateportal.worldbank.org.
12
      World Bank Climate Change Knowledge Portal (2018). Climate Data: Projection. URL: https://climateportal.worldbank.org.

CLIMATE RISK COUNTRY PROFILE — VIETNAM                                                                                              7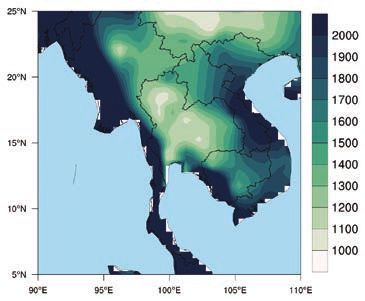
FIGURE 4. ‘Projected average temperature Global Temperature Projections
anomaly’ and ‘projected annual rainfall
anomaly’ in Vietnam. Outputs of 16 models Unless otherwise stated projections
within the ensemble simulating RCP8.5 over the shown here represent changes against
period 2080–2099. Models shown represent the 1986–2005 baseline. An additional
the subset of models within the ensemble 0.61°C of global warming is estimated
which provide projections across all RCPs and to have taken place between the periods
therefore are most robust for comparison. 1850–1900 and 1986–2005 (Kirtman
5.5 et al., 2013). The global average
Average temperature anomaly (°C)
5
temperature changes projected between
Median,
10th and 90th
1986–2005 and 2081–2100 in the
4.5
Percentiles IPCC’s Fifth Assessment Report are:
4
3.5 • RCP2.6: 1.0°C
3
• RCP4.5: 1.8°C
• RCP6.0: 2.2°C
2.5
–200 –100 0 100 200 300
Precipitation anomaly (mm/yr)
400 500
• RCP8.5: 3.7°C
Temperature Changes
Projections of future temperature change are presented in three primary formats. Shown in Table 2 are the changes
in daily maximum and daily minimum temperatures over the given time period, as well as changes in the average
temperature. Figures 5 and 6 display only the monthly average temperature projections. While similar, these three
indicators can provide slightly different information. Monthly/annual average temperatures are most commonly used for
general estimation of climate change, but the daily maximum and minimum can explain more about how daily life might
change in a region, affecting key variables such as the viability of ecosystems, health impacts, productivity of labour, and
the yield of crops, which are often disproportionately influenced by temperature extremes.
Vietnam is projected to experience an average temperature increase of 3.36°C by 2080–2100 under the highest
emission pathway (RCP8.5). This warming is slightly less than the global average projected by the IPCC AR5
report of 3.7°C. By the end of the century Vietnam is projected to experience three times greater warming under
RCP8.5 when compared to RCP2.6, the lowest emissions pathway. Notably, across all emissions scenarios and
future time periods changes in annual maximum temperatures are greater than changes in average temperature.
Study suggests that temperature increases will be strongest in southern Vietnam, but uncertainty is high in sub-
national comparisons.13
Precipitation changes
Considerable uncertainty clouds projections of future precipitation change, as shown in Figure 7, none of the
end-of-century changes across the four emissions pathways are statistically significant. However, as shown
in Figure 4, out of 16 models analyzed, 12 show an increase in average annual precipitation. Comprehensive
13
Katzfey, J., McGregor, J., Suppiah, R. (2014) High-resolution climate projections for Vietnam: Technical Report. CSIRO, Australia.
CLIMATE RISK COUNTRY PROFILE — VIETNAM 8FIGURE 5. Historic and projected average FIGURE 6. Projected change in monthly
annual temperature in Vietnam under RCP2.6 temperature for Vietnam for the period
(blue) and RCP8.5 (red). The values shown 2080–2099 under RCP8.5. The values shown
represents the median of 30+ GCM model represents the median of 30+ GCM model
ensemble with the shaded areas showing the ensemble with the shaded areas showing the
10–90th percentiles.14 10–90th percentiles.15
analysis of climate projections on a regional level
suggests that there is no strong consensus around FIGURE 7. Boxplots showing the projected
either significant increases or decreases in annual average annual precipitation for Vietnam
rainfall.16 Some variation in extreme rainfall amounts in the period 2080–2099.20
is reported, with some increases in extreme rainfall
projected in southern and central Vietnam, and slight
reductions projected elsewhere. These projections
are broadly in line with global trends. The intensity
of sub-daily extreme rainfall events appears to be
increasing with temperature, a finding supported by
evidence from different regions of Asia.17 The poor
performance of global climate models in consistently
projecting precipitation trends has been linked to their
poor simulation of the El Niño phenomenon,18,19 an
important area for future development.
14
World Bank Climate Change Knowledge Portal (2018). Climate by Sector: Interactive Climate Indicator Dashboard. URL: https://
climateportal.worldbank.org.
15
World Bank Climate Change Knowledge Portal (2018). Climate by Sector: Interactive Climate Indicator Dashboard. URL: https://
climateportal.worldbank.org.
16
Katzfey, J., McGregor, J., Suppiah, R. (2014) High-resolution climate projections for Vietnam: Technical Report. CSIRO, Australia.
17
Westra, S., Fowler, H. J., Evans, J. P., Alexander, L. V., Berg, P., Johnson, F., Kendon, E. J., Lenderink, G., Roberts, N. (2014). Future
changes to the intensity and frequency of short-duration extreme rainfall. Reviews of Geophysics, 52, 522–555.
18
Yun, K.S., Yeh, S.W. and Ha, K.J. 2016. Inter-El Niño variability in CMIP5 models: Model deficiencies and future changes. Journal of
Geophysical Research: Atmospheres, 121, 3894–3906.
19
Chen, C., Cane, M.A., Wittenberg, A.T. and Chen, D. 2017. ENSO in the CMIP5 simulations: life cycles, diversity, and responses to
climate change. Journal of Climate, 30, 775–801.
20
World Bank Climate Change Knowledge Portal (2018). Climate by Sector: Interactive Climate Indicator Dashboard. URL: https://
climateportal.worldbank.org.
CLIMATE RISK COUNTRY PROFILE — VIETNAM 9CLIMATE CHANGE AND NATURAL HAZARD RISK
V
ietnam faces high disaster risk levels, ranked 91 out of 191 countries by the 2019 INFORM Risk Index
(Table 4), driven particularly by its exposure to hazards. Vietnam has extremely high exposure to flooding
(ranked joint 1st with Bangladesh), including, riverine, flash, and coastal flooding. Vietnam also has high
exposure to tropical cyclones and their associated hazards (ranked 8th). Drought exposure is slightly lower (ranked
82nd) but is still significant as highlighted by the severe drought of 2015–2017. Vietnam’s overall ranking on the
INFORM Risk Index is somewhat mitigated by its better scores in terms of vulnerability and coping capacity. Table 5
provides an overview of the social and economic losses associated with natural disasters in Vietnam from 1900 to
2018. The sections below highlight potential impacts of climate change on the key natural hazards in the country.
TABLE 4. Selected indicators from the INFORM 2019 Index for Risk Management for Vietnam.
For the sub-categories of risk (e.g. “Flood”) higher scores represent greater risks. Conversely the
most at-risk country is ranked 1st.
Lack of Overall
Tropical Coping Inform
Cyclone Drought Vulnerability Capacity Risk Level
Flood (0–10) (0–10) (0–10) (0–10) (0–10) (0–10) Rank (1–191)
10.0 7.9 3.5 2.4 4.2 3.8 91
TABLE 5. Summary of Natural Hazards in Vietnam from 1900 to 2018.21
Events Total Total Total damage
Disaster Type Disaster Subtype Count Deaths Affected (‘000 US$)
Drought Drought 6 0 7,860,000 7,399,120
Epidemic Others 1 16 83 0
Bacterial disease 1 598 10,848 0
Parasitic disease 1 200 0 0
Viral disease 8 395 97,027 0
Flood Others 16 1,012 2,011,287 160,055
Coastal flood 6 804 4,353,316 749,000
Flash flood 13 481 912,607 516,700
Riverine flood 52 3,644 25,637,158 2,896,407
Landslide Avalanche 1 200 38,000 0
Landslide 4 109 40 0
Mudslide 1 21 1,034 2,300
Storm Others 10 323 219,280 145,035
Convective storm 8 160 4,513 10,100
Tropical cyclone 92 18,869 53,272,568 9,967,657
21
Emergency Events Database (EM-DAT) of the Centre for Research on the Epidemiology of Disasters (CRED). Assessed on Nov 26,
2018 at https://www.emdat.be/.
CLIMATE RISK COUNTRY PROFILE — VIETNAM 10Heat Waves
Vietnam regularly experiences high maximum temperatures, with an average monthly maximum of around 28°C
and an average May maximum of 31°C. The current daily probability of a heat wave is around 3%.22 Temperature
rises in Vietnam, a country already experiencing high average temperatures, are expected to lead to what might be
considered chronic heat stress in some areas, even under lower emissions pathways. Study highlights both Hanoi
and Ho Chi Minh City among the urban areas most threatened by deadly heat globally.23
Multi-model ensemble suggests an increase in the
daily probability of heatwave under all emissions FIGURE 8. Projected changes in daily
pathways. Changes are significantly greater probability of observing a heat wave in
under higher emissions pathways, with probability Vietnam under all RCPs. A ‘Heat Wave’ is
increasing to 40% by 2080–2099 under RCP8.5, defined as a period of 3 or more days where
versus around 8% under RCP2.6 (Figure 8). the daily temperature is above the long-term
These values reflect a transition to a less stable 95th percentile of daily mean temperature.25
temperature regime. Heatwaves and temperature
extremes are likely to remain correlated with ENSO
events, and ENSO can be treated as an early
warning of potential disaster-level events when
the two drivers combine. Analysis suggests climate
change made a 29% contribution to the extreme
temperatures experienced across Southeast Asia
in April 2016, while ENSO contributed 49%. The
contribution of general global warming is likely to
grow, the contribution of climate change through
its likely impact on the ENSO process is poorly
understood. 24
Drought
Two primary types of drought may affect Vietnam, meteorological (usually associated with a precipitation deficit)
and hydrological (usually associated with a deficit in surface and subsurface water flow, potentially originating in
the region’s larger river basins). At present Vietnam faces an annual median probability of severe meteorological
drought of around 4%, as defined by a standardized precipitation evaporation index (SPEI) of less than –2.26
Recent analysis provides a global overview of changes in drought conditions under different warming scenarios.
Projections for Southeast Asia suggest that the return periods of droughts will reduce. This trend is less significant
22
World Bank Climate Change Knowledge Portal (2018). Climate Data: Projection. URL: https://climateportal.worldbank.org.
23
Matthews, T., Wilby, R.L. and Murphy, C. 2017. Communicating the deadly consequences of global warming for human heat stress.
Proceedings of the National Academy of Sciences, 114, 3861–3866.
24
Thirumalai, K., DiNezio, P. N., Okumura, Y., & Deser, C. (2017). Extreme temperatures in Southeast Asia caused by El Niño and
worsened by global warming. Nature Communications: 8: 15531
25
World Bank Climate Change Knowledge Portal (2018). Climate by Sector: Interactive Climate Indicator Dashboard. URL: https://
climateportal.worldbank.org.
26
World Bank Climate Change Knowledge Portal (2018). Climate Data: Projection. URL: https://climateportal.worldbank.org.
CLIMATE RISK COUNTRY PROFILE — VIETNAM 11under lower levels of global warming, but once warming reaches 2–3°C events that presently occur only once in
every hundred years may return at frequencies greater than once in every fifty years in Southeast Asia.27
Broadly in line with this estimate the multi-model
ensemble projects an increase in the annual FIGURE 9. Annual probability of Vietnam
probability of drought in Vietnam of around 10% experiencing a year with severe drought
under all emissions pathways (Figure 9), and this conditions in the period 2080–2099.29
increase remains relatively constant over the period
from 2020–2100. Analysis suggests these changes
apply across all of Vietnam’s regions, with droughts
projected to take place more often and for longer
periods. However, there is some variation between
climate models and downscaling approaches and
caution should be applied to the application of these
projections.28
Flood
TFlood represents the largest risk by economic impact in Vietnam, accounting for an estimated 97% of average
annual losses from hazards. The World Resources Institute’s AQUEDUCT Global Flood Analyzer can be used to
establish a baseline level of river flood exposure. As of 2010, assuming protection for up to a 1-in-25 year event,
the population annually affected by flooding in Vietnam is estimated at 930,000 people and expected annual
impact on GDP at $2.6 billion.30 This is slightly higher than the UNISDR estimate of annual losses from all flood
types of approximately $2.3 billion.31
Development and climate change are both likely to increase these figures. A study by the World Bank suggests that
around 33% of the national population are vulnerable to flooding at a return level of 1-in-25 years, but this will increase
to 38% under RCP2.6 and 46% under RC8.5 by 2100.32 AQUEDUCT makes a similar projection, but reported
in annualized terms. The climate change component, when isolated, is projected to increase the annually affected
population by 433,000 people, and the impact on GDP by $3.6 billion by 2030 under the RCP8.5 emissions pathway.
Impacts are heavily concentrated in Vietnam’s two mega-river deltas, of the Red River and Mekong River, and urban
areas in their vicinity including the nation’s two largest conurbations, Hanoi and Ho Chi Minh City (Figure 10). The
deltas receive floods annually with the monsoon season, and over decades many households have learned to live
27
Naumann, G., Alfieri, L., Wyser, K., Mentaschi, L., Betts, R. A., Carrao, H., . . . Feyen, L. (2018). Global Changes in Drought Conditions
Under Different Levels of Warming. Geophysical Research Letters, 45(7), 3285–3296
28
Katzfey, J., McGregor, J., Suppiah, R. (2014) High-resolution climate projections for Vietnam: Technical Report. CSIRO, Australia.
29
World Bank Climate Change Knowledge Portal (2018). Climate by Sector: Interactive Climate Indicator Dashboard. URL: https://
climateportal.worldbank.org.
30
WRI (2018) AQUEDUCT Global Flood Analyzer. Available at: https://floods.wri.org/# [Accessed: 22/11/2018]
31
UNISDR (2014) PreventionWeb: Basic country statistics and indicators. Available at: https://www.preventionweb.net/countries
[accessed 14/08/2018]
32
Bangalore, M., Smith, A., & Veldkamp, T. (2016). Exposure to Floods, Climate Change, and Poverty in Vietnam. Policy Research
Working Paper 7765, The World Bank. URL: http://documents.worldbank.org/curated/en/928051469466398905/pdf/WPS7765.pdf
33
Willner, S., Levermann, A., Zhao, F., Frieler, K. (2018) Adaptation required to preserve future high-end river flood risk at present
levels. Science Advances: 4:1
CLIMATE RISK COUNTRY PROFILE — VIETNAM 12FIGURE 10. Absolute exposure at the district level (total number of people in a district exposed),
for a 25-year historical flood (left) and a 25-year historical flood under RCP8.5.34
with, and exploit the benefits provided by the flood. Intensification of extreme events, as projected by most global
models, as well as rising sea-levels, will exacerbate the risks posed by river floods. Research projects an increase in
the population affected by an extreme river flood in the order of 3–10 million by 2035–2044 as a result of climate
change (Table 6).33
TABLE 6. Estimated number of people affected by an extreme river flood (extreme river flood
is defined as being in the 90th percentile in terms of numbers of people affected) in the historic
period 1971–2004 and the future period 2035–2044. Figures represent an average of all four
RCPs and assume present day population distributions.35
Population Exposed Population Exposed Increase
to Extreme Flood to Extreme Flood in Affected
Estimate (1971–2004) (2035–2044) Population
16.7 Percentile 4,714,238 14,500,863 9,786,625
Median 10,009,842 17,870,746 7,860,904
83.3 Percentile 18,246,015 21,576,580 3,330,565
34
Bangalore, M., Smith, A., & Veldkamp, T. (2016). Exposure to Floods, Climate Change, and Poverty in Vietnam. Policy Research
Working Paper 7765, The World Bank
35
Willner, S., Levermann, A., Zhao, F., Frieler, K. (2018) Adaptation required to preserve future high-end river flood risk at present
levels. Science Advances: 4:1
CLIMATE RISK COUNTRY PROFILE — VIETNAM 13Tropical Cyclones and Storm Surge
Vietnam has very high exposure to tropical cyclones, with a particularly high rate of landfall along its northern coast
(Figure 11). Climate change is expected to interact with cyclone hazard in complex ways which are currently poorly
understood. Known risks include the action of sea-level rise to enhance the damage caused by cyclone-induced
storm surges, and the possibility of increased wind speed and precipitation intensity. Previous work by the World
Bank, albeit based on older climate projections, has highlighted the potentially significant growth in the area of
Vietnam that would be exposed to storm surge under increased sea-levels and storm intensities.36
FIGURE 11. Historical cyclone tracks over Vietnam (1970–2015)37
Tropical depression
Tropical storm
SScat 1
SScat 2
SScat 3
SScat 4
SScat 5
36
Dasgupta, S., Laplante, B., Murray, S. and Wheeler, D. 2009. Sea-level Rise and Storm Surges: A Comparative Analysis of Impacts
in Developing Countries. The World Bank.
37
The Global Risk Data Platform. Assessed on Nov 26, 2018 at https://preview.grid.unep.ch/index.php?preview=map&lang=eng.
38
Walsh, K., McBride, J., Klotzbach, P., Balachandran, S., Camargo, S., Holland, G., Knutson, T., Kossin, J., Lee, T., Sobel, A., Sugi, M. (2015)
Tropical cyclones and climate change. WIREs Climate Change: 7: 65–89
CLIMATE RISK COUNTRY PROFILE — VIETNAM 14Modelling of climate change impacts on cyclone intensity and frequency conducted across the globe points to a
general trend of reduced cyclone frequency and increased intensity and frequency of the most extreme events.38
Further research is required to better understand potential changes in cyclone seasonality and routes, and the
potential for cyclone hazards to be experienced in unprecedented locations.
Studies suggest there has been a general trend involving an eastward shift of cyclone activity in the Western
North Pacific. Studies suggest this shift may be enhanced by climate change under higher emissions pathways.39
While studies are limited to subsets of models and many utilize older emissions scenarios and/or the AR3 model
ensemble, existing data suggests this has already begun reducing the frequency of tropical cyclone landfall over
Vietnam and Southeast Asia.40 Studies (albeit with similar limitations) have also suggested a small potential shift
of cyclone activity away from summer months and towards the winter.41
Climate change induced sea-level rise is likely to increase the potential risk associated with storm surges driven by
tropical cyclones. Studies estimate that without adaptation 9% of national GDP will be at risk from the impact of
a 1-in-100-year storm surge impacting the Red River Delta region in 2050.42 Storm surge is found to be a major
contributor to the economic costs of climate change on a national level in the period beyond 2050.43
39
Kossin, J., Emmanuel, K., Camargo, S. (2016) Past and projected changes in Western North Pacific tropical cyclone exposure.
Journal of Climate: 29: 5725–5739
40
Redmond, G., Hodges, K. I., Mcsweeney, C., Jones, R., & Hein, D. (2015). Projected changes in tropical cyclones over Vietnam and the
South China Sea using a 25 km regional climate model perturbed physics ensemble. Climate Dynamics: 45: 1983–2000
41
Wang, C., Liang, J., & Hodges, K. I. (2017). Projections of tropical cyclones affecting Vietnam under climate change: downscaled
HadGEM2-ES using PRECIS 2.1. Quarterly Journal of the Royal Meteorological Society: 143: 1844–1859
42
Neumann, J., Emanuel, K., Ravela, S., Ludwig, L., & Verly, C. (2015). Risks of Coastal Storm Surge and the Effect of Sea Level Rise in
the Red River Delta, Vietnam. Sustainability: 7: 6553–6572
43
Arndt, C., Tarp, F., & Thurlow, J. (2015). The economic costs of climate change: A multi-sector impact assessment for Vietnam.
Sustainability: 7: 4131–4145.
CLIMATE RISK COUNTRY PROFILE — VIETNAM 15CLIMATE CHANGE IMPACTS
Climate Change Impacts on Natural Resources
Water
Vietnam’s water resources already experience significant pressures from human development processes. Key issues
include over-utilization of groundwater, land-use changes (notably to aquaculture) and rapid, sometimes unplanned,
urban development.44 These processes also include transboundary issues in the case of the Mekong river, the basin
of which spans four other nations. Considerable uncertainty clouds projections of change in future precipitation and
cyclone activity. Most studies suggest such changes will have a markedly lesser impact in comparison with human
development impacts. Dam construction is having a very significant impact on the hydrology of the Mekong, but
overexploitation of groundwater resources also represents a major pressure on the Delta.45 However, a potential
shift in tropical cyclone activity associated with climate change may have noticeable impacts on flow dynamics.46
Peak flows associated with tropical cyclones have historically delivered the majority of the sediment which ultimately
deposits in the Mekong Delta and determines its capacity to build land height against sea-level rise. Any changes in
the frequency and severity of extreme events are likely to have major social and economic consequences, as shown
by the drought event of 2015–2017 and the flooding regularly experienced in the Mekong Delta throughout the
1990’s and 2000’s. In the case of the Mekong Delta, where water resources management is a particular challenge,
the Mekong Delta Plan, ratified in 2013, aims to set a future course balancing competing development objectives
and managing climate change risks.
The Coastal Zone
Sea-level rise threatens significant physical changes to coastal zones around the world. Global mean sea-level rise
was estimated in the range of 0.44–0.74m by the end of the 21st century by the IPCC’s Fifth Assessment Report47
but some studies published more recently have highlighted the potential for more significant rises (Table 7).
Vietnam is one of the world’s most vulnerable countries to sea-level rise. Without adaptation an estimated 12 million
people face permanent inundation on higher emissions pathways, primarily concentrated in the nation’s two low-
lying mega-river deltas (Table 8). An estimated 2.4% of Vietnam’s GDP is at risk from permanent inundation in the
Red River Delta region.48 The national and provincial governments of Vietnam are already working to protect their
coastline, primarily through hard infrastructure, and in some cases through mangrove restoration. The protection
44
Erban, L. E., Gorelick, S. M., & Zebker, H. a. (2014). Groundwater extraction, land subsidence, and sea-level rise in the Mekong Delta,
Vietnam. Environmental Research Letters, 9(8), 084010.
45
Erban, L. E., Gorelick, S. M., & Zebker, H. a. (2014). Groundwater extraction, land subsidence, and sea-level rise in the Mekong Delta,
Vietnam. Environmental Research Letters, 9(8), 084010.
46
Darby, S. E., Hackney, C. R., Leyland, J., Kummu, M., Lauri, H., Parsons, D. R., . . . Aalto, R. (2016). Fluvial sediment supply to a
mega-delta reduced by shifting tropical-cyclone activity. Nature: 539: 276
47
Church, J. a., Clark, P. U., Cazenave, A., Gregory, J. M., Jevrejeva, S., Levermann, A., . . . Unnikrishnan, A. S. (2013). Sea level change.
In Climate Change 2013: The Physical Science Basis. Contribution of Working Group I to the Fifth Assessment Report of the
Intergovernmental Panel on Climate Change (pp. 1137–1216). Cambridge, United Kingdom and New York, NY, USA: Cambridge
University Press.
CLIMATE RISK COUNTRY PROFILE — VIETNAM 16TABLE 7. Estimates of global mean sea-level rise by rate and total rise compared to 1986–2005
including likely range shown in brackets, data from Chapter 13 of the IPCC’s Fifth Assessment
Report with upper-end estimates based on higher levels of Antarctic ice-sheet loss from Le Bars
et al. 2017.
Rate of Global Mean Sea-Level Global Mean Sea-Level Rise in
Scenario Rise in 2100 2100 Compared to 1986–2005
RCP2.6 4.4 mm/yr (2.0–6.8) 0.44 m (0.28–0.61)
RCP4.5 6.1 mm/yr (3.5–8.8) 0.53 m (0.36–0.71)
RCP6.0 7.4 mm/yr (4.7–10.3) 0.55 m (0.38–0.73)
RCP8.5 11.2 mm/yr (7.5–15.7) 0.74 m (0.52–0.98)
Estimate Inclusive of High-End Antarctic Ice-Sheet Loss 1.84 m (0.98–2.47)
of the Mekong Delta has been the subject of debate through the development of the Mekong Delta Plan and its
vision to 2050. In 2016 the Ministry of Natural Resources and the Environment published an extensive assessment
of national vulnerability to sea-level rise. The report identifies vulnerable areas in the Red and Mekong deltas,
with 50cm of sea-level rise potentially inundating 6.9% and 4.5% respectively, as well as some vulnerable central
provinces, such as Quang Binh Province where 50cm would inundate 1.7% of the surface area.
In addition to the threat of permanent inundation, livelihoods in Vietnam’s low-lying areas face major challenges
from saline intrusion, which has already forced land-use changes, abandonment, and reduced yields in many
provinces. During particularly severe dry seasons, such as in 2016, salt has intruded up to 50km inland from the
coast and estuary, resulting in major crop damage. Coastal erosion exacerbated by climate change is also an
increasing threat to Vietnam’s extensive coastline.49
TABLE 8. The average number of people experiencing flooding per year in the coastal zone in the
period 2070–2100 under different emissions pathways (assumed medium ice-melt scenario)
and adaptation scenarios for Vietnam (UK Met Office, 2014)50
Scenario Without Adaptation With Adaptation
RCP2.6 6,335,260 47,920
RCP8.5 12,759,460 65,740
48
Neumann, J., Emanuel, K., Ravela, S., Ludwig, L., & Verly, C. (2015). Risks of Coastal Storm Surge and the Effect of Sea Level Rise in
the Red River Delta, Vietnam. Sustainability: 7: 6553–6572
49
Duc, D.M., Yasuhara, K., Hieu, N.M. and Lan, N.C. 2017. Climate change impacts on a large-scale erosion coast of Hai Hau district,
Vietnam and the adaptation. Journal of Coastal Conservation, 21, 47–62.
50
UK Met Office (2014) Human dynamics of climate change: Technical Report. Met Office, UK Government
CLIMATE RISK COUNTRY PROFILE — VIETNAM 17Climate Change Impacts on Economic Sectors
Agriculture
Climate change will influence food production via direct and indirect effects on crop growth processes. Direct effects
include alterations to carbon dioxide availability, precipitation and temperatures. Indirect effects include through
impacts on water resource availability and seasonality, soil organic matter transformation, soil erosion, changes in
pest and disease profiles, the arrival of invasive species, and decline in arable areas due to the submergence of
coastal lands and desertification. On an international level, these impacts are expected to damage key staple crop
yields, even on lower emissions pathways. Analysis estimates 5% and 6% declines in global wheat and maize yields
respectively even if the Paris Climate Agreement is met and warming is limited to 1.5°C.51 Shifts in the optimal
and viable spatial ranges of certain crops are also inevitable, though the extent and speed of those shifts remains
dependent on the emissions pathway.
A further, and perhaps lesser appreciated influence of climate change on agricultural production is through its
impact on the health and productivity of the labor force. Study suggests that labor productivity during peak months
has already dropped by 10% as a result of warming, and that a decline of up to 20% might be expected by 2050
under the highest emissions pathway (RCP8.5).52 Research focused on laborers in Da Nang has shown the high
likelihood that by 2050 temperatures will regularly exceed thermal comfort levels set by the Vietnamese Ministry
of Health,53 an issue which will likely impact several million laborers in agriculture and other industries around
Vietnam. In combination, it is highly likely that the above processes will have a considerable impact on national food
consumption patterns both through direct impacts on internal agricultural operations, and through impacts on the
global supply chain.
Rice is perhaps the most important crop in Vietnam’s agricultural sector. About 52% of paddy rice production is from
the Mekong River Delta: 82 percent of the summer autumn rice is produced in the Mekong River Delta, and another
18 percent in the Red River Delta. Other important rice-growing regions are the North-East and the North-Central
Coast. In most zones, irrigated rice is cultivated in two to three crops per year. The continued rise in rice production
is largely due to improved irrigation, new rice varieties, new rice technologies, and increased triple cropping in the
Mekong River Delta. Development has involved increasing control over natural hydrological processes and has
involved water and land management trade-offs which have at times disadvantaged poorer groups.54 Notably, the
average size of farms remains very small, even in Vietnam’s most productive regions, at around 1ha.55
Climate change threatens multiple stressors on rice production, including high temperatures (particularly during
development stages), saline intrusion, drought, and flood (crop submergence). However, some of these negative
51
Tebaldi, C., & Lobell, D. (2018). Differences, or lack thereof, in wheat and maize yields under three low-warming scenarios.
Environmental Research Letters: 13: 065001
52
Dunne, J. P., Stouffer, R. J., & John, J. G. (2013). Reductions in labour capacity from heat stress under climate warming. Nature
Climate Change, 3(6), 563–566
53
Opitz-Stapleton, S., Sabbag, L., Hawley, K., Tran, P., Hoang, L., & Nguyen, P. H. (2016). Heat index trends and climate change
implications for occupational heat exposure in Da Nang, Vietnam. Climate Services, 2–3, 41–51.
54
Chapman, A., & Darby, S. (2016). Evaluating sustainable adaptation strategies for vulnerable mega-deltas using system dynamics
modelling: Rice agriculture in the Mekong Delta’s An Giang Province, Vietnam. Science of the Total Environment. 559: 326–338
55
USAID/UNDP (2016) Economics of climate change adaptation: Agriculture sector analysis for Viet Nam. USAID Climate Change
Adaptation Project Preparation Facility for Asian and the Pacific/United Nations Development Programme
CLIMATE RISK COUNTRY PROFILE — VIETNAM 18impacts may be partially offset by the benefits of increased atmospheric CO2 concentrations. Study56 suggests
that climate change may damage rice yields in the Mekong River Delta in the long term. The outlook reported
for rain-fed rice is particularly poor across all time horizons with yield declines potentially over 50% on higher
emissions pathways by 2040. Irrigated rice fares better in the shorter-term showing some yield improvements up
to 2030. By the 2040s irrigated rice could also be facing yield reductions of up to 23% under higher emissions
pathways. Another analysis57 estimates the net impact of climate change on rice yields (including CO2 gains)
across all of Vietnam and also suggests losses can be expected, at 5–10% by 2040, with similar values under
both RCPs 4.5 and 8.5. It suggests there is a possibility that adaptations, such as changes to planting dates, may
be sufficient to mitigate these losses. Further research and analysis is required to better understand the impact
this would have on the viability of growing three rice crops in a year, a development that has dramatically increased
Vietnam’s rice production in recent years.
Maize is the second most important food crop
substituting as a staple good in periods of rice
shortage, especially for people in rural areas and
FIGURE 12. Annual average number of
mountainous regions. Maize is also the primary
hot days (T>35°C) under RCP2.6 (Blue)
source of feed for Vietnam’s poultry and livestock
and RCP8.5 (Red). The values shown
industry and is therefore an important source of
represents the median of 30+ GCM model
income for many farmers. The outlook for maize
ensemble with the shaded areas showing the
production is also poor due to its sensitivity to high
10–90th percentiles.60
temperatures (Figure 12). Concerns have also been
raised regarding potential future climate stressors
affecting cash crops grown in Vietnam’s Central
Highlands region, notably tea, coffee, pepper and
rubber. In 2016, USAID and UNDP particularly
identify the risk that runoff will decline negatively
affecting yields.58 Another key crop also projected
to experience production declines resulting from
climate change is coffee. A study in 2015 projects
that many key coffees growing areas of Vietnam’s
central highlands will become unsuitable for coffee
under the RCP6.0 emissions pathway.59
56
Jiang, Z., Raghavan, S. V., Hur, J., Sun, Y., Liong, S.-Y., Nguyen, V. Q., & Van Pham Dang, T. (2018). Future changes in rice yields over
the Mekong River Delta due to climate change—Alarming or alerting? Theoretical and Applied Climatology
57
Li, S., Wang, Q., & Chun, J. A. (2017). Impact assessment of climate change on rice productivity in the Indochinese Peninsula using a
regional-scale crop model. International Journal of Climatology, 37(April), 1147–1160.
58
USAID/UNDP (2016) Economics of climate change adaptation: Agriculture sector analysis for Viet Nam. USAID Climate Change
Adaptation Project Preparation Facility for Asian and the Pacific/United Nations Development Programme
59
Bunn, C., Läderach, P., Ovalle Rivera, O., & Kirschke, D. (2015). A bitter cup: climate change profile of global production of Arabica
and Robusta coffee. Climatic Change, 129(1), 89–101
60
World Bank Climate Change Knowledge Portal (2018). Climate by Sector: Interactive Climate Indicator Dashboard. URL: https://
climateportal.worldbank.org.
CLIMATE RISK COUNTRY PROFILE — VIETNAM 19Urban and Energy
Research has established a reasonably well constrained relationship between heat stress and labor productivity,
household consumption patterns, and (by proxy) household living standards.61 In general terms the impact of
an increase in temperature on these indicators depends on whether the temperature rise moves the ambient
temperature closer to, or further away from, the optimum temperature range. The optimum range can vary
depending on local conditions and adaptations but with a monthly average maximum temperature of 28°C it is
inevitable that increases in temperature will have a negative influence on outdoor thermal comfort and hence
labor productivity and health in Vietnam. The Vietnam Ministry of Health sets a threshold of 28°C as a maximum
for safe heavy labor.62
The effects of temperature rise and heat stress in urban areas are increasingly compounded by the phenomenon
of Urban Heat Island (UHI), wvhich has been documented in urban conurbations around the world. Hard surfaces,
residential and industrial sources of heat, and air pollution63 can push temperatures higher than those of the rural
surroundings, commonly anywhere in the range of 0.1–3°C in global mega-cities.64 Studies suggest Ho Chi Minh
City experiences around 0.5–0.8°C of urban heat island.65 As well as impacting on human health (see Impacts on
Communities) the temperature peaks that will result from combined UHI and climate change, as well as future
urban expansion, are likely to damage the productivity of the service sector economy, both through direct impacts
on labor productivity, but also through the additional costs of adaptation.
Research suggests that on average a one degree increase in ambient temperature can result in a
0.5–8.5% increase in electricity demand.66 Notably this serves business and residential air cooling systems.
This increase in demand places strain on energy generation systems which is compounded by the heat stress
on the energy generation system itself, commonly due to its own cooling requirements, which can reduce its
efficiency.67
Projections show a potential increase in average monthly maximum temperatures under high emissions pathways
to over 40°C in Vietnam. Such increases will place extreme pressure on densely urbanized areas, amplified by
the urban heat island affect. As shown in Figure 13 the cooling necessary to maintain buildings at a suitable
temperature for safe and productive living and working will increase considerably under higher emissions pathways.
Secondary consequences of this are first to place pressure on energy supply, and second to penalize poorer and
marginalized groups unable to access energy for cooling.
61
Mani, M., Bandyopadhyay, S., Chonabayashi, S., Markandya, A., Mosier, T. (2018) South Asia’s Hotspots: The Impact of Temperature
and Precipitation changes on living standards. South Asian Development Matters. World Bank, Washington DC.
62
Opitz-Stapleton, S., Sabbag, L., Hawley, K., Tran, P., Hoang, L., & Nguyen, P. H. (2016). Heat index trends and climate change
implications for occupational heat exposure in Da Nang, Vietnam. Climate Services, 2–3, 41–51.
63
Cao, C., Lee, X., Liu, S., Schultz, N., Xiao, W., Zhang, M., & Zhao, L. (2016). Urban heat islands in China enhanced by haze pollution.
Nature Communications, 7, 1–7
64
Zhou, D., Zhao, S., Liu, S., Zhang, L., & Zhu, C. (2014). Surface urban heat island in China’s 32 major cities: Spatial patterns and
drivers. Remote Sensing of Environment, 152, 51–61
65
Doan, V.Q. and Kusaka, H. 2018. Projections of urban climate in the 2050s in a fast-growing city in Southeast Asia: The greater
Ho Chi Minh City metropolitan area, Vietnam. International Journal of Climatology, 38, 4155–4171.
66
Santamouris, M., Cartalis, C., Synnefa, A., & Kolokotsa, D. (2015). On the impact of urban heat island and global warming on the
power demand and electricity consumption of buildings—A review. Energy and Buildings, 98, 119–124
67
ADB (2017) Climate Change Profile of Pakistan. Asian Development Bank
CLIMATE RISK COUNTRY PROFILE — VIETNAM 20You can also read