SIXTH INTERPROVINCIAL BRIDGE CROSSING STUDY REFRESH - NATIONAL CAPITAL COMMISSION - Amazon AWS
←
→
Page content transcription
If your browser does not render page correctly, please read the page content below
NATIONAL CAPITAL COMMISSION

SIXTH INTERPROVINCIAL BRIDGE
  CROSSING STUDY REFRESH
           Summary Report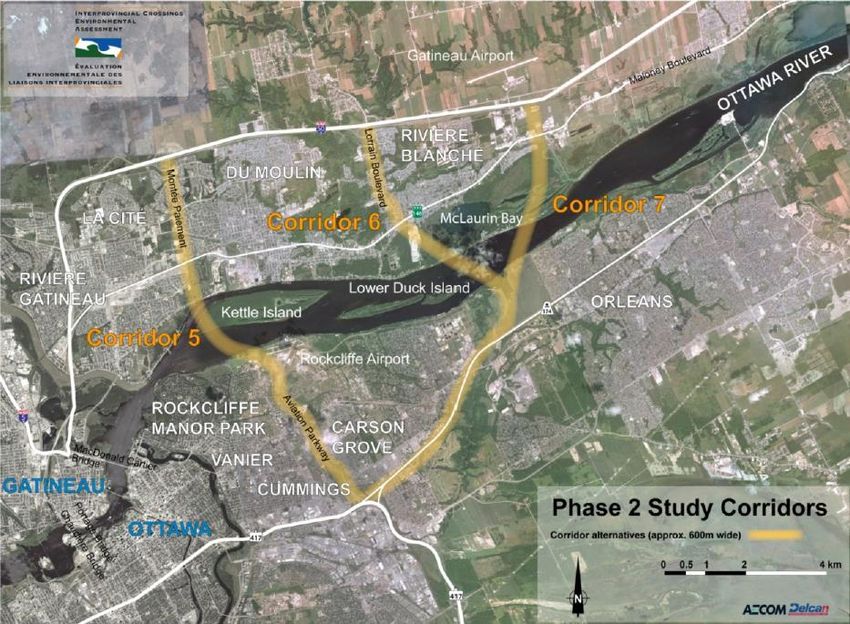
SIXTH
INTERPROVINCIAL
BRIDGE CROSSING
STUDY REFRESH
Summary Report

NATIONAL CAPITAL COMMISSION

V5

PROJECT NO.: 19M-01103-00
DATE: APRIL 8, 2020

WSP
SUITE 300
2611 QUEENSVIEW DRIVE
OTTAWA, ON, CANADA K2B 8K2

T: +1 613 829-2800
F: +1 613 829-8299
WSP.COM
TABLE OF
CONTENTS                                              1     INTRODUCTION ................................................. 1
                                                      1.1   Background........................................................................ 2

                                                      2     NOISE & VIBRATION REPORT.......................... 3
                                                      2.1   Conclusions from Previous Report ................................. 3
                                                      2.2   Methodology for Refresh .................................................. 4
                                                      2.3   What has Changed ............................................................ 5
                                                      2.4   Potential Impacts Due to Change .................................... 5

                                                      3     LAND USE AND PROPERTY REPORT ............. 6
                                                      3.1   Conclusions from Previous Report ................................. 6
                                                      3.2   Methodology for Refresh .................................................. 6
                                                      3.3   What has Changed ............................................................ 7
                                                      3.4   Potential Impacts Due to Change .................................... 8

                                                      4     AIR QUALITY REPORT .................................... 10
                                                      4.1   Conclusions From Previous Report .............................. 10
                                                      4.2   Methodology for Refresh ................................................ 10
                                                      4.3   What has Changed .......................................................... 10
                                                      4.4   Potential Impacts Due to Change .................................. 12

                                                      5     FISHERIES AND AQUATIC HABITAT REPORT
                                                            .......................................................................... 13
                                                      5.1   Conclusions From Previous Report .............................. 13
                                                      5.2   Methodology for Refresh ................................................ 13
                                                      5.3   What has Changed .......................................................... 13
                                                      5.4   Potential Impacts Due To Change ................................. 14

                                                      6     TRANSPORTATION REPORT ......................... 15
                                                      6.1   Conclusions from Previous Report ............................... 15
                                                      6.2   Methodology for Refresh ................................................ 16

Sixth Interprovincial Bridge Crossing Study Refresh                                                                                               WSP
19M-01103-00                                                                                                                                April 2020
National Capital Commission                                                                                                                   Page i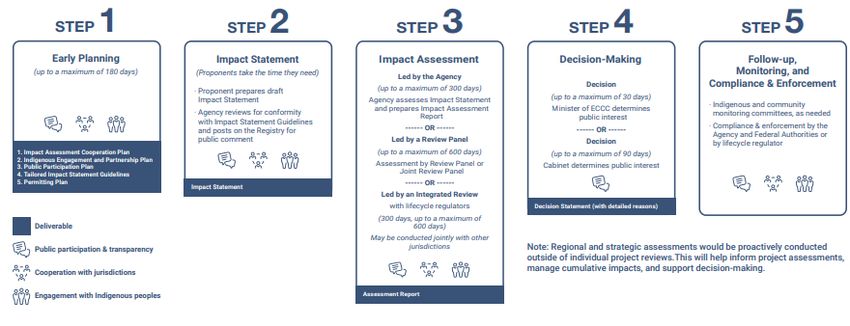
6.3      What has Changed .......................................................... 17
                                                      6.4      Potential Impacts Due To Change ................................. 18

                                                      7        INDIGENOUS HISTORY REPORT ................... 19
                                                      7.1      Conclusions from Previous Report ............................... 19
                                                      7.2      Methodology for Refresh ................................................ 19
                                                      7.3      What has Changed .......................................................... 19
                                                      7.4      Potential Impacts Due To Change ................................. 19

                                                      8        ECONOMIC DEVELOPMENT POTENTIAL
                                                               STUDY .............................................................. 20
                                                      8.1      Conclusions from Previous Report ............................... 20
                                                      8.2      Methodology for Refresh ................................................ 20
                                                      8.3      What has Changed .......................................................... 21
                                                      8.4      Potential Impacts Due to Change .................................. 21

                                                      9        NATURAL ENVIRONMENT EXISTING
                                                               CONDITIONS UPDATE & ADDENDUM ........... 22
                                                      9.1      Conclusions from Previous Report ............................... 22
                                                      9.2      Methodology for Refresh ................................................ 22
                                                      9.3      What has Changed .......................................................... 22
                                                      9.4      Potential Impacts Due to Change .................................. 23

                                                      10       NEXT STEPS .................................................... 24
                                                      10.1     Application of the Impact Assessment Act .................. 24
                                                      10.2     Prior to Commencing the Impact Assessment ............ 24
                                                      10.2.1   Key Steps Prior to an Impact Assessment ................................................ 25

                                                      10.3     Overall IAA Process ........................................................ 26
                                                      10.3.1   Planning ....................................................................................................... 26
                                                      10.3.2   Impact Statement ........................................................................................ 27
                                                      10.3.3   Impact Assessment ..................................................................................... 27
                                                      10.3.4   Decision-making .......................................................................................... 27
                                                      10.3.5   Post-decision ............................................................................................... 27

                                                      10.4     Impact Assessment Studies ........................................... 28
                                                      10.4.1   Biophysical Environment............................................................................. 28

Sixth Interprovincial Bridge Crossing Study Refresh                                                                                                                                WSP
19M-01103-00                                                                                                                                                                 April 2020
National Capital Commission                                                                                                                                                     Page ii
10.4.2 Human Health .............................................................................................. 32
10.4.3 Social / Cultural ........................................................................................... 32
10.4.4 Economic ..................................................................................................... 33
10.4.5 Indigenous Peoples ..................................................................................... 34
TABLES
TABLE 2-1: RECEPTORS TO BE CONSIDERED FOR
MITIGATION ............................................................. 3
TABLE 2-2: RECEPTORS WITH 250M RADIUS FROM BRIDGE
EDGE MEETING WITH LAND .................................. 3
TABLE 2-3: ANALYSIS SUMMARY .............................................. 5
TABLE 3-1: POTENTIAL LANDS IMPACTED BY LAND USE
TYPE ......................................................................... 7
TABLE 4-1: CHANGES TO EMISSION RATES ......................... 11
TABLE 4-2: CHANGES TO GHG EMISSION ESTIMATES........ 12
TABLE 4-3: SUMMARY OF CHANGES IN PM2.5
CONCENTRATION ESTIMATES ........................... 12
TABLE 8-1: EMPLOYMENT DENSITY RATIO ........................... 21
TABLE 8-2: POTENTIAL NUMBER OF NEW JOBS .................. 21
FIGURES
FIGURE 1-1: PHASE 2 STUDY CORRIDORS (ENVIRONMENTAL
ASSESSMENT STUDY REPORT, 2010) ................. 1
FIGURE 10-1: KEY STEPS PRIOR TO AN IMPACT ASSESSMENT
26
FIGURE 10-2: IMPACT ASSESSMENT PROCESS ...................... 28
Sixth Interprovincial Bridge Crossing Study Refresh WSP
19M-01103-00 April 2020
National Capital Commission Page iii1 INTRODUCTION The National Capital Commission is investigating the potential for a sixth interprovincial bridge crossing to provide a link between the City of Ottawa, Ontario and the Ville de Gatineau, Quebec. WSP was retained to carry out a refresh of the environmental and technical study reports supporting Phase 2B of the 2013 Interprovincial Crossings Environmental Assessment. The update looks at the three crossing locations that received the highest potential: Kettle Island (Corridor 5), Lower Duck Island (Corridor 6), and McLaurin Bay (Corridor 7), as shown in Figure 1-1. The assignment covers the following disciplines: Noise & Vibration, Land Use, Air Quality, Fisheries & Aquatic Habitat, Transportation, Indigenous History, Economic Development Potential, and Natural Environment. Figure 1-1: Phase 2 Study Corridors (Environmental Assessment Study Report, 2010) The intent of this summary is not to provide a recommended corridor. Rather, it provides an overview of existing conditions within the study area, identifies baseline information and key changes that can potentially affect the 2013 findings, conclusions and recommendation directions that will assist the City in the preparation of future planning for this area. In addition, this report highlights what further studies would be required should this project proceed to the next phase of a Federal EA. Sixth Interprovincial Bridge Crossing Study Refresh WSP 19M-01103-00 April 2020 National Capital Commission Page 1
1.1 BACKGROUND
A funding partnership of the National Capital Commission, Ontario Ministry of Transportation and
Ministère des Transports du Québec, forming a Steering Committee, launched an Environmental
Assessment in 2006 to assess potential interprovincial crossing alternatives and their associated approach
corridors. The City of Ottawa and Ville de Gatineau formed part of the Study Team with the Steering
Committee who guided the project. The proposed new river crossing supported long-term transportation
objectives and planned growth within the National Capital Region, was intended to support an enhanced
cultural and social connection between communities as well as commercial linkages. The first phase of the
project, completed in 2009, included a review of the need and justification of the crossing as well as, the
evaluation of many initial crossing locations from the east to west limits of the Region. Three eastern sector
corridors were identified as having potential and recommended for more detailed assessment.
The second phase of the project focused on the analysis and evaluation of the three locations which had
received the highest ratings from Phase 1: Kettle Island (Corridor 5), Lower Duck Island (Corridor 6) and
Gatineau Airport/McLaurin Bay (Corridor 7) and included the detailed assessment and evaluation of an
extensive number of environmental, design and transportation specialties. At the completion of the Analysis
and Evaluation Tasks, the recommended corridor was presented to communities, stakeholders and members
of the public. Following the public consultation, the Steering Committee elected to abandon the Study in
2013.
As part of the evaluation and assessment of the three short-listed corridors, individual reports focused on
specific elements that may be impacted by a proposed new crossing were prepared documenting the process
and findings. For this Interprovincial Phase 2B Refresh being carried out in the current study, the NCC
identified nine (9) reports to update so as to reflect potential changes in the time that has elapsed since the
previous study was terminated before formal completion. It is noted that the Natural Environment Existing
Conditions Report and Addendum which counted as two separate reports in the Terms of Reference, are
being updated as one report. The following sections summarize the updates on these eight (8)
factors/reports. This includes, but is not limited to, potential new species at risk, changes in Indigenous
Protocol, changes in future long-term population and employment projections and the latest available
origin-destination (O-D) survey data.

Sixth Interprovincial Bridge Crossing Study Refresh                                                              WSP
19M-01103-00                                                                                               April 2020
National Capital Commission                                                                                  Page 2
2 NOISE & VIBRATION REPORT

2.1 CONCLUSIONS FROM PREVIOUS REPORT
The results from the Noise and Vibration Assessment Report, dated April 2013, which was completed as
part of the Environmental Assessment (EA) process for Phase 2B of the Interprovincial Crossings indicated
that for the noise assessment 32 receptors out of a total of 109 receptors in Corridor 5 would experience
more than 6 dBA noise level increase for 2031 "With Bridge" scenario compared to 2031 "Without Bridge"
scenario, while 8 receptors out of a total of 76 receptors in Corridor 6 and 0 receptors out of a total of 30
receptors in Corridor 7 would be similarly impacted.
Two different criteria were considered when determining whether a receptor may require mitigation:
   i.     The sound level is equal to or exceeds 65 dBA at the receptor in the 2031 “With Bridge” scenario;
          and
  ii.     The change in sound level from 2031 “Without Bridge” to 2031 “With Bridge” exceeds 3 dBA at
          the receptor.
Table 2-1 below summarizes the number of receptors that do not meet the above criteria when considering
equivalent sound level over a 16-hour period during the daytime (Leq 16 hr):
Table 2-1:       Receptors to be Considered for Mitigation

                                                                                Receptors

               Mitigation Requirement Criteria                CORRIDOR 5       CORRIDOR 6       CORRIDOR 7

≥ 65 dBA (Leq day 16hr)
                                                                     0               11               5

> 3 dBA (Leq day 16hr)                                              49               20               0
Total receptors to be considered for mitigation                     49               31               5
Percent of receptors requiring mitigation per corridor            45.0%            37.3%           14.3%
Percent of receptors requiring mitigation in corridor
                                                                 46.54%           38.67%           14.79%
compared to total receptors between all corridors

As shown in the above table, the 2013 report identified that the total number of receptors requiring
mitigation is highest in Corridor 5, followed by Corridor 6 and then by Corridor 7.
Table 2-2 below presents the number of receptors which may have the potential of being affected by
vibration of the heavy vehicle traffic on the bridge.
Table 2-2:       Receptors with 250m Radius from Bridge Edge Meeting with Land

    Corridor               No. of Affected Receptors                          Comments
Corridor 5           Two (2) Residential housing units:   Although these receptors are within the 250m circle
                     - R53 at 130 metres                  if vibration influence, they may not be affected as
                     - R54 at 170 metres                  there are no imperfections in the roads and smooth
                                                          flow of heavy vehicles is ensured.

Sixth Interprovincial Bridge Crossing Study Refresh                                                               WSP
19M-01103-00                                                                                                April 2020
National Capital Commission                                                                                   Page 3
Corridor No. of Affected Receptors Comments
Corridor 6 None --
Corridor 7 None There is a Receptor R30 which will need to be
removed if this corridor is chosen for the bridge
2.2 METHODOLOGY FOR REFRESH
WSP has revised the methodology for noise assessment from the original 2013 Report to remain consistent
with the previous usage of ORNAMENT/STAMSON while also accounting for the complexity of the
terrain and road traffic within each of the proposed corridors.
Modelling of future acoustic scenarios was achieved by inputting the following parameters into the
appropriate noise modelling software:
— Vehicle speeds;
— Road traffic volumes;
— Percentage of heavy trucks/medium trucks/automobiles;
— Horizontal and vertical road receiver geometry;
— Ground absorption; and
— Screening provided by terrain, houses, or existing barriers.
The two noise modelling programs to be used in the analysis of both Ontario and Quebec roads are
STAMSON, which implements the ORNAMENT calculation method, and CADNA/A, which uses the
TNM algorithm. The MTO’s “Environmental Guide for Noise” document approves of the use of the
ORNAMENT algorithm for predicting road traffic impacts, and the usage of other traffic noise prediction
models where complex studies require.
To establish the predicted future sound levels within each of the corridors, an alternate modelling method
utilizing the CADNA/A noise propagation model was used. The purpose of using CADNA/A software was
to allow for greater flexibility in modelling the complex road geometry present within the study area, as
well as, to overcome the limitations identified with the traditional calculation and measurement
methodology.
The following steps were taken to create a predictive model for the study area in CADNA/A that meets the
MTO objectives and allows for quantitatively determining the sound levels due to road traffic:
1. The Cadna/A model was calibrated using STAMSON predictions. For the calibration purposes
reference points were selected at a distance of 15 metres, 30metres and 100 metres from the edge
of the pavement of each road segment in each corridor;
2. Estimated future predicted traffic data was obtained from traffic specialists for the Interprovincial
Bridge Project;
3. The sound levels at the reference points were estimated using the STAMSON software;
4. The sound level at the reference points were re-estimated using CADNA/A software;
5. Results were compared between both models, and the prediction confidence of the CADNA/A
method being determined; and
6. After the prediction confidence was established, the CADNA/A model was used to calculate the
future condition sound levels within the study area for each corridor for the future ambient (i.e.
without bridge) and project (i.e. with bridge) scenarios.
In areas where significant noise impacts were calculated, mitigation measures to lower the noise levels
produced by traffic were simulated in the model (noise barrier or mound). A sound impact is considered
Sixth Interprovincial Bridge Crossing Study Refresh WSP
19M-01103-00 April 2020
National Capital Commission Page 4significant when the variation between the sound level of the existing situation (without the project) and
the projected sound level (with the project) will have a medium or strong impact.
Significant vibration impacts at the nearby vibration sensitive receptors due to the project is not expected.
2.3 WHAT HAS CHANGED
The results of the revised Noise and Vibration Assessment are summarised in Table 2-3 below.
Table 2-3: Analysis Summary
Description Corridor 5 Corridor 6 Corridor 7 Mitigation
Required?
Overall sound Level (dBA) – Criteria: 65 dBA
SPL < 65 dBA 44 24 10 No
SPL > 65 dBA 18 10 9 Yes
Overall sound level (dBA): Criteria Δ > 5 dbA
Δ < 5 dbA 39 31 19 No
Δ > 5 dbA 23 3 0 Yes
Summary of Mitigation
No of NSA 46 14 9 -
% NSA 74% 41% 47% -
Estimated cost of mitigation ($) $253,702 $149,567 $29,793 -
Average cost per benefitted NSA $2,371 $13,597 $4,966 -
2.4 POTENTIAL IMPACTS DUE TO CHANGE
The results of the revised Noise and Vibration Analysis are generally consistent with the previously drawn
conclusions. The highest number of receptors requiring mitigation will be in Corridor 5, followed by
Corridor 6, then Corridor 7.
The investigation showed that all three corridors are feasible to be operated in compliance with the noise
and vibration criteria with noise control. In addition, majority of the receptors in Corridor 7 that require
mitigation already have current noise barriers installed.
Sixth Interprovincial Bridge Crossing Study Refresh WSP
19M-01103-00 April 2020
National Capital Commission Page 53 LAND USE AND PROPERTY REPORT
3.1 CONCLUSIONS FROM PREVIOUS REPORT
The 2013 Land Use and Property Report summarizes existing land uses and policies for the three
Corridors, as well as, anticipated impacts to property. The anticipated impacts to land use and property by
each of the corridors includes the following high-level impacts:
Corridor 5: Number of properties impacted: 104.
Total area of properties impacted: 32.1 ha.
Corridor 6: Number of properties impacted: 189.
Total area of properties impacted: 58.32 ha.
Corridor 7: Number of properties impacted: 16.
Total area of properties impacted: 92.79 ha.
The Corridor which impacts the greatest number of people is Corridor 6, followed by Corridor 5 and then
Corridor 7. Although Corridor 7 impacts the least number of land parcels it has the largest area of impact,
with Corridor 5 having the least area of impact and a moderate number of land parcels. Furthermore,
Corridor 5 is more in compliance with Official Plans on the Gatineau side, both because it does not
introduce as much urban sprawl and because it is not included within an MRN projet de refuge faunique.
3.2 METHODOLOGY FOR REFRESH
The methodology for the refresh of the Land Use and Property Report included identifying the 2013
resources used in the initial study and reviewing the resources to determine what updates (if any) had been
made to land use plans and policies since 2013. These updated plans and polices were used to bring up to
date the written component of the report. A list of updated resources included:
— The City of Gatineau’s Land Use and Development Plan (2050-2016), Strategic Plan, Planning
Program (500-2005), Zoning By-law (502-2005);
— Plan d'affectation de l'Outaouais du territoire public of the ministère des Ressources naturelles et de
la faune (MRNF) du Québec;
— Agricultural zone plans from the Québec Agricultural Land Protection Commission;
— The City of Ottawa’s Official Plan and Greenspace Master Plan;
— The NCC’s Greenbelt Master Plan;
— Ontario Ministry of Agriculture, Food, and Rural Affairs and Agriculture and Agri-Food Canada- Soil
Surveys from the Province of Ontario; and
— A City of Gatineau / City of Ottawa site visit conducted during the summer of 2019 to confirm existing
land use data provided by both municipalities.
The following data was used to develop supporting mapping. All figures throughout the updated report
have been revised to reflect current available data or to provide consistency in presentation:
— Study Area Corridors and Greenbelt Master Plan data from the NCC;
— Ontario Ministry of Agriculture, Food, and Rural Affairs and Agriculture and Agri-Food Canada- Soil
Surveys data from the Province of Ontario (obtained online);
Sixth Interprovincial Bridge Crossing Study Refresh WSP
19M-01103-00 April 2020
National Capital Commission Page 6— Official Plan, Zoning By-law, Greenspace Master Plan, and existing land use (2016) data from the City
of Ottawa;
— Zoning By-law, Development Activity, and existing land use (2019) data from the City of Gatineau;
— Within the City of Ottawa, a combination of WSP’s in-house PRIME for Cities database and the City’s
Development Application Search Tool was used to identify development activity within the study areas
at the time of writing this report; and
— GeoOttawa was used to confirm utilities in the City of Ottawa.
As was done for the 2013 report, each corridor was evaluated based on anticipated property impacts.
Property impacts are characterized in terms of the total area (in hectares) of a specific land use type
impacted, based on updated existing land use mapping provided by the City of Ottawa and the City of
Gatineau. Property impacts are also characterized by number of properties impacted by land use type, based
on property fabric data. The latest available alignment information was used to determine the area and
number of properties impacted. Impact in this context means that a specific land use type or property is
within the footprint of the alignment, either fully or in part.
3.3 WHAT HAS CHANGED
The Land Use and Property Report has been updated throughout to be as current as possible, given that
updates to policy and new development in Ottawa and Gatineau have occurred since 2013.
High-level property impacts, characterized in terms of the total land area (in hectares) and number of
properties impacted for each corridor, are summarized in comparison to the 2013 report results below.
Corridor 5: Total land area impacted: 53.33 ha as compared to 32.1 ha.
Total number of properties impacted: 1731 as compared to 104.
Corridor 6: Total land area impacted: 36.84 ha as compared to 58.32 ha.
Total number of properties impacted: 2272 as compared to 189.
Corridor 7: Total land area impacted: 46.29 ha as compared to 92.79 ha.
Total number of properties impacted: 543 as compared to 16.
The following table provides a more detailed summary of land area impacts by various land use types.
Table 3-1: Potential Lands Impacted by Land Use Type
AREAS OF LANDS IMPACTED (ha)
EXISTING LAND USE CORRIDOR 5 CORRIDOR 6 CORRIDOR 7
City of Gatineau
Residential 0.80 8.82 0.18
Manufacturing Industrial 0.14 4.21 0.35
Commercial 1.18 1.09 1.35
Institutional and Services 0.90 0.06 N/A
Recreation 7.22 0.47 2.44
1 Impacted properties larger than .001 ha: 152
2 Impacted properties larger than .001 ha: 211
3 Impacted properties larger than .001 ha: 51
Sixth Interprovincial Bridge Crossing Study Refresh WSP
19M-01103-00 April 2020
National Capital Commission Page 7AREAS OF LANDS IMPACTED (ha)
EXISTING LAND USE CORRIDOR 5 CORRIDOR 6 CORRIDOR 7
Natural Resources Industry 0.004 N/A 0.69
Vacant Land 2.86 1.01 17.18
City of Ottawa
Active Recreation 1.98 N/A N/A
Agriculture N/A 3.51 11.59
Forest N/A 1.18 0.04
Hospital, Rehabilitation, Nursing Home 0.08 N/A N/A
Idle and Shrub land N/A 2.79 0.56
Industrial N/A 0.04 0.04
Industrial Condominium N/A 0.02 0.02
Office 0.0 0.16 0.16
Other Commercial 0.02 N/A N/A
Other Institution 22.32 0.50 0.50
Open Space 3.90 9.74 9.84
Single-detached Residential 0.05 N/A N/A
Passive Recreation 13.20 3.24 1.35
Utility – Major Hydro Corridor or ROW 0.09 N/A N/A
Vacant Land 0.52 N/A N/A
The Corridor which impacts the greatest total land area is Corridor 5, followed by Corridor 7, then Corridor
6. However, Corridor 6 impacts the greatest number of unique properties, followed by Corridor 5, then
Corridor 7.
3.4 POTENTIAL IMPACTS DUE TO CHANGE
The potential land area and number of properties impacted for each of the three Corridors has changed
between the 2013 report and the 2019 report refresh. This is potentially due to differences in methodologies
used and inconsistent application of methodologies in the 2013 report; based on a review of mapping in the
2013 report, it appears that different thresholds were used in determining impacted properties .
Corridor 5 impacts the greatest potential land area in the 2019 refresh, followed by Corridor 7, then Corridor
6. This is inconsistent with the 2013 report. In 2013, Corridor 7 impacts the greatest potential land area,
followed by Corridor 6, then Corridor 5. Compared to the 2013 report, total lands impacted as an evaluation
criterion would therefore have some impact on the overall evaluation of alternatives; however, this would
be one consideration among numerous other environmental and technical factors. Although the number of
properties impacted has changed since the 2013 report, the Corridors rank exactly the same. In both the
2013 report and the 2019 refresh, Corridor 6 impacts the highest number of properties followed by Corridor
5 then Corridor 7. However, an analysis based on a more granular level of detail would likely yield a more
accurate reflection of specific property impacts. It is suggested that this level of detail will be required
during an impact assessment study, to determine the precise property impacts associated with the preferred
4 Area of Lands Impacted are rounded to the nearest hundredth decimal place.
Sixth Interprovincial Bridge Crossing Study Refresh WSP
19M-01103-00 April 2020
National Capital Commission Page 8corridor. Furthermore, as the design of the project continues to evolve from preliminary to detailed design, it is possible that property requirements may change, including full and partial requirements, and also permanent and temporary requirements for activities such as construction staging and laydown areas. Sixth Interprovincial Bridge Crossing Study Refresh WSP 19M-01103-00 April 2020 National Capital Commission Page 9
4 AIR QUALITY REPORT
4.1 CONCLUSIONS FROM PREVIOUS REPORT
Results from the Air Quality Report dated April 2013 (2013 Air Quality Report), which was completed
as part of the Environmental Assessment (EA) process for Phase 2B of the Interprovincial Crossings,
indicated that the lowest concentrations of the grid of receptors were almost always observed in Corridor
5. In residential areas of both Quebec and Ontario, the lowest concentrations were also observed along
Corridor 5. The concentrations in Ontario residential areas close to Corridor 7 were of similar magnitude
to those of Corridor 6. In residential areas in Quebec, the concentrations resulting from traffic were similar
for Corridors 5 and 7. Of the three corridors, concentrations near Corridor 6 were of the largest in
magnitude. The concentrations around Corridor 5 were estimated to have the highest relative increase, with
additional traffic in the north-south direction in comparison to Corridors 6 and 7; however, concentrations
were to remain lower for Corridor 5 than Corridors 6 and 7. Emissions of pollutants were lower for Corridor
5 including those for greenhouse gases (GHG) than for the remaining Corridors. Corridor 7 emissions were
also lower than Corridor 6. Overall, the preferred corridor in terms of impact to air quality was Corridor 5.

4.2 METHODOLOGY FOR REFRESH
WSP has reviewed the existing documentation from the 2013 Air Quality Report and has revised the report
to account for regulatory changes and modelling advancements that have occurred since the last study was
completed in 2013.
New meteorological data and ambient air concentrations were obtained, and the existing conditions were
updated to account for the latest data available. Once the annual average daily traffic (volumes) for each
corridor and traffic data as a function of hour of the day and day of the week data were obtained for the
future scenario, modelling was completed to revise the air quality impacts assessment. The revised impacts
were predicted using dispersion modelling. The United States Environmental Protection Agency’s (US
EPA) Motor Vehicle Emission Simulator (MOVES) was used to estimate the emission and the dispersion
modelling was conducted using the US EPA AERMOD. The revised study includes the contaminants that
were assessed as part of the 2013 Air Quality Report.
The revised air quality impact assessment followed the assessment framework presented in the
Environmental Guide for Assessing and Mitigating the Air Quality Impacts and Greenhouse Gas Emissions
of Provincial Transportation Projects (Guide) (June 2012, Ontario Ministry of Transportation (MTO)). This
approach is also consistent with the approach used in the original assessment. Results of the assessment
were presented in the revised Air Quality Report (October 2019).

4.3 WHAT HAS CHANGED
The revised Air Quality assessment was completed using the update traffic data from the TRANS model,
and update receptors to represent sensitive receptors along each corridor. The changes in methodology
account for the rest of the changes and include regulatory changes and modelling advancements that have
occurred since the original report was published in 2013. These are the use of the MOVES model to predict
emission rates, and the AERMOD model for dispersion modeling. The updates to the methodology did not
alter the overall outcome of the assessment, however, the magnitude of the emissions.

Sixth Interprovincial Bridge Crossing Study Refresh                                                             WSP
19M-01103-00                                                                                              April 2020
National Capital Commission                                                                                Page 10
In the previous version of this report, emission factors were estimated using the on roads vehicles source
emission factor model, MOBILE6.2C, the Canadian adaptation of the MOBILE6.2 model 5. In this refresh
report, the US EPA’s state-of-the-science motor vehicle emission simulator (MOVES) was used to estimate
emission rates6. Differences in emission estimates between the previous report and this refresh can be
partially attributed to this change in model. The MOBILE6.2C model has not been updated since 2003 and
as such, has its own limitations. Although the emission factor estimates from MOBILE6.2C are still
reasonable, differences in these estimates are largely due to technological advances in emission control
systems and new calculation methods for vehicle deterioration that are not accounted for in the
MOBILE6.2C model (MOBILE6.2C assumes deterioration with is linear; however, MOVES has an
updated methodology to address this limitation)1. For example, in the previous report, a composite emission
rate for CO of 5.578 g/km was used; however, a value of 0.936 g/km was predicted for 2031 using the
MOVES model. When the MOBILE6.2 model was developed, there was little information available on
heavy-duty diesel crankcase evaporation and extended idling. With data from the past decade, the MOVES
model was updated to contain more representative information and processes (Federal Highway
Administration travel data, EPA studies, vehicle surveys conducted by the census bureau, etc.), replacing
the now outdated MOBILE6.2 model in the United States7,8. For GHG emissions, the previous methodology
included using fuel consumption to compute CO2-equivalent emissions; however, in this refresh study an
emission rate for CO2-equivalent was predicted by the MOVES model.
Differences between this refresh study and the previous study are partially attributed to the predicted
emission rates, identified in Table 4-1. The example emission rates for PM2.5 are shown for Corridor 7, and
include brake wear, tire wear, and resuspension emissions.
Table 4-1:       Changes to Emission Rates

                                                                           EMISSION RATE (G/KM)

                                                                GHG          CO      NOX      SOX      PM2.5
      REPORT                                                 (gCO2-e/km)   (g/km)   (g/km)   (g/km)   (g/km)

                                     Speed of 45 km/h           225        5.578    0.813    0.007    0.023
     2013 Report
                                     Speed of 60 km/h           205        5.574    0.819    0.007    0.023

                           2019 (composite of speeds 40-65                                   0.005    0.085
                                                                583        2.073    0.129
     2019 Report                       km/h)

                           2031 (composite of speeds 40-65                                   0.003    0.055
                                                                432        0.936    0.070
                                       km/h)

The CO2-equivalent estimates in the previous report were computed using fuel consumption rates; however,
in the refresh study these estimates were output directly from the MOVES model. A summary of the
changes to the GHG results is identified in Table 4-2.

5
  B. Taylor, "MOBILE6.2C Canadian Supplemental Users' Guide," Environment Canada, 2005.
6 US EPA, "Motor Vehicle Emission Simulator (MOVES)," United States Environmental Protection Agency, 2013.
[Online]. Available: https://www.epa.gov/moves.
7 US EPA, "User Guide for MOVES2010b," United States Environmental Protection Agency, 2012. [Online].

Available: http://www.epa.gov/otaq/models/moves/documents/ 420b12001b.pdf.
8 US EPA, "EPA Releases MOVES2010 Mobile Source Emissions Model: Questions and Answers," United States

Environmental Protection Agency, 2013. [Online]. Available:
http://www.epa.gov/otaq/models/moves/420f09073.pdf.

Sixth Interprovincial Bridge Crossing Study Refresh                                                             WSP
19M-01103-00                                                                                              April 2020
National Capital Commission                                                                                Page 11
Table 4-2: Changes to GHG emission estimates
GHG EMISSIONS BY CORRIDOR (TONNES/YEAR)
CORRIDOR 5 CORRIDOR 6 CORRIDOR 7
REPORT
2013 Report 25 431 56 994 54 243
2019 Report 13 194 20 304 13 415
The transportation team provided the updated AADT values for the region and provided the traffic counts
based on road segments. The AADT estimates for each bridge were 24,420 vehicles/day for Corridor 5,
25,870 vehicles/day for Corridor 6, and 18,740 for Corridor 7. A detailed description of the updated AADT
information is available in the Transportation section of this report. Additional sensitive receptors were
added in AERMOD, such as day cares, senior homes, and schools.
Dispersion modelling was conducted using the United States Environmental Protection Agency’s (US EPA)
AERMOD to assess the potential local air quality impacts associated with the updated transportation
network and long-term population and employment projections. AERMOD has replaced the CALINE
model (used in the previous version of this report) as the US EPA’s preferred model for refined modeling
for mobile source applications and other regulatory applications. AERMOD was developed by the
American Meteorological Society (AMS) and the US EPA through the AERMOD Model Improvement
Committee. The model uses Gaussian Plume dispersion and incorporates the most recent scientific
developments for dispersion modelling. AERMOD undergoes continuous updates, with support from the
US EPA, to improve its performance for source types, meteorological conditions, and terrain features.
As an example, the impacts of changes to the dispersion model for PM2.5 are presented in Table 4-3 for
PM2.5 concentration estimates for each corridor.
Table 4-3: Summary of changes in PM2.5 concentration estimates
PM2.5 CONCENTRATIONS BY CORRIDOR (µG/M3)
REPORT CORRIDOR 5 CORRIDOR 6 CORRIDOR 7
2013 Report 0.689 2.476 2.428
2019 Report 9.63 12.17 12.58
4.4 POTENTIAL IMPACTS DUE TO CHANGE
The results of the refresh study were consistent with the previously drawn conclusions. Corridor 5
remains the preferred option for air quality and continued to have the lowest GHG emissions. Differences
in the magnitude of pollutant emissions are mainly attributed to the use of the MOVES model and
improved dispersion from the use a more advanced dispersion modelled used in the refresh study.
Sixth Interprovincial Bridge Crossing Study Refresh WSP
19M-01103-00 April 2020
National Capital Commission Page 125 FISHERIES AND AQUATIC HABITAT REPORT 5.1 CONCLUSIONS FROM PREVIOUS REPORT The previous Fisheries and Aquatic Habitat Report is dated Oct 2012. The three proposed corridors encompass areas of medium and high environmental constraints related to fish habitat. Kettle Island (Corridor 5) and Lower Duck Island’s marshes and floodplain (Corridor 6) are fish habitats used by eight fish reproductive guilds. Marshes and swamp complexes situated on the north shore of the river, especially McLaurin Bay and Templeton Marsh (Corridors 6 and 7) show suitable spawning conditions for species that spawn in still and shallow water in flooded areas and in aquatic vegetation. Such still and shallow water bays with aquatic vegetation constitute a habitat type highly sought by most of the fish species caught in the three corridors. The extent of this type of habitat in each corridor is the most discriminating factor for the three corridors. Lake sturgeon is the only special status species that was caught during the 2011 fisheries surveys. Almost all individuals were caught near the north shore of the Ottawa River, in Corridors 6 and 7, suggesting that they use this wide shallow area to feed on benthic organisms. Suitable spawning habitats for almost all of the other fish species at risk potentially found in the study area are not well represented in the three corridors. Consequently, the impact to these species should not be used to discriminate between the three corridors. To reduce negative impacts on fish habitat, the bridge’s footprint/layout in each corridor will need to be minimized in high constraints areas to prevent and limit impact on fish. 5.2 METHODOLOGY FOR REFRESH The report update is based in part on fish and fish habitat information obtained from the Quebec Ministry of Forests, Wildlife and Parks, and the Ontario Ministry of Natural Resources and Forestry. We also collected information from reliable sources on the internet, such as scientific reports and MNRF data found on the Land Information Ontario website. In addition, a one-day screening site visit on the river was done in August 2019 to compare available information versus current conditions of the aquatic habitat. This visit was meant to verify if any aquatic and riparian habitats have been significantly altered over the course of the previous 8 years. The habitats have not been characterized, but any significant discrepancy with available information has been noted and reported. 5.3 WHAT HAS CHANGED The list of fish species found in the Dollard des Ormeaux reach of the Ottawa River, enclosed between Chaudière Falls and Carillon dams, has gained 12 new records including three species at risk (SAR): yellow bullhead, cutlip minnow, and margined madtom. Another report of fish species at risk in the study area is the occurrence of river redhorse in Green’s Creek. Among those species, the margined madtom is listed as threatened under the Federal Species at Risk Act (SARA). The other special status species are either Special concern species, or provincially listed species. Sixth Interprovincial Bridge Crossing Study Refresh WSP 19M-01103-00 April 2020 National Capital Commission Page 13
The MNRF data indicates the presence of a confirmed spawning ground for smallmouth bass along the
north side of Upper and Lower Duck Islands. That information supports the findings of the 2012 report
indicating that the area around the north side of Duck Islands is used for spawning by numerous fish species,
including smallmouth bass.
The Upper and Lower Duck Islands area is a Candidate Area of Natural and Scientific Interest (ANSI) for
life sciences, while Green’s Creek is already part of a designated ANSI for life sciences. According to the
MNRF, planning authorities shall protect those representative segments of Ontario’s biodiversity, natural
landscapes and geological features that have been identified as ANSIs by not permitting development and
site alteration in a significant ANSI, nor in adjacent lands, unless it has been demonstrated that there will
be no negative impacts on the feature or its ecological function. On the Quebec side, in 2013 Kettle Island
obtained the status of nature reserve on private land under the provincial Natural Heritage Conservation
Act. The construction of any new infrastructure is generally prohibited in a reserve, unless authorization is
obtained.
The August 2019 field visit has revealed little change in fish habitat features compared to 2012, except on
the Quebec side of the Ottawa River in Corridor 5 where four minor new riverine infrastructures were
observed on the banks or in the floodplain (culvert with rocky stabilization material, recent addition of
stabilization material in a limited area on the bank, new access road between Jacques-Cartier and Saint-
Louis streets, belvedere/rest area along the bike path).

5.4 POTENTIAL IMPACTS DUE TO CHANGE
The new records of fish species within the Ottawa River do not alter the delineation of environmental
constraints areas established in 2012, as the shallow areas generally constituting the most suitable habitats
for fish were already identified in the 2012 report as areas of high environmental constraint.
The three new species at risk reported from the Ottawa River are inhabitants of shallow watercourse areas.
Based on the knowledge of their biology, the yellow bullhead is the only one of the three likely to be found
in the study areas. This species lives in the shallow, still water, and dense-vegetated areas of warm water
rivers. The potential presence of yellow bullhead reinforces the 2012 report's statement that this type of
habitat is one of the most important discriminators to consider in choosing a corridor for the future bridge.
We suggest considering the entire Green's Creek ANSI as a high environmental constraint area, not only
the stream itself. According to the NCC, the steep forested slopes of Green’s Creek and the narrow clay-
based flood plain provide an important wildlife corridor, and supports a wide variety of provincially and
regionally rare species, including probably the largest Canadian population of the rare cattail sedge. The
creek is also home to the river redhorse, a species of special concern in Ontario and Canada.
Finally, at this stage of the project it does not appear necessary to carry out additional inventories of fish
and fish habitat. Once a corridor has been selected, more in-depth inventories can be completed to
accurately direct the location of bridge piers and other footprints, thereby minimizing the project's impact
on fish fauna.

Sixth Interprovincial Bridge Crossing Study Refresh                                                             WSP
19M-01103-00                                                                                              April 2020
National Capital Commission                                                                                Page 14
6 TRANSPORTATION REPORT

6.1 CONCLUSIONS FROM PREVIOUS REPORT
The 2013 Transportation Report was completed to examine reasonable bridge crossing options to
improve and address long-term needs for interprovincial transportation capacity across the Ottawa River.
It provided results and performance data to be used for the evaluation and comparison of the three short-
listed corridor alternatives.
As part of the 2013 report, a comprehensive data collection process was carried out to collect signal timing
plans, turning movement counts as well as automated tube counts (ATRs) and generator data within the
National Capital Region at multiple locations. This data was used to project future volumes along the
corridor alternatives. A comparison of the base ‘do nothing’ future traffic volumes was carried out on three
roadway alignments to identify future operational changes within the corridor as well as each alignments
potential to attract trips, including truck trips. The three corridors being assessed are described below:
Corridor 5: Extends from Autoroute 50 in Gatineau to Highway 417 and Ottawa Road 174 in Ottawa. It
            integrates the existing roads of Montée Paiement on the Gatineau side and the Aviation
            Parkway on the Ottawa side;
Corridor 6: Extends from Autoroute 50 in Gatineau to Highway 417 in Ottawa, via Ottawa Road 174. It
            integrates the existing roads of Lorrain Boulevard on the Gatineau side and Ottawa Road 174
            on the Ottawa side; and
Corridor 7: Extends from Autoroute 50 in Gatineau to Highway 417 in Ottawa, via Ottawa Road 174.
            On the Gatineau side, the future roadway is located east of the Gatineau Airport, between
            Granby Street and Montée Chauret. Corridor 7 crosses Maloney Boulevard West and is
            expected to connect to both Autoroute 50 and Ottawa Road 174 by way of interchanges.
The traffic operational analysis indicated that Corridor 5 provides the biggest shift in traffic volumes from
the existing bridges. A sensitivity analysis indicated that this was still the case with the introduction of a
southbound left turn prohibition from the future bridge towards Rockcliffe Parkway during the morning
peak hour. Corridor 6 is nearly as effective as Corridor 5 at attracting traffic to the new bridge but not so
efficient at attracting traffic away from the existing bridges – although as efficient as Corridor 5 in terms
of transit ridership. Both Corridor 5 and Corridor 6 are more efficient than Corridor 7.
Overall in terms of safety, Corridor 7 is deemed to have the lower probability of collisions and therefore is
more efficient under the criteria used for the road safety analysis, followed by Corridor 6, then Corridor 5.
In terms of Traffic Safety, the following conclusions were identified:
— Land use: Corridor 5 is located in a developed area on both sides of the Ottawa River and requires only
  marginal land acquisitions on the Gatineau side. Corridor 6 is located in a developed area on the
  Gatineau side (requiring major land acquisitions) and crosses an undeveloped area (Greenbelt) on the
  Ottawa side connecting after to an existing freeway corridor (Ottawa Road 174). Both Corridors 5 and
  6 require service roads on the Gatineau side to ensure safe access to/from the east side existing
  properties. Corridor 7 is located in undeveloped areas on both sides the Ottawa River.
— Intersections: Corridor 5 has the highest number of intersections whereas Corridor 7 has the lowest.
  Therefore, the probability of collisions is highest at Corridor 5, considering that a higher number of
  intersections represents a higher number of conflict points which results in higher exposure to
  collisions.

Sixth Interprovincial Bridge Crossing Study Refresh                                                             WSP
19M-01103-00                                                                                              April 2020
National Capital Commission                                                                                Page 15
— Controlled-access: Corridor 7 has the longest controlled-access segment, followed closely by Corridor 6. Therefore, the probability of collisions is highest at Corridor 5, considering that a controlled-access segment yields lower exposure to collisions than an arterial roadway with at-grade intersections. Transit service for the three scenarios was similar whereby OC Transpo did not run any buses on the new bridges and STO used four transit routes on Corridor 5 and three transit routes on Corridors 6 and 7 in comparison to one STO transit route on each corridor for this refresh. The analysis of transit operations revealed that Corridor 5 is the most efficient at attracting transit trips to the new bridge and at limiting the modal transfer from transit to car on a regional scale (even though it is also the most efficient at attracting car traffic). Corridors 6 and 7 are not as efficient as they do not attract as many transit trips to their respective bridges and instead encourage a stronger transfer from transit to car. Lastly in terms of connectivity and active transportation, the selected Corridor 5 provides the most connectivity due to its proximity to highly populated areas and a high connectivity with existing and planned active transportation facilities on both sides of the Ottawa River. Notably, its location will allow a direct connection to the Aviation and Ottawa River multi-use pathways (NCC) as well as the Route Verte and the Rapibus bicycle path, and may encourage not only recreational cyclists but also, potentially, commuting cyclists. 6.2 METHODOLOGY FOR REFRESH The refresh was carried out using the same approach and methodology utilized for the 2013 analysis as documented in the Transportation Review Report and is described below. The TRANS model was utilized to support the modelling of the different scenarios for truck, transit and traffic assignments. Technical support was provided by City of Ottawa staff, who carried out the required model runs and provided the results along with the relevant assumptions, description of model limitations, and occasionally suggested additional modifications to scenarios being modelled. Subsequent analysis carried out and interpreted by the consultant. Truck Traffic Analysis: Per the 2013 Transportation Review Report, four truck route scenarios were assessed to estimate the impact of restricting or prohibiting trucks to varying degrees on the King Edward Rideau Waller Nicolas (KERWN) corridor. The 2013 study included a data collection program with automated traffic recorders (ATR) and video cameras installed at key locations over several days to gain an understanding of the proportion of trucks on local versus regional routes. The refresh did not include a data collection and as such, proportions of local versus regional trucks were carried forward from the previous study. The TRANS regional model was updated based on the data, as was done in the 2013 study but with the 2011 TRANS model, and the impacts of truck route scenarios with various truck prohibitions and restrictions were estimated. Traffic Operation Analysis: The traffic operation analysis evaluates the future traffic volume-to-capacity (V/C) ratio and LOS of key intersections on and adjacent to each corridor. Traffic volumes were extrapolated using the 2011 TRANS model traffic projections for 2031 and the 2031 scenario volumes from the 2013 Transportation Review. Similar to the 2013 report, the TRANS link volumes were converted to turning movement counts using the Fratar method. The software tool Synchro 10 (based on the Highway Capacity Manual methodology) has been used to determine the operations of each intersection with the turning movements developed. This analysis generally uses the same lane configurations utilized in the 2013 report, however some adjustments have been made to improve the overall operations in some instances. Traffic Safety Analysis: The traffic safety analysis in the 2013 Transportation Review Report was a qualitative assessment of the safety-related elements of the proposed design for each corridor. That is, the Sixth Interprovincial Bridge Crossing Study Refresh WSP 19M-01103-00 April 2020 National Capital Commission Page 16
elements to be considered are the number of intersections with arterials, collectors, and local/private roads,
the length of any access-controlled (intersection-free) segments, the roadside character (land use) along
each corridor, and the infrastructure provided for vulnerable road users (pedestrians and cyclists). As the
refresh was for the corridors assessed in the 2013 report, there are no changes to the qualitative traffic safety
analysis previously carried out.
Transit Operation Analysis: The transit operation analysis included a review of the current transit service
on both sides of the Ottawa River, as well as the future planned transit projects in the NCR. An analysis of
the impact of a new interprovincial crossing on transit use and operation for the 2031 horizon year was
carried out based on 2011 TRANS model simulation results. Reserved lanes for buses were included on the
three proposed corridors and specific transit routes were designed based on discussions with OC Transpo
and Société de transport de l’Outaouais (STO).
Analysis of Connectivity to Active Transportation Infrastructure: The analysis of the connectivity to
active transportation infrastructure acknowledges the current and planned active transportation facilities in
Ottawa and Gatineau and provides recommendations on how the connections must be made between the
future bridge and the planned active transportation network (bicycle paths, sidewalks). The refresh report
incorporates the latest cycling plans within the NCR to support the vision and objectives of both the City
of Ottawa and the City of Gatineau as well as the NCC.

6.3 WHAT HAS CHANGED
The analysis for the future traffic, transit and truck conditions are primarily based on projections provided
by the TRANS regional simulation model. Analysis carried out for the 2019 Refresh is based on the TRANS
model that utilized 2011 origin-destination data, which reflects an update from the 2005 O-D survey as well
as changes in land use, population and employment projections and projects completed within the NCR
since the 2013 Transportation Review. At the time of the Refresh no new data was available on truck traffic
and therefore the 2007 Interprovincial Roadside Truck Survey and ATR truck data used in the 2013 report
was reused for this analysis.
Results of the truck updated truck traffic analysis reflected significant changes to the truck trip table within
the 2011 TRANS model when compared to that used in the 2013 Transportation Review. The new bridge
is expected to attract 7% to 28% of interprovincial truck traffic, with the Corridor 5 scenario with removal
of the truck route designation on the KERWN Corridor expected to attract the most truck traffic. Proportions
of trucks attracted were more evenly distributed across scenarios evaluated in the previous study, with more
truck traffic proportionally being attracted to the Chaudière Bridge in the 2019 study compared to the 2013
study. The removal of truck routing on the KERWN corridor is expected to impact the Chaudière crossing
the most significantly in terms of truck volumes in both the 2013 and 2019 analyses.
Updated traffic analysis results indicate that the Corridor 6 bridge will attract the most traffic to the new
bridge of the three corridors analyzed, as well as remove the most traffic from the existing bridges. Corridor
5 is expected to be essentially as effective as Corridor 6 in attracting traffic to the new bridge, but not as
effective at attracting traffic away from existing bridges. In the previous analysis, Corridor 5 was the most
effective in attracting traffic to the new bridge and away from existing bridges, followed closely by Corridor
6, which was nearly as effective at attracting traffic to the new bridge but not as effective at attracting traffic
away from existing bridges. In both the 2013 and 2019 analyses, Corridor 5 is expected to experience the
most traffic capacity issues during peak hours on the Ottawa side due to the impacts at downstream
intersections, whereas major traffic capacity issues are not expected in Corridor 6 (with a grade-separated
Boulevard Lorrain Boulevard / Boulevard Maloney intersection) and Corridor 7.
Proposed transit routing, through consultation with the transit agencies, for the 2019 Refresh included a
reduction in routes from the 2013 study, with a single (STO) transit route proposed for the new crossing at

Sixth Interprovincial Bridge Crossing Study Refresh                                                                  WSP
19M-01103-00                                                                                                   April 2020
National Capital Commission                                                                                     Page 17
a reduced frequency. Both studies found that Corridor 5 is the most effective at attracting transit trips to the
new bridge. The road safety analysis did not require updating from the 2013 report. Minor modifications
were made to the active transportation infrastructure recommendations, though Corridor 5 remained the
preferred corridor and Corridor 7 the least favourable from an active transportation perspective.

6.4 POTENTIAL IMPACTS DUE TO CHANGE
The 2019 Transportation Review Refresh with the updated 2011 TRANS Model assignment resulted in
changes in how each corridor attracted trip compared to the 2013 report: Corridor 5 is expected to attract
the most truck trips (previously Corridor 6) and Corridor 6 is expected to attract the most traffic to the new
bridge as well as away from the existing bridges (previously Corridor 5). However, it is noted that traffic
analysis results are comparable for Corridors 5 and 6 in both the 2013 and 2019 analysis. Other major
findings of the transportation review remain largely unchanged from the previous analyses.
It is also noted that TRANS has plans to carry out a new Origin-Destination Survey in the Fall of 2020 as
well they are currently carrying out a detailed Truck Survey and modeling exercise (expected completion
Summer 2020) to gain a better understanding on how trucks travel between provinces. In addition, the City
of Ottawa has recently initiated their Transportation Master Plan (TMP) update. The results of these data
collection and project efforts may be more reflective of current and future conditions within the NCR as
they will capture the influence the recently opened LRT in Ottawa and new Rapibus has on the mode choice,
as well as current trends and future planning initiatives for transportation within the Region.

Sixth Interprovincial Bridge Crossing Study Refresh                                                               WSP
19M-01103-00                                                                                                April 2020
National Capital Commission                                                                                  Page 18
You can also read