South Norwalk 2- to 4- Family Housing Market Study - Norwalk, CT
←
→
Page content transcription
If your browser does not render page correctly, please read the page content below
Jonathan Rose Companies

FINAL - March 18, 2013

South Norwalk 2- to 4- Family
Housing Market Study

                         Submitted to:
                         Norwalk Redevelopment Agency
                         125 East Avenue
                         Norwalk, CT 06856-5125

                         Submitted by:
                         Jonathan Rose Companies, LLC
                         300 Main Street, 5th Floor
                         Stamford, CT 06901
Table of Contents
INTRODUCTION............................................................................................................................................................... 2
Report Purpose ............................................................................................................................................ 2
Target Geography ........................................................................................................................................ 3
EXECUTIVE SUMMARY ................................................................................................................................................. 5
MARKET ANALYSIS ........................................................................................................................................................ 7
The South Norwalk 2- to 4-Family Housing Stock ...................................................................................... 7
Current Market Conditions and Trends in the South Norwalk 2- to 4-Family Segment ............................ 10
Target Area Existing Conditions ................................................................................................................. 16
Demographic Profile of Purchasers of 2- to 4-Family Houses ..................................................................... 23
VALUATION OF 2- TO 4-FAMILY HOUSES ......................................................................................................... 29
2-Family Purchase by Owner-Occupant..................................................................................................... 29
3-Family Purchase by Investor .................................................................................................................... 31
The Bottom Line ....................................................................................................................................... 33
CONCLUSION - NEXT STEPS .................................................................................................................................... 34
APPENDIX........................................................................................................................................................................ 37
Steering Committee ................................................................................................................................... 37
Data Sources ............................................................................................................................................... 37
Target Geography ...................................................................................................................................... 38
Matrix of Available Properties .................................................................................................................... 40
1Introduction
Report Purpose
The goal of this report is to provide public officials in the City of Norwalk, Connecticut a resource to
assist in the development of policies to support and enhance the stock of 2- to 4-family houses in the
neighborhood surrounding the South Norwalk Train Station. This study is supported by the One Region
Funders Group, which awarded the Norwalk Redevelopment Agency a grant to study the 2- to 4-family
housing market as a part of its broader neighborhood revitalization efforts. As referenced in the grant
application, the purpose of the study is to better understand the dynamics of this market in order to
determine strategies to increase the amount of owner-occupation of 2- to 4-family housing and deed-
restricted affordable housing in the neighborhood surrounding the South Norwalk Train Station. 2- to 4-
family housing makes up a sizeable amount of the "unrestricted" affordable housing in South Norwalk, due
to its comparatively lower rents and sales prices, which brings it within reach of low- and moderate-
income families. However, because it is unrestricted affordable housing, the occupants of 2- to 4-family
housing are at greater risk of dislocation due to gentrification or redevelopment. The market information
contained within this report is intended to assist the City of Norwalk in developing a detailed
understanding of current and past market conditions in the 2- to 4-family housing segment in South
Norwalk, Connecticut.
The Norwalk Redevelopment Agency contracted Jonathan Rose Companies to complete this market
study of the 2- to 4-family housing stock in South Norwalk, Connecticut. Over a four-month period in
2012, Jonathan Rose Companies compiled data from several sources to describe existing market
conditions, including rents and sales prices; trends in the 2- to 4-family housing market from 2004 to 2012;
a demographic profile of residents, renters and purchasers of 2- to 4-family housing in South Norwalk; and
national data on 2- to 4-family housing. The sources of data are described in more detail below.
Additionally, the Norwalk Redevelopment Agency assembled a Steering Committee, which received
biweekly updates from Jonathan Rose Companies containing interim research findings and advised on
directions for further research. The members of that Steering Committee are listed in the Appendix.
2Target Geography
The target area for this study is a quarter-mile radius circle around the South Norwalk Train Station,
located at 24 Monroe Street, South Norwalk, Connecticut. A map of this area is below.
Figure 1
3There are a total of 103 2- to 4-family properties located within this target area, of which 62 (60%) are 2-
family, 32 (31%) are 3-family, and 9 (9%) are 4-family houses (total of 256 units).
Due to the limitations inherent with a data set this small, the market analysis also utilized a larger
geography to note temporal and spatial trends in the 2- to 4-family housing market. This geography
varied by data source:
For purposes of analyzing market data on sales and rentals of 2- to 4-family houses on the Multiple
Listing Services (MLS), all such properties classified as located in the South Norwalk Market Area
were considered.
For purposes of analyzing U.S. Census and American Community Survey (ACS) data, the three
census tracts that make up the South Norwalk neighborhood were considered. This area is shown
in the Appendix .
For purposes of clarification, the following terminology is used to distinguish between the different
geographic scales of analysis:
The area within a quarter-mile radius of the South Norwalk Train Station, shown above in Figure
1, is referred to as the "Target Area."
The area used to describe wider market or demographic trends using MLS or U.S. Census data,
which is shown in the Appendix, is referred to as "Greater South Norwalk."
4Executive Summary
Jonathan Rose Companies found the following key observations of the South Norwalk 2- to 4-family
housing market:
Values in the sales market for 2- to 4-family houses in Greater South Norwalk have
dropped nearly 50 percent during the period from 2004 to 2012. Average sales prices of
2- to 4-family houses in Greater South Norwalk dropped from a peak of $512,474 in 2006 to
$226,179 in 2010, before recovering modestly in 2011 and 2012 to an average of $252,833 among
houses currently listed on the MLS.
Monthly rental rates in 2- to 4-family houses in Greater South Norwalk, however, have
increased 13 percent during the same period. Average rents for apartments in 2- to 4-family
houses have gradually risen from an average of $1,400 in 2007 to $1,575 among apartments
currently listed on the MLS. Current MLS listings average $1,400 for 1-bedroom apartments,
$1,419 for 2-bedroom apartments, and $1,775 for 3-bedroom apartments.
2- to 4-family houses constitute a considerable portion of Greater South Norwalk's
housing and are generally more affordable to low- and moderate-income households
than other housing types. In Greater South Norwalk, 2- to 4-family houses constitute 30
percent of all housing units, or about 1,700 houses, of which nearly one half are 2-family houses
and the remainder 3- or 4-family houses. The average rentals for one-bedroom, two-bedroom
and three-bedroom apartments are comparable to both the HUD Fair Market Rent and the gross
rents under the Low Income Housing Tax Credit program. Additionally, the average sales price
for 2- to 4-family houses is well below the average for single family houses in the City of
Norwalk.
Foreclosure and short sale activity has dominated the Greater South Norwalk 2- to 4-
family sales market since 2008, constituting 65 percent of all sales from 2008 to today.
Short sales or foreclosure sales heavily impact the population able to purchase the properties and
favor investors over owner-occupants. For example, foreclosure auctions typically require an all-
cash purchase, which most prospective homebuyers cannot do.
A diverse population purchases and owns 2- to 4-family houses in Greater South
Norwalk and the Target Area, including owner-occupants, local landlords, and
absentee landlords, and many owners purchase for a long-term hold. Within the Target
Area, approximately one half of 2- to 4-family houses are held by owner-occupants, with the rest
split nearly evenly between local and absentee landlords. The average hold period for current
owners is 16 years.
5 Trends in the purchasers of 2- to 4-family houses in Greater South Norwalk show a
rapid drop in owner-occupants from 2006 to 2010, often due to foreclosures, with an
increase of owner-occupants in 2011 and 2012. The percentage of purchasers of 2- to 4-
family houses who are owner-occupants dropped from 91 percent in 2006 to 47 percent in 2009,
largely due to financing limitations and a plethora of foreclosures and short sales. 89 percent of 2-
to 4-family houses purchased in 2009 were short sale or foreclosure properties.
Demographic analysis indicates changing patterns of occupancy and ownership of 2-
to 4-family houses in Greater South Norwalk among specific ethnic groups. Occupants
of 2- to 4-family houses were more likely to be White or Asian and less likely to be Black than the
general Greater South Norwalk population. However, new purchasers of 2- to 4-family housing
in Greater South Norwalk were found to be largely Hispanic, constituting 45 percent of all
purchasers and 58 percent of new owner-occupants from 2004 to 2012.
6Market Analysis
This Market Analysis consists of a detailed analysis of 2- to 4-family housing in South Norwalk,
Connecticut, with a specific focus on the Target Area, which is the area within a quarter-mile radius circle
around the South Norwalk Train Station. The Analysis will begin with a description of the current
conditions of the 2- to 4-family housing in both the Target Area and in Greater South Norwalk. Next,
market and demographic data on the 2- to 4-family houses in the Target Area and in Greater South
Norwalk are analyzed to determine existing market conditions, market trends, and key demographic
groups active in this market segment. Finally, an analysis of the underwriting and financing of the
purchase of sample 2- and 3-family houses is presented from the viewpoint of an owner-occupant and an
investor in order to better understand the financial goals and motivations of each type of owner.
The South Norwalk 2- to 4-Family Housing Stock
Greater South Norwalk's 2- to 4-family housing is considerably older housing than the rest of
Norwalk's housing stock. South Norwalk, Connecticut contains a legacy of 2- to 4-family houses that
reflects its historical development as an industrial city in the late 19th Century. Following the completion
of the South Norwalk railroad depot and freight facilities in 1870, there was a rapid expansion of
commercial and manufacturing activity, which was followed by the construction of many multifamily
houses in the late 19th- and early 20th-Century. These houses were built for the workers of the factories,
mills and shops that existed in South Norwalk at that time.1 According to City of Norwalk tax assessor
data, the average year built is 1912 for 2-family houses and 1905 for 3-family houses in Greater South
Norwalk.2 These housing units are far older than the average age of all housing in City of Norwalk (1946)
and the Northeast (1958).3
The age of this housing leads to greater levels of deterioration and demolition, although
Greater South Norwalk's multifamily housing is in comparatively good shape. Because of the
age of the housing units, they are frequently of inferior condition or ill-suited to modern living standards.
Many 2- to 4-family houses have lead and asbestos-containing materials present in their construction or
have not been maintained well over time, leading to deterioration. For these reasons, demolition and
deterioration of 2- to 4-family housing units is common. In his national study of 2- to 4-family housing,
Alan Mallach reports that between 1995 and 2001, the number of 2- to 4-family houses declined by 12.6%
(660,000 units), and the number of units lost was highest among 2- to 4-family houses built before 1939
(356,000 units).4 Review of City of Norwalk tax assessor data, presented below in Figure 2, indicated that
1
United State Department of the Interior: National Park Service. Haviland and Elizabeth Streets / Hanford Place
Historic District: Registration Form. 1987.
Accessed online: (http://pdfhost.focus.nps.gov/docs/NRHP/Text/88000664.pdf) on 12/28/12.
2
Note: Due to the way the City of Norwalk codes tax assessor data, we could not separate out 4-family houses for
this analysis.
3
American Housing Survey and City of Norwalk tax assessor data.
4
Mallach, Alan. "Landlords at the Margins: Exploring the Dynamics of the One to Four Family Rental Housing
Industry." Joint Center for Housing Studies of Harvard University: March, 2007.
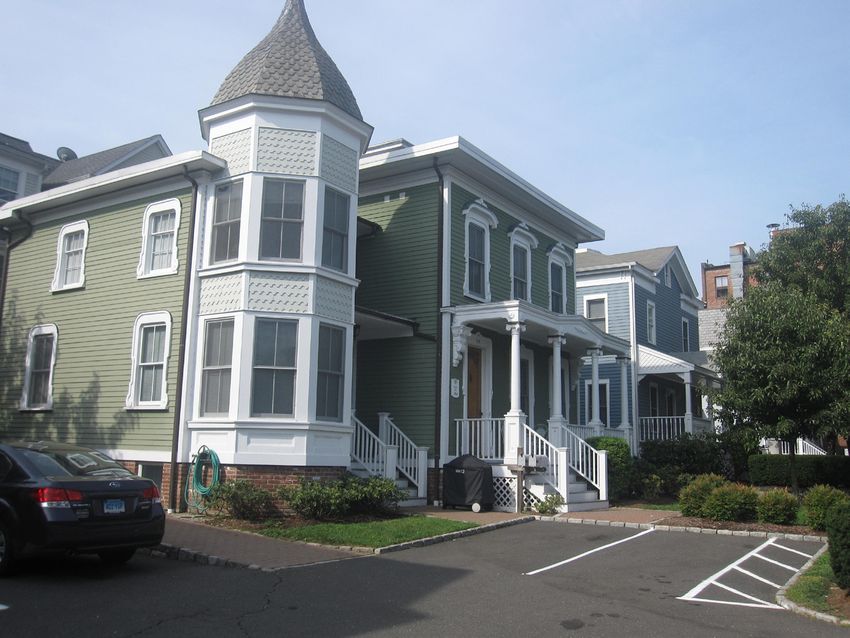
72- to 4-family houses in the Target Area vary in condition, ranging from "Poor" to "Very Good".
Although many properties belonged to the "Average" classification, a significant number in the Target
Area were "Fair". In Greater South Norwalk, 2- to 4-family housing conditions were better in the
Golden Hill neighborhood to the north, which is characterized by higher levels of owner-occupancy, and
worse south of the train station, which has higher levels of absentee landlord ownership.
Figure 2
8An additional challenge is the architectural layouts of 2- to 4-family houses, which are often obsolete due
changes in living standards and practices since the houses were constructed over 100 years ago. Below are
some of the primary differences:
Kitchens in multifamily houses constructed in the late 19th- and early 20th-Century were small
and often detached from the rest of the apartment due to fears of fire and unsanitary conditions.
Today, the kitchen has become the heart of the house, often occupying a large amount of space at
the center of the house and open seamlessly to other living areas.
Similarly, multifamily houses in the late 19th- and early 20th-Century were often organized into
many smaller rooms to conserve expensive and limited space heating. Today, homebuyers prefer
an open floorplan with many living spaces seamlessly connected.
In the late 19th- and early 20th-Century, indoor plumbing was an expensive luxury or was added
later after the house had already been constructed. This often resulted in bathrooms that were
small and awkwardly situated, and few houses contained more than one. Modern homebuyers
often look for multiple bathrooms and a typical desire is a master bathroom, which is a bathroom
that is only accessible from one of the bedrooms.
Lastly, provisions for washing machines and clothes dryers were absent from houses built in the
late 19th-and early 20th Century and were either awkwardly added later or not added at all.
However, modern homebuyers demand a conveniently accessible washing machine and clothes
dryer.
Due to these factors, modern homebuyers will sometimes avoid 2- to 4-family houses built in the late
19th- and early 20th-Centuries or look to modernize the interior layouts to meet today's living patterns.
9Current Market Conditions and Trends in the South Norwalk 2- to 4-Family
Segment
The average price for 2- to 4-family houses in Greater South Norwalk currently on the
market is $252,833 and the average cost per unit is $112,265. As of December, 2012, the MLS
contained fifteen 2- to 4-family houses in Greater South Norwalk for sale, of which eleven were 2-family,
three were 3-family and one was 4-family.6
Average sales prices and prices per unit for 2- to 4-family houses in Greater South Norwalk
plummeted 44 percent between 2004 and 2012, due to the effects of collapse of the national
housing bubble after 2007. As shown in Figure 3, the average sales prices of Greater South Norwalk 2-
to 4-family houses fell from a peak of $512,474 in 2006 to a nadir of $226,179 in 2010, a loss of 56
percent. Since 2010, values have modestly recovered 12 percent. At the same time, prices per unit fell
from $218,688 in 2006 to $102,214 in 2010, a loss of 53 percent, as shown in Figure 4. Figure 4 also
shows the range of prices from high to low in each year. Prices spanned a broad range from 2004 to 2007,
which has since tightened. This indicates that the market may be returning to a healthy state, because a
narrower range of values may mean that buyers and sellers are more in alignment on the valuation of
properties on the market. Lastly, Figure 4 demonstrates the dire position buyers of 2- to 4-family houses
from 2004 to 2006 face today: The low sales price in 2006, $327,500, is $100,000 higher than the average
sales price in 2012, $235,717, and only five properties sold in 2012 higher than the 2006 low price.
Figure 3
Greater South Norwalk 2- to 4-Family Sales
Prices: 2004-2012
$1,200,000
$1,000,000
$800,000
$600,000
$400,000
$200,000
$0
Sold Sold Sold Sold Sold Sold Sold Sold Sold On
2004 2005 2006 2007 2008 2009 2010 2011 2012 Market
Low Median Average High
6
Note that due to the size of the Greater South Norwalk 2- to 4-family sales market, the data set is relatively small.
Between 2004 and 2012, 180 2- to 4-family houses sold on the MLS, which corresponds to an average of 20 houses
sold per year. This imposes some distortions on the statistical analysis of the data set, since a few high sales prices can
skew the average or median sales prices.
10Figure 4
Greater South Norwalk 2- to 4-Family Housing
Market Trends:
Sales per Unit and per Square Foot
$250,000 $300
Sales Price per Square Foot
$250
$200,000
Sales Price per Unit
$200
$150,000
$150
$100,000
$100
$50,000
$50
$0 $0
Sold Sold Sold Sold Sold Sold Sold Sold Sold On
2004 2005 2006 2007 2008 2009 2010 2011 2012 Market
Avg. Cost / Unit Avg. Cost / SF
The Greater South Norwalk 2- to 4-family market is more volatile than the market for single-
family houses in Norwalk as a whole, which has resulted in a greater losses in value from 2006
to 2010 in the 2- to 4-family sector. Figure 5 compares the average year-over-year change in sales
price per unit of 2- to 4-family houses in Greater South Norwalk against the average year-over-year
change in single-family sales prices in Norwalk as a whole. While the general patterns are similar, the
yearly increases or decreases in value in the 2- to 4-family sector are more extreme.
11Figure 5
Comparison of Year-Over-Year Changes in Value:
Greater South Norwalk 2- to 4-Family and
Norwalk Single-Family: 2004-2012
30%
20%
10%
0%
-10%
-20%
-30%
-40%
South Norwalk Multifamily Norwalk Single-Family Average
Foreclosures and Short Sales have dominated the 2- to 4-family sales market since 2008,
constituting an average of 62% of properties on the market from 2008 to 2012. The Greater
South Norwalk 2- to 4-family housing market has felt the effects of the national housing market crisis
heavily since 2008. According to Warren Group data, there have been 27 Foreclosure notices and 262 Lis
Pendens notices sent to owners of Greater South Norwalk 2- to 4-family houses since 2004.7
In Connecticut, a Lis Pendens action marks the commencement of a foreclosure action once a borrower
has fallen behind significantly in their home loan payments. Many times, the borrower will try to sell the
house via a "Short Sale" process, whereby any offer received is subject to bank approval. The bank
frequently agrees to a sales price that is below the outstanding debt on the property to avoid a foreclosure
process. If the borrower is unable to sell the house and/or pay the balance owed to the lender following a
7
Warren Group, 2012. Data provided by the Warren Group as of 12/17/2012. Note that more than one Lis
Pendens and/or Foreclosure Notices are sometimes sent to the same address, particularly if the homeowner has
continuing difficulties in paying his or her mortgage.
12Lis Pendens notice, the foreclosure proceeds to trial where, if the bank prevails, a judge orders a
foreclosure sale.
Figure 6 shows the impact of foreclosure activity on the South Norwalk 2- to 4-family market. Starting in
2008, the percentage of 2- to 4-family houses sold while in the Lis Pendens stage (i.e. Short Sales) has
averaged 62%, peaked at 89% of all sales in 2009, and comprises 67% of the houses currently on the
market. Foreclosure sales constituted as much as 22% of the sales in 2009, though the number has since
dropped off. Figure 6 also shows how many houses sold from 2004 to 2007 later went to Lis Pendens or
Foreclosure: At the peak of the housing bubble in 2006, 67% of houses sold later went to Lis Pendens and
11% went to Foreclosure.
Figure 6
Greater South Norwalk 2- to 4-Family Housing
Market Trends:
Lis Penden / Foreclosure Activity
100%
90%
80%
70%
60%
Went to Lis Pendens
50% Went to Foreclosure
40% Bought From Lis Pendens
30% Bought From Foreclosure
20%
10%
0%
Sold Sold Sold Sold Sold Sold Sold Sold Sold On
2004 2005 2006 2007 2008 2009 2010 2011 2012 Market
The average asking price for a rental in a 2- to 4-family house in Greater South Norwalk
currently on the market is $1,575. The average price for units rented in 2012, however, was $1,355, a
difference of 16 percent, which indicates that demand for rental units may be increasing. Rents in 2- to 4-
family houses in Greater South Norwalk span a broad spectrum of values, ranging in 2012 from a low of
$675 to a high of $2,000. Rents in 2012 averaged $1,056 for 1-bedroom apartments, $1,367 for 2-
bedroom apartments, and $1,694 for 3-bedroom apartments.
Rent values have been stable in Greater South Norwalk 2- to 4-family houses, growing 13
percent from 2007 to the current time. Figure 7 additionally shows the change in rents by bedroom
size. Rents for all bedroom sizes have remained stable during the period, though 1-bedroom and 3-
bedroom rents have grown the most.
13Figure 7
Average Rents By Unit Size in Greater South
Norwalk 2- to 4-Family Houses: 2007-2012
$2,000
$1,800
$1,600
$1,400
$1,200
$1,000
$800
$600
$400
$200
$0
Rented 2007 Rented 2008 Rented 2009 Rented 2010 Rented 2011 Rented 2012 On Market
1-BR Average 2-BR Average 3-BR Average
Rental units in Greater South Norwalk 2- to 4-family houses constitute an important element
of Norwalk's affordable housing. Although not rent controlled or subsidized, rental units within 2- to
4-family houses in Greater South Norwalk often rent at levels below government-subsidized affordable
housing rental programs. Figure 8 compares the 2012 average rents by bedroom size in Greater South
Norwalk 2- to 4-family houses against the HUD Fair Market Rent (FMR) and the Low Income Housing
Tax Credit (LIHTC) rent limit for housing affordable to households earning at or below 60 percent of
Area Median Income (AMI). The FMR represents the maximum amount a landlord may be paid as rental
income for a tenant receiving Section 8 voucher assistance, a program in which a low-income tenant pays
30 percent of his/her annual gross income towards the rent and HUD pays the balance up to the FMR.
Thus apartment rents above the FMR are generally out of reach for Section 8 households. The 60 percent
of AMI rent limit is the maximum amount a landlord may charge a tenant who resides in a building
financed by LIHTCs.
Figure 8: 2012 Rental Comparison
Unit Type 1-Bedroom 2-Bedroom 3-Bedroom
Average Rents in Greater South
$1,056 $1,367 $1,694
Norwalk 2- to 4-Family Houses
HUD FMR $1,415 $1,769 $2,305
60% of AMI Rent Limit8 $1,445 $1,734 $2,003
8
Rent limit includes heat, hot water and electricity utility costs ("Gross Rent"). Commonly, landlords deduct an
"allowance" for average utility costs from the Gross Rent to calculate the tenant's rent, where the landlord does not
supply utilities. However, rents in 2- to 4-family houses also often include utility costs.
14The sales prices of Greater South Norwalk 2- to 4-family houses during the national housing
bubble (2004 - 2007) became detached from the underlying rental income stream, leading to
severe over-valuation. Figure 9 compares the rents per square foot (right y-axis) against the sales prices
per square foot (left y-axis) during the period 2007 to 2012, showing a deep plunge in sales prices while
rent amounts remained constant. This is evidence of over-valuation, because 2- to 4-family houses are
generally considered an investment property, which is a class in which sales prices and rents generally
correlate.
Figure 9
Average Cost per Square Foot Compared to
Rent per Square Foot: Greater South Norwalk 2-
to 4-Family Houses, 2007 - 2012
$250 $1.60
$1.40
$200
$1.20
Rents per SF
Cost per SF
$150 $1.00
$0.80
$100 $0.60
$0.40
$50
$0.20
$0 $0.00
Rented Rented Rented Rented Rented Rented On
2007 2008 2009 2010 2011 2012 Market
Avg. Cost / SF $224 $167 $115 $94 $116 $107 $114
Avg. Rents / SF $1.38 $1.47 $1.41 $1.28 $1.33 $1.47 $1.49
An investment property is one in which a purchaser invests capital in the acquisition of the property with
an expectation of a cash flow return from the residual income generated from the operations of the rental
unit(s). This compares against a single-family, owner-occupied house in which the purchaser expects no
regular cash flow from the investment but rather a stable place to live. The amount of cash flow generated
by a 2- to 4-family house is determined, to a large extent, by the growth or decline of the rents charged
for the rental unit(s). Therefore it is expected that sales prices and rents will correlate in a 2- to 4-family
house market. Figure 9 shows that prices before 2007 were driven by expectations of future appreciation
more than by rent growth. Once the expectations of future appreciation evaporated following the housing
market crash in 2008, values of 2- to 4-family houses plummeted. The Valuation Section will further
describe how 2- to 4-family houses are generally valued and the relationship between rental income and
sales prices.
15Target Area Existing Conditions
The 2- to 4-Family Houses in the Target Area were analyzed further to investigate micro-patterns of
market values, ownership, tenure and landlord activity by street. Due to varying conditions found within,
the Target Area was divided into three districts, as displayed in Figure 10 below:
The West District comprises the largest number of 2- to 4-family houses and includes all streets
within the Target Area to the west of the South Norwalk Train Station. Properties in this District
are more likely to be of higher value and owner-occupied.
The Station District comprises a diverse mix of owner-occupied and landlord-owned properties of
generally higher value and varying condition, likely due to the higher levels of landlord ownership.
The South District were found to be of lower value and owned by investors.
There are also important differences between 2-family and 3- or 4-family houses in the Target Area:
2-family houses are more prevalent in the West District and more commonly owned by owner-
occupants.
3- or 4-family houses are more prevalent along historically prominent streets and the Station
District, and are more likely to be owned by landlords.
16Figure 10
Market conditions vary across the Target Area, with the highest values found in the Station
and West Districts. Due to the small number of transactions that occurred within the past eight years
within the Target Area, it was impossible to draw from that data set any conclusions about the market
value of Target Area properties. However, the assessed values, as calculated by the City of Norwalk as of
17the 2008 Revaluation9 of 2- to 4-family houses in the target area were analyzed in Figure 11. The data
show a pattern of higher valuation of properties in the Station and West Districts and lower in the South
District.
Figure 11
9
Note that the valuations are as of October, 2007.
18There are relatively few 2- to 4-family houses available for purchase within the Target Area.
Figure 12 shows the properties within and outside of the Target Area that are either listed on the MLS as
of March 11, 2013 or have been issued a Lis Pendens between June and December, 2012. Only 2 of 14
MLS listings and 1 of 17 Lis Pendens properties are located within the Target Area. Additional data on
each property is available in the Appendix.
Figure 12
19Building types vary by street within the Target Area with a concentration of 2-family houses
in the West District. Figure 13 displays the street-by-street percentage of 2-, 3- and 4-family houses.
Overall, 60 percent of multifamily houses in the Target Area are 2-family, although the West District
generally contain a higher percentage of 2-family houses. Many of the 3- and 4-family houses are located
on the streets that were historically prominent, such as South Main Street (71%) and Flax Hill Road (54%)
and also in the Station District.
Figure 13
Street # of 2- # of 3- # of 4- % 2- % 3- % 4-
Family Family Family Family Family Family
Chestnut Street 6 0 3 67% 0% 33%
South Main Street 4 7 3 29% 50% 21%
Concord Street 4 6 0 40% 60% 0%
Hanford Place 4 5 0 44% 56% 0%
Lowe Street 21 4 0 84% 16% 0%
Clay Street 2 1 0 67% 33% 0%
Gibson Court 2 1 0 67% 33% 0%
Flax Hill Road 5 3 3 45% 27% 27%
Hamilton Terrace 1 2 0 33% 67% 0%
Cleveland Terrace 6 1 0 86% 14% 0%
Lubrano Place 2 0 0 100% 0% 0%
Lexington Avenue 5 2 0 71% 29% 0%
Totals 62 32 9 60% 31% 9%
The pattern of ownership type and tenure shows that landlord ownership is more prevalent in
the Station District, while owner-occupancy is more prevalent in the West District. Figure 14
shows the percentages of 2- to 4-family houses in the Target Area owned by owner-occupants, local
landlords11 and absentee landlords12 as determined by the mailing address of the property owner, according
to City of Norwalk Tax Assessor data. Many streets in the Station District have high percentages of
absentee landlord ownership, while in the West District, properties are more likely to be owner-occupied.
11
Defined as absentee landlords with a mailing address in Norwalk, CT.
12
Defined as absentee landlords living outside of Norwalk, CT.
20Figure 14
Street # of % Owner % Local % Absentee Avg. Years
Properties Occupied Landlord Landlord Owned
Owned Owned
Chestnut Street 9 33% 33% 33% 16
South Main Street 14 21% 21% 57% 15
Concord Street 10 40% 50% 10% 13
Hanford Place 9 22% 56% 22% 16
Lowe Street 25 52% 32% 16% 13
Clay Street 3 33% 67% 0% 17
Gibson Court 3 33% 33% 33% 22
Flax Hill Road 11 64% 0% 36% 16
Hamilton Terrace 3 67% 0% 33% 14
Cleveland Terrace 7 100% 0% 0% 8
Lubrano Place 2 100% 0% 0% 33
Lexington Avenue 7 43% 43% 14% 14
Totals 103 47% 29% 24% 16
Ownership tenure in Target Area 2- to 4-family houses is often long, with the average period
of ownership being 16 years, but varies by ownership type. 2- to 4-family houses in the Target
Area are often held by individuals or in families for long periods of time, sometimes passed from one family
member to another. This pattern of long-term ownership is remarkably constant across the Target Area,
with only Cleveland Terrace notably showing a substantially shorter average period of ownership.
However, period of ownership varies by ownership, with local landlords holding properties for an average
of 18 years, owner-occupants for 14 years, and absentee landlords for 12 years.
The data suggest a pattern of owner-occupants becoming landlords over time. The deed
history shows that many of the owners in the Local Landlord category began as owner-occupants and later
moved to a different house within Norwalk while retaining ownership of their original house and renting
it as a landlord. This pattern helps explain the long tenure of Local Landlords, who held their property, on
average, much longer than either owner-occupants or absentee landlords. While owners in this category
hold the property for investment purposes, they likely have a greater concern for the property than an
outside investor, because they often still live nearby and may have an emotional connection to a property
in which they once resided. This translates often to better property maintenance and greater tenant
selectivity and oversight.
Ownership type varies by building type, with 2-family houses more likely to be held by
owner-occupants than 3- or 4-family houses, as well as by location. Figures 15 and 16 display the
percentages of 2-family and 3- or 4-family houses owned by owner-occupants, local landlords or absentee
landlords. 58 percent of 2-family houses are owned by owner-occupants versus 39 percent of 3- or 4-
family houses. The pattern also varies geographically: More 2-family houses are owned by landlords in
the Station District, while 3- and 4-family houses are more likely to be owned by owner-occupants in the
West District.
21Figure 15
2-Family Houses
Street % Owner- % Local Landlord % Absentee
Occupied Owned Landlord Owned
Chestnut Street 33% 33% 33%
South Main Street 50% 25% 25%
Concord Street 25% 50% 25%
Hanford Place 25% 50% 25%
Lowe Street 48% 33% 19%
Clay Street 50% 50% 0%
Gibson Court 0% 50% 50%
Flax Hill Road 100% 0% 0%
Hamilton Terrace 100% 0% 0%
Cleveland Terrace 100% 0% 0%
Lubrano Place 100% 0% 0%
Lexington Avenue 60% 20% 20%
Totals 58% 26% 16%
Figure 16
3- and 4-Family Houses
Street % Owner- % Local % Absentee
Occupied Landlord Owned Landlord Owned
Chestnut Street 33% 33% 33%
South Main Street 10% 20% 70%
Concord Street 50% 50% 0%
Hanford Place 20% 60% 20%
Lowe Street 75% 25% 0%
Clay Street 0% 100% 0%
Gibson Court 100% 0% 0%
Flax Hill Road 33% 0% 67%
Hamilton Terrace 50% 0% 50%
Cleveland Terrace 100% 0% 0%
Lubrano Place 0% 0% 0%
Lexington Avenue 0% 100% 0%
Totals 39% 32% 20%
22Demographic Profile of Purchasers of 2- to 4-Family Houses
The demographic trends in occupants and purchasers of 2- to 4-family houses in Greater South Norwalk
were analyzed to determine patterns in the ownership and occupancy that may indicate target populations
that are more likely to be interested in purchasing 2- to 4-family houses in Greater South Norwalk.
A greater proportion of White and Asian households and a lower proportion of Black or
African-American households occupy 2- to 4-family housing in Greater South Norwalk.
Figure 17 shows the proportion of Greater South Norwalk 2- to 4-family housing occupied by White,
Black, Asian, and Hispanic or Latino households compared against the South Norwalk population as a
whole, according to the 2006-2011 ACS. While the proportions of Hispanic or Latino households are
similar, Asian and White households are significantly more likely to reside in 2- to 4-family houses and
Black or African-American households are significantly less likely to reside in 2- to 4-family houses.
Figure 17
Occupancy By Race:
Greater South Norwalk 2- to 4-Family Housing
Compared to All Housing
60%
50%
40%
30% 2-4 Family Households
All Households
20%
10%
0%
White Black or African- Asian Hispanic or
American Latino
The occupants of Greater South Norwalk 2- to 4-family housing are younger than the
population of Greater South Norwalk as a whole. Figure 18 shows the age of householders living in
2- to 4-family housing in Greater South Norwalk compared to the Greater South Norwalk population,
according to the 2006-2011 ACS. Occupants of 2- to 4-family housing are more likely to be younger,
which may be partially because of the challenges of accessing 2- to 4-family houses at an older age.
Because 2- to 4-family houses are more likely to be older and do not contain elevators or handicapped
accessibility features, they are challenging for older individuals. Additionally, younger occupants may be
more tolerant of the inconveniences of aging 2- to 4-family houses, such as walk-up apartments with
narrow, steep stairs, lack of in-house laundry equipment, etc.
23Figure 18
Age of Householder: 2- to 4-Family Housing
Compared to All Housing
80%
70%
60%
50%
40% 2-4 Family Households
All Households
30%
20%
10%
0%
15-34 Years Old 35-64 Years Old 65 + Years Old
Most occupants of 2- to 4-family housing are renters. 83 percent of households occupying 2- to 4-
family housing in Greater South Norwalk are renters and they make up 37 percent of the renting
population of Greater South Norwalk, according to the 2006-2011 ACS.
Occupants of 2- to 4-family housing have a high housing cost burden and the 2- to 4-family
sector houses a large proportion of low-income families. Figure 19 compares the percentage of
household income spent on gross rent by renters of 2- to 4-family housing and all South Norwalk renters,
according to the 2006-2011 ACS. Occupants of 2- to 4-family housing spend a greater proportion of their
household income on rent, with a staggering 62 percent spending more than 35 percent of their income
on rent. Most government affordable housing programs limit the amount of income a tenant can pay
towards their rent at 30 percent. This may be because 2- to 4-family houses often house low-income
families: In a national study in 2002, 25.5 percent of non-governmentally assisted low-income households
were found to live in 2- to 4-family houses.14 Low-income families are more likely to spend a higher
percentage of their gross income on housing than higher-income families.
14
Millenial Housing Commission, Finance Task Force, Multifamily Rental Housing Background Paper by Shaun
Donovan, 2002. Cited in Mallach, 2007.
24Figure 19
Housing Cost Burden: Greater South Norwalk 2-
to 4-Family Housing Compared to All Housing
2-4 Family Households All Households
70%
60%
50%
40%
30%
20%
10%
0%
< 20% 20 - 24.9% 25 - 29.9% 30 - 34.9% 35% or more
Gross Rent as a Percentage of Household Income
The majority of purchasers of Greater South Norwalk 2- to 4-family houses between 2004 and
2012 were owner-occupants. Between 2004 and 2012, 180 2- to 4-family houses were purchased in
Greater South Norwalk, of which 117 (65 percent) were purchased by owner-occupants, according to
MLS and City of Norwalk Tax Assessor records. 15 Figure 20 shows the change in the percentage of
owner-occupants between 2004 and 2012. In the housing bubble leading up to 2007, a large majority of
purchasers were owner-occupants. However, from 2007 to 2009 the number of owner-occupants
declined dramatically, from 91 percent in 2006 to 50 percent in 2007. It is presumed that the sharp
reduction in mortgage financing impacted the ability of households to purchase 2- to 4-family houses for
occupancy. Additionally, many of the houses purchased between 2007 and 2009 were bought from
foreclosure sales, auctions or short sales, in which there is a large bias to cash buyers, who are generally
investors.
Anecdotal information gathered from interviews with realtors and mortgage lenders indicated that first-
time homebuyers may constitute an important cohort of 2- to 4-family owner-occupants. Because the
houses are among the most affordable in the City of Norwalk, they naturally appeal to first-time
homebuyers with more limited cash savings for a downpayment, and first-time homebuyers additionally
benefit from the rental income provided by the apartment unit(s). It is also common for 2- to 4-family
houses to serve as inter-generational housing, with multiple family members living separately in the
15
This is determined through review of the purchaser's mailing address. If an owner listed his/her mailing address as
the property address, he/she was presumed to reside at the property. It is acknowledged, however, that some
landlords use the property mailing address for government correspondence, but it is unusual.
25different apartments. One anecdote is that of a family living in Greater South Norwalk where the owners
live on the second floor, their daughter lives on the first floor and their son lives on the third floor. This
type of flexible, inter-generational housing is becoming increasingly popular, especially for families that
desire to house their aging parents in their residence.
Figure 20
Owner-Occupant / Landlord Purchases:
2004 - 2012
100%
90%
80%
70%
Percent of Total
60%
50%
40%
30%
20%
10%
0%
Sold Sold Sold Sold Sold Sold Sold Sold Sold
2004 2005 2006 2007 2008 2009 2010 2011 2012
Landlord 26% 35% 9% 50% 47% 53% 27% 37% 33%
Owner Occupant 74% 65% 91% 50% 53% 47% 73% 63% 67%
A large number of Greater South Norwalk 2- to 4-family houses are purchased by Hispanic or
Latino households, who also constitute a majority of the purchasers buying 2- to 4-family
houses for owner-occupancy. Of the 180 houses purchased between 2004 and 2012 in Greater South
Norwalk, 81 (45 percent) were purchased by Hispanic or Latino households, of which 68 (84 percent)
were purchased for owner-occupancy, as shown in Figures 21 and 22. 16 Hispanic or Latino households
comprised 58 percent of the purchasers of 2- to 4-family housing for owner-occupancy. The proportion
of Hispanic or Latino purchasers, however, peaked in the housing bubble years of 2004 to 2006 and has
not yet recovered to its prior amounts, dipping to only 28 percent of all 2- to 4-family houses purchased in
Greater South Norwalk in 2012. This is indicative of the difficulty that many households face in obtaining
mortgage financing. However, these data indicate that Hispanic or Latino households heavily impact the
Greater South Norwalk 2- to 4-family housing market.
16
The Study Team determined Hispanic or Latino ethnicity of the purchaser through a review of the names of the
purchaser, according to City of Norwalk Tax Assessor data.
26Figure 21
Hispanic / Non-Hispanic Purchasers of
Greater South Norwalk 2- to 4-Family
Houses: 2004 - 2012
100%
90%
80%
Percent of Total
70%
60%
50%
40%
30%
20%
10%
0%
Sold Sold Sold Sold Sold Sold Sold Sold Sold
2004 2005 2006 2007 2008 2009 2010 2011 2012
Non-Hispanic 57% 43% 43% 57% 76% 59% 55% 47% 72%
Hispanic 43% 57% 57% 43% 24% 41% 45% 53% 28%
Figure 22
Hispanic / Non-Hispanic Owner-Occupying
Purchasers of Greater South Norwalk 2- to
4-Family Houses: 2004 - 2012
100%
90%
80%
Percent of Total
70%
60%
50%
40%
30%
20%
10%
0%
Sold Sold Sold Sold Sold Sold Sold Sold Sold
2004 2005 2006 2007 2008 2009 2010 2011 2012
Non-Hispanic Owner-Occupant 47% 20% 48% 43% 67% 25% 38% 25% 67%
Hispanic Owner-Occupant 53% 80% 52% 57% 33% 75% 63% 75% 33%
27A large majority of owners of 2- to 4-family houses own one to three properties and most are
non-incorporated individuals or couples. Although outdated, the 1995 Property Owners and
Managers Survey (POMS) is the best source of national data on ownership and management practices of
the owners of 2- to 4-family houses. According to this study, approximately 70 percent of the owners of
2-family houses owned between 2 and 4 units (i.e. one or two buildings) and 71 percent of 3- or 4-family
house owners owned between 2 and 9 units (i.e. one to three buildings). 91 percent of 2-family owners
and 87 percent of 3- or 4-family owners were non-incorporated individuals or couples.17
Most owners of 2- to 4-family houses purchase for a long-term hold and many purchase the
property principally for use as a residence. According to the POMS, approximately 46 percent of 2-
to 4-family owners plan to hold their properties for five or more years and 30 percent purchase the
property principally as a residence. This is slightly below the percentage who buy principally for rental
income (33 percent).18
17
Mallach, 2007
18
Ibid
28Valuation of 2- to 4-Family Houses
The final section of this report presents two models for underwriting and valuing a 2- to 4-family house in
order to explore the factors that influence valuation of 2- to 4-family houses and the constraints faced by
prospective buyers of 2- to 4-family houses.
Within the 2- to 4-family market, there are substantial differences in who buys 2-, 3- or 4-family houses,
with 2-family houses more likely to appeal to owner-occupants and 3- and 4-family houses more likely to
appeal to investors. The data on purchasers of Greater South Norwalk 2- to 4-family houses between
2004 and 2012 bear this out:
Figure 23
2- to 4-Family Houses in Greater Percentage of Total Owner / Non-
South Norwalk Purchased 2004- Owner Occupied 2- to 4-Family
2012 for Owner / Non-Owner Houses in Greater South Norwalk
Occupancy by House Type Purchased 2004-2012 by House Type
Percent of Total
House Percent Owner- Percent Non- Percent of Total
Non-Owner-
Type Occupied Owner-Occupied Owner-Occupied
Occupied
2-Family 69% 31% 90% 64%
3-Family 33% 67% 8% 28%
4-Family 33% 67% 3% 9%
The valuation exercise looks at two hypothetical purchases:
Purchase of a 2-family house by an owner-occupant.
Purchase of a 3-family house by an investor owner.
Average sales and rents for 2- and 3-family houses in 2012 are used as the input for the analysis, derived
from the MLS. Taxes, insurance and maintenance costs were calculated from a variety of sources, and
mortgage underwriting terms were accessed from available online sources.
2-Family Purchase by Owner-Occupant
Below is an analysis of a sample purchase of a 2-family house by an owner-occupant, assuming one of the
units is rented at the average 2-bedroom rent.
1 Purchase Price $230,000 Average 2-family sales in 2012:
$228,867
2 2-BR Rent $1,370 Average 2-BR rental in 2012:
$1,368
3 Vacancy Loss Factor 10% Average for 2-family houses, per
Mallach, 2011
4 Broker's Commission $1,370 1 month's rent
5 Annual Operations & Maintenance $2,400 Estimate of annual maintenance
Expense expense, per Mallach, 2011
296 Annual Property Taxes $6,600 Average for 2-family houses on
MLS, 2012
7 Annual Insurance Premium $700
8 Mortgage Interest Rate 3.125% Obtained from Fairfield County
Bank website*
9 Mortgage Term (Years) 30 ""
10 Maximum Mortgage Amount $225,834 "", Includes $3,884 MIP
11 Mortgage Amount net of MIP $221,950 10 - $3,884 MIP
12 Closing Costs $3,345 Estimated
13 Capital Improvements Needed $10,000 per Mallach, 2011
Calculation of Income Eligibility /
Return
14 Gross Rental Income $16,440 2 x 12 months
15 Less Vacancy Loss ($1,644) 3 x 14
16 Effective Gross Income $14,796 14 + 15
17 Broker's Commission ($1,370) 4
18 Less Operating & Maintenance Expenses ($2,400) 5
19 Less Property Taxes ($6,600) 6
20 Less Insurance Premium ($700) 7
21 Less Replacement Reserve Escrow ($500)
22 Total Expenses ($11,570) 17 + 18 + 19 + 20 + 21
23 Annual Net Operating Income (NOI) $3,226 16 + 22
24 Monthly Mortgage Payment $967 PMT(8,9,10)
25 Minimum Yearly Income Needed to $38,697 Assumes PMT max is 30% of
Support Mortgage Payment gross income
26 Cash needed at Sale $21,395 1 - 11 + 12 + 13
27 Cash on Cash Return 15%** 23 / 26
* Assumes 30-year, fixed-rate FHA loan with owner-occupant (www.fairfieldcountybank.com)
** Note: This calculation assumes the borrower is able to pay the principal and interest due on the
mortgage and that the cash flow is applied to the cash paid at acquisition.
The analysis indicates that an average 2-family house in Greater South Norwalk would be affordable to a
qualified purchaser with an income as low as approximately $39,000 at current interest rates and
underwriting terms. The buyer could additionally earn approximately $3,200 in cash flow annually from
the operations of the second unit, although an important caveat is that operating expenses are variable and
can fluctuate greatly, especially if the owner has a non-paying tenant whom he must evict a tenant or must
make a costly repair in one year. Note that the amount of borrowing capacity a given household has
within its annual income is limited by its existing debts, i.e. a household earning $40,000 per year may not
be able to qualify for a loan if it has a existing debts, such as car loans, credit card debts and/or student
loans. However, the analysis indicates that the purchase of 2-family houses is within reach for many
prospective homeowners.
Purchasers of 2-family houses for owner-occupancy may be motivated by a variety of reasons, but research
indicates that financial factors are most prominent. A national survey of owners of 2- to 4-family houses
30found that the leading reason for purchasing a 2- to 4-family house was "for rental income" (32.8%),
followed closely by "as residence" (29.2%) indicating that the cash flow appeal of 2- to 4-family houses
may overshadow the interest in having a place to live. However, this also indicates that a substantial
portion of 2- to 4-family owners are "inadvertent" landlords who buy primarily for a place to live.
Owners of 2- to 4-family houses must be willing to take on basic property management and maintenance
tasks and often spend their own time at the property to avoid incurring expense, with 48.2% spending
between one and eight hours per week managing their property (median: 3.9 hours per week).19 As
referenced earlier, most 2- to 4-family house owners hold and plan to hold their properties for a long time.
The above analysis shows that, for the typical buyer, a 2-family house can provide an affordable residence
as well as a potential source of cash flow. While the initial motivation may be the former and not the
latter, some owner-occupants discover an aptitude for real estate and purchase other, nearby multifamily
houses or move out to another house while continuing to manage their original house as an absentee
landlord.20 Other owner-occupants are attracted by the prospect of cash flow. Mallach found in his study
of 2- to 4-family owners in New Jersey that ownership often follows ethnic groups, with patterns of, for
example, ownership by Puerto Rican families in one locality, that create informal associations of landlords
to share knowledge and socialize. In these communities, owning a 2- to 4-family house represents a path
to building wealth and savings.
3-Family Purchase by Investor
Below is an analysis of a sample purchase of a 3-family house by an investor, assuming two 2-bedroom
units and one 3-bedroom unit. There are several important differences from the owner-occupancy model,
which are described more fully below.
1 Purchase Price $266,000 Average 3-family sales in 2011-
2012: $266,243
2 2-BR Rent $1,370 Average 2-BR rental in 2012:
$1,368
3 3-BR Rent $1,700 Average 3-BR rental in 2012:
$1,694
4 Vacancy Loss Factor 10% Average for 3-family houses, per
Mallach, 2011
5 Broker's Commissions $2,740 2 units x 1 month's rent
6 Annual Operations & Maintenance $9,000 Estimate of annual maintenance
Expense expense, per Mallach, 2011
7 Annual Property Taxes $6,600 Average for 3-family houses on
MLS, 2011-2012
8 Annual Insurance Premium $1,000
19
Mallach, 2007. Data from 1995 POMS.
20
Ibid.
319 Mortgage Interest Rate 3.375% Obtained from Fairfield County
Bank website*
10 Mortgage Term (Years) 30 ""
11 Maximum Mortgage Amount $199,500 75% Loan-To-Value
12 Closing Costs $3,453 Estimated
13 Capital Improvements Needed $20,000 per Mallach, 2011
Calculation of Income Eligibility /
Return
14 Gross Rental Income $53,280 Assume 2x 2-BR units and
1x 3-BR Unit
15 Less Vacancy Loss ($5,328) 4 x 14
16 Effective Gross Income $47,952 14 + 15
17 Less Broker's Commissions ($2,740) 5
18 Less Operating & Maintenance Expenses ($9,000) 6
19 Less Property Taxes ($6,600) 7
20 Less Insurance Premium ($1,000) 8
21 Less Replacement Reserve ($3,000)
22 Total Operating & Maintenance Expenses ($22,340) 17 + 18 + 19 + 20 + 21
23 Annual Net Operating Income (NOI) $25,612 16 + 22
24 Annual Mortgage Payment ($10,584) PMT(9,10,11)
25 Net Cash Flow $15,028 23 + 24
26 Cash needed at Sale $89,953 1 - 11 + 12 + 13
27 Cash on Cash Return 17% 25 / 26
The investor model differs from the owner-occupancy model in the following ways:
The debt parameters are stricter: The maximum Loan-To-Value ratio is 75%, which caps the
mortgage at an amount lower than what the cash flow could support. This increases the investor's
cash need at the closing to approximately $90,000 and limits the pool of potential buyers.
Lenders often require a personal guarantee and/or a strong borrower balance sheet for investment
loans, which further limits the pool of buyers.
Operating Expenses are assumed to be higher, due to the need for property management services,
which owner-occupants generally do not utilize.
Purchasers of 3-family houses for investment generally fall into one of four categories, according to
Mallach: Rehabbers, Flippers, Milkers, and Holders.21 Of these, the data on the Greater South Norwalk
2- to 4-family houses indicate that the most prevalent is likely the Holder, which is an investor who
purchases for long-term cash flow and capital appreciation. This is because the underlying economic
fundamentals of purchasing a 2- to 4-family house in Greater South Norwalk are sound, as described
above. Over time, a savvy operator of multifamily housing in Greater South Norwalk can earn a cash flow
21
Mallach, 2011
32profit. Holders are most similar to owner-occupants in motivation, often holding the property for a long
time and maintaining a basic standard of care to ensure the property will continue to be rented. The data
presented here on the long average hold time and large proportion of locally-residing landlords confirms
this point.
However, there is evidence that the Greater South Norwalk 2- to 4-family housing market was influenced
by Flippers during the period from 2004 to 2007. During this period, some properties transacted multiple
times and/or sold to absentee landlords. Additionally, many of the 2- to 4-family houses sold in
foreclosure auctions from 2008 to 2010 were purchased by investors who flipped the property within one
to two years for an increased sales price.
There are two other factors that complicate the acquisition of multifamily houses:
Much of the 2- to 4-family housing for-sale inventory since 2008 has been short sales and
foreclosures. These properties are typically difficult, if not impossible to purchase with mortgage
financing. Foreclosure sales require an all-cash, as-is closing, which greatly limits the pool of
potential purchasers, even if the underlying economics of the properties support a leveraged
acquisition.
The models include an assumption for capital improvements, which may be required in many of
the 2- to 4-family houses available for sale, but actual amounts vary by building. Mallach, in his
analysis of the New Haven multifamily investment market, assumed an average cost of $10,000 to
$20,000 of investment required in most 2- to 4-family houses.22
The Bottom Line
The feasibility analysis indicates that the relationship between rent amounts, sales prices and debt
underwriting terms in the current Greater South Norwalk 2- to 4-family market is sound. Prices appear to
be in line with rents and a qualified and effective purchaser / operator could potentially turn a profit from
the cash flow of a 2- or 3-family house. 2-family houses are a feasible option for owner-occupants and
may be affordable to a qualifying household earning as little as $40,000. However, there are other factors,
such as foreclosure / short sale limitations and capital needs, that may limit the pool of potential owners
and investors.
22
Ibid.
33Conclusion - Next Steps
This report constitutes a detailed evaluation of the existing conditions within the 2- to 4-family housing
market in Greater South Norwalk and the Target Area. The investigation has found that the 2- to 4-
family housing market in Greater South Norwalk and the Target Area has special characteristics that
differentiate it from the general housing market in Norwalk, as follows:
Properties are older than other housing in Norwalk.
Pricing in the Greater South Norwalk 2- to 4-family housing market is more volatile.
The Greater South Norwalk 2- to 4-family housing market has been heavily impacted by
foreclosure activity, which continues to dominate the sales market even today, either through
short sales or foreclosure auctions.
Owner-occupancy remains the most prevalent form of ownership, particularly among 2-family
houses, however investors play an important role in the market. Owners tend to hold properties
for a long time, in many cases starting as owner-occupants and becoming absentee landlords when
they move to another house while still retaining their 2- to 4-family house.
2- to 4-family houses in Greater South Norwalk appeal to specific demographic groups, with
purchases by Hispanic households for owner-occupancy being an important recent trend.
2- to 4-family houses in Greater South Norwalk constitute an important part of the City of
Norwalk's unassisted affordable housing and can be a feasible and affordable route to
homeownership for moderate-income households. However, occupants of 2- to 4-family housing
in Greater South Norwalk are more likely to pay a disproportionately high share of their
household income towards housing costs.
The policy implications of these findings are numerous and suggest a number of policy steps. The
following are a series of recommended next steps that we believe will respond to the findings of this
analysis and will assist in stabilizing and improving the market for 2- to 4-family houses in the Target Area:
1. Develop financing programs that target the specific challenges faced by prospective
purchasers of 2- to 4-family houses. This analysis found that the 2- to 4-family housing
market is heavily affected by the lingering effects of the national foreclosure crisis, with as many as
65 percent of the inventory of 2- to 4-family houses being short sales, bank REOs, or foreclosure
auctions. These types of sales often impose stringent and difficult conditions upon buyers and the
brokerage community alike, including:
a. Large cash deposit requirements.
b. Difficulties in financing the purchase. Lenders will typically not lend to borrowers who
looking to purchase a home from a foreclosure auction. In a short sale situation,
prospective buyers sometimes have difficulty obtaining third-party property condition
reports and/or must purchase as-is, which may cause lenders to refrain from making loans
for the purchase.
c. Requirements of immediate financing availability, as the timelines for short sales and
foreclosure sales is sometimes brief.
34You can also read