Coronavirus Potential economic impact of the - Why the SONA of 2020 is important for agricultural trade - National Agricultural Marketing Council
←
→
Page content transcription
If your browser does not render page correctly, please read the page content below
Potential economic
impact of the
coronavirus
outbreak

Why the SONA of
2020 is important for
agricultural trade

Non-tariff measures
of critical importance
for South Africa’s
agricultural trade
within Africa
FOREWORD

Welcome to issue number 80 of the Trade Probe publication produced under the Markets and Economic
Research Centre (MERC) of the National Agricultural Marketing Council (NAMC). The purpose of this issue
is to provide a detailed analysis of the general issues and opportunities that affect agricultural trade in South
Africa and the region. This include, the potential economic impact of the coronavirus outbreak; the recent code
of restricting marketing for alcoholic beverages; non-tariff measures of critical importance for South Africa’s
trade, and lessons learned from SONA 2020. The objective of the publication is to inform policymakers,
producers, traders and other stakeholders about the market opportunities and potential products demanded
in the local and international markets.

THIS ISSUE OF TRADE PROBE COVERS THE FOLLOWING TOPICS:
Trade Analysis
1. Why the State of the Nation Address of 2020 is important for agricultural trade
2. Non-tariff measures of critical importance for South Africa’s agricultural trade within Africa
3. The recent code of restricting marketing for alcoholic beverages: What is the impact on the agricultural
   sector?
4. Potential economic impact of the coronavirus outbreak: South Africa’s wool exports

Trade Opportunities
5. Global and local trade performance of frozen chicken (HS: 020712)
6. South Africa’s plum market and opportunities in the United Kingdom (UK)
7. Berry (HS 081040) market trends and opportunities

Trade News
8. Gulfood is a valuable source of trade leads for SA companies
9. Reduction in the rate of customs duty on wheat and wheaten flour in terms of the existing variable tariff
   formula
10. Minister Didiza updates the public on the unbanning of auctions and measures to prevent the spread of
     FMD in the country

CONTRIBUTORS:
Dr Sifiso Ntombela
Dr Moses Lubinga
Ms Fezeka Matebeni
Ms Onele Tshitiza
Mr Thabile Nkunjana
Ms Zosuliwe Kala
Mr Lucius Phaleng

2
TRADE ANALYSIS
Why the State of the Nation Address of 2020 is important for
agricultural trade
								                                                                                     By Onele Tshitiza

The president of South Africa, Mr Cyril Ramaphosa,        if the incidence of load-shedding persists. The
delivered the State of the Nation Address (SONA)          SONA speech raised the hopes of many businesses
in Parliament on Thursday 13 February. The                and municipalities when the president announced
president spoke of the challenges affecting the           that the state would open up the energy sector to
country, including the stagnant economy, power            allow independent power generators and good-
outages, gender-based violence against women,             standing municipalities to produce and distribute
and youth unemployment. By recognising these              their own renewable electricity. This is a critical
challenges, the president’s speech aimed to address       subject because it affects all households and all
employment issues, especially for the youth, while        businesses, including agriculture. Agriculture uses
targeting structural reforms required to revive the       electricity across the value chain, from pumping
economy. National policy plays a significant role in      water for irrigation, through to washing, sorting and
either an enabling or disabling environment for local     packaging.
trade, as well as cross-border trade. Where there
are policies in place to support local producers and      The president announced the finalisation of the
facilitate trade, local businesses’ disposition in both   Climate Change Bill in a bid to establish a low-
the local and global markets may improve and be           carbon economy. This bill would help to manage
competitive, which will boost trade and the economy       the effects of climate change, which we have been
while creating employment opportunities.                  experiencing in recent years. This is particularly
                                                          important for agriculture because research shows
SONA’s focus on agriculture                               that agriculture contributes 7 % to greenhouse gas
Agriculture relies heavily on energy and electricity,     emissions in South Africa. The whole agricultural
and the recent cases of load-shedding have had a          industry will need to be prepared for such a policy
negative knock-on effect on agricultural growth. The      change as it will require new investment in green
Council for Scientific and Industrial Research (CSIR)     technologies and a move towards Climate-Smart
estimated that load-shedding robbed the economy           Agriculture (CSA). The Department of Agriculture,
of about R59 billion in 2019 and this could double        Land Reform and Rural Development, together

                                                                                                              3
with other stakeholders, is already championing whereby the industry claimed that frozen chicken
this project. Investment in low-carbon technologies meat cuts were driving prices down and leading
could bring more foreign investment into the country, to some 50 000 jobs losses. Imported volumes of
build confidence, and support local producers who Gallus domesticus increased by 20 % from Brazil
are adopting climate-smart technologies. and 212 % from the United States of America (USA)
between 2014 and 2018 (ITC, 2020). An annual
An equally important statement in the speech for duty-free import quota of 65 000 tons of frozen bone-
agriculture was the issuing of water use licences, in chicken imports from the USA was imposed as
which the president said will now take 90 days to be an agreement between South Africa and the USA to
issued, compared to taking years as was previously manage imports. However, the poultry industry is still
the case. This is a fundamental factor of production battling to cope with the competition. The average
in the agricultural sector, where new entrants to import tariff faced by the USA and Brazil in South
farming previously struggled to gain licences to Africa is 28.5 %, which is no different from most
use water for their production activities. This will be countries outside the Southern African Development
helpful for farmers, especially for export-oriented Community (SADC) region.
farmers in the fruit and vegetable industries, which
require an adequate and reliable water supply to Furthermore, the African Continental Free Trade
produce good-quality exportable products. Area (AfCFTA) Agreement came into effect this
year, and discussions on tariff concessions are
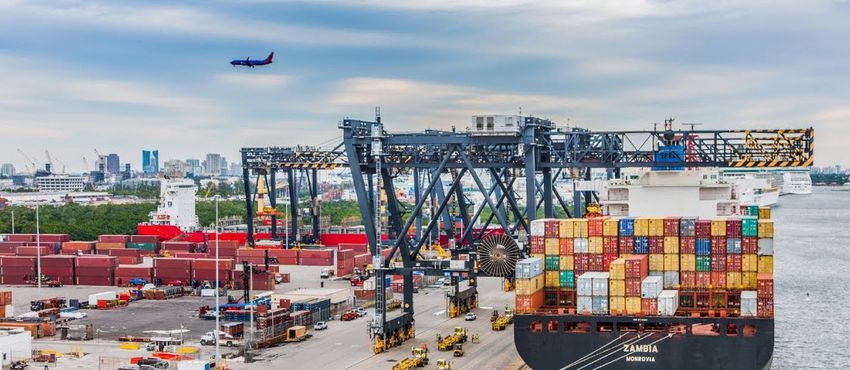
The restoration of the Durban port is also a welcome underway. The opening up of the African market is
investment, as large containers with agricultural a massive opportunity for South Africa, given that
goods are exported through that port, given that Africa has one of the youngest and fastest growing
it is one of the busiest in the southern region. The populations in the world. South Africa exported 40
Durban port is said to handle 80 million tons of cargo % of its agricultural products to the African region in
per annum. Wheat, maize, soybean meal, animal 2018.
feed and wood chips are stored and exported
through this port. However, in the past few years, Conclusion
the port has experienced delays which have led to The core of the SONA related to changing the growth
economic losses for the country. The restoration trajectory of the economy by opening up the energy
of the Durban harbour will increase the capacity, sector, reducing unemployment and improving
shorten the time and hopefully include sophisticated the competitiveness of economic sectors such as
systems which will allow for all products to be more agriculture and manufacturing through equitable
easily transported. access to land and water rights, and the restoration
of infrastructure. The SONA also restated the
The other good news is for the poultry industry, importance of agriculture in growing the economy by
which the president said will set a new poultry import providing the envisioned course of action to address
tariff adjustment to support local farmers. This the key challenges that the sector is facing. This will
comes after increased imports from the Americas not only improve local production and trade, but will
contributed to stringent competition for the sector, also improve the capacity to export across borders.
Author: Ms Onele Tshitiza is an economist under the Trade
Research Unit at the National Agricultural Marketing Council. She
can be contacted at otshitiza@namc.co.za or (012) 341 1115.
4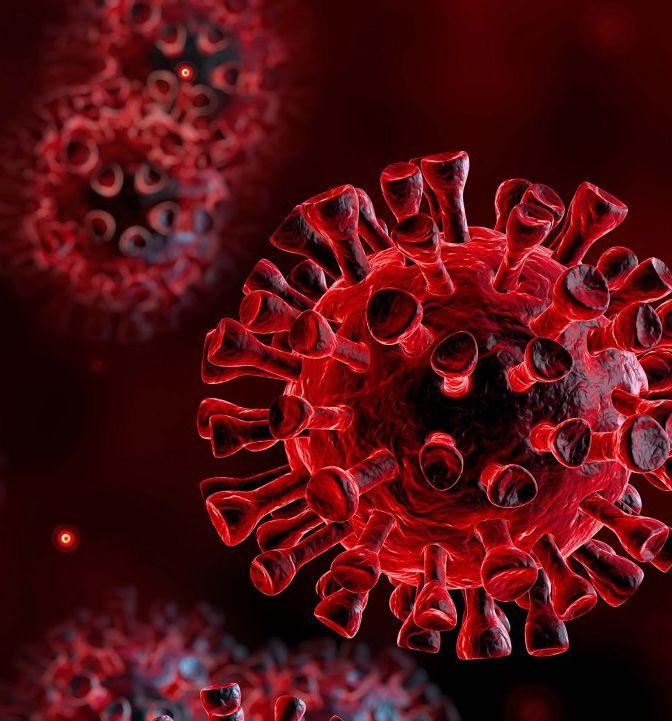
Non-tariff measures of critical importance for South Africa’s
agricultural trade within Africa
									                                                                                          By Moses Lubinga

With the recent enactment of the African Continental            trade is highly characterised by a large number of
Free Trade Area (AfCFTA) Agreement, expectations                TBTs, followed by SPS measures and export-related
are high that intra-Africa trade will flourish. However,        measures.
it is important to caution that the anticipation
of intra-Africa trade blossoming should not be                  With regard to TBTs, Zimbabwe is the most
overestimated given that it will not come to fruition           restrictive with 407 technical requirements that must
within a short timeframe due to several outstanding             be met, followed by Mauritius (358 requirements)
glitches, such as agreeing on tariff concessions                and Ethiopia (213 requirements), while Niger has
and addressing issues pertaining to the Rules of                registered one technical requirement. With regard
Origin (RoO), among others. Tariff-related issues               to SPS measures, the most restrictive countries
can ably be addressed within the medium term (3-5               include Mauritius, Morocco, Zimbabwe, Algeria
years). In contrast, non-tariff-related challenges,             and Ethiopia in that order, each with more than 100
including poor infrastructure, the unharmonised                 SPS requirements that must be met for agricultural
technical requirements for products, and the poorly             products to gain access to these markets. The most
co-ordinated trade protective measures across                   affected products are live animals and products
countries can only be adequately addressed in the               under HS codes 02 and 03, and to some extent
long term (10 years and more).                                  products under HS code 22 (prepared foodstuff like
                                                                beverages, spirits…). In the case of products with
This article provides insight into the key non-tariff           some form of agro-processing, the general aspects
measures (NTMs) affecting South Africa’s agricultural           relating to the packaging materials used, the labelling
trade performance within Africa. Particular attention           on the packaging containers, the declaration of the
is paid to technical barriers to trade (TBTs), sanitary         additives used, and the minimum acceptable levels
and phytosanitary (SPS) measures and export-                    of certain types of chemicals such as melamine and
related measures. These measures were derived                   phosphorus are critical.
from official regulations implemented by countries
across the continent. These NTMS are broadly                    In the case of export-related measures, Africa as a
categorised as SPS measures, TBTs, pre-shipment                 whole has 925 requirements that must be met. Still,
inspections, contingent trade protective measures,              Ethiopia accounts for the largest number (139) of
export-related measures, price control measures                 export-related measures, followed by Cameroon (90
(including additional taxes and charges), and other             measures) and Tunisia (87 measures). Measures
restrictive measures including quotas, prohibitions,            in this category are related to the prevention and
and quantity control other than TBT or SPS                      control of animal diseases and the specifications of
measures. South Africa’s intra-Africa agricultural              agricultural products, among others.

                     Author: Dr Moses Lubinga is a senior economist under the Trade
                     Research Unit at the National Agricultural Marketing Council. He can
                     be contacted at hlubinga@namc.co.za or (012) 341 1115.

                                                                                                                      5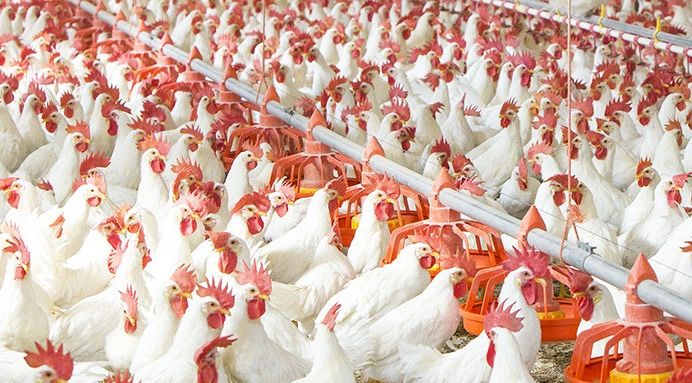
In conclusion, TBTs impacting on intra-Africa           and “vegetable products”. Therefore, there is a need
agricultural trade are highest in “prepared foodstuff   for the governments of African states to work closely
(beverages, spirits …)” followed by “vegetable          with the private sector in agriculture to harmonise
products” while SPS measures are also highest in        regulations across regional economic communities
“prepared foodstuff” followed by “live animals and      (RECs) and the continent at large to reduce non-
products” and “vegetable products”. Export-related      tariff barriers (NTBs) to trade, as this will greatly
measures are highest in “live animals and products”     foster smoother intra-Africa agricultural trade.

6
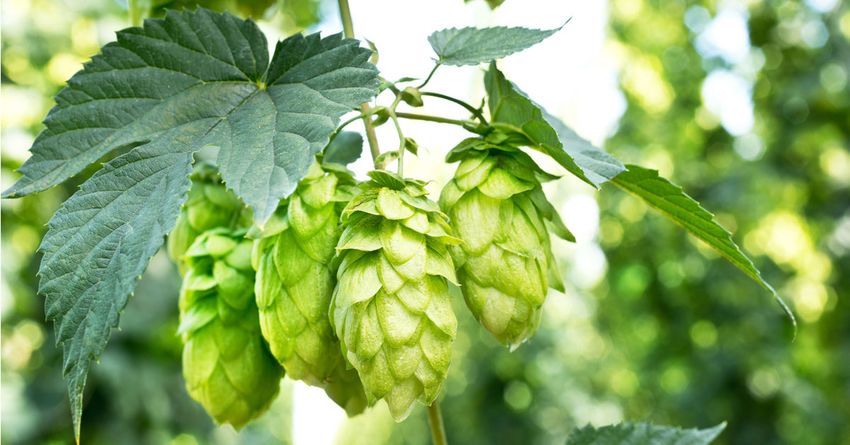
The recent code of restricting marketing for alcohol beverages:
What is the impact on the agricultural sector?
									                                                                                     By Fezeka Matebeni

Alcoholic beverages (beer, wine and spirits) are               spirits (17.8 %). One in every third man drinks beer
some of South African’s favourite drinks. Alcohol, in          traditionally in South Africa. Women drink much less
general, is an ancient drink accidentally discovered           (13.7 litres) alcohol than their male counterparts
around 3200 BC by pre-agricultural cultures. The               (37.5 litres).
production of alcoholic beverages then required only
the presence of a straightforward organic process of           The excessive and chronic consumption of alcohol
fermentation. Virtually all cultures have used these           is commonly known for its harmful effects. On 28
beverages through most of their recorded history.              January 2020, Aware.org and its counterparts
The importance of these beverages became central               launched a restriction on the marketing of alcohol.
in the most valued personal and social ceremonies,             There have been ongoing debates between the
such as initiations, marriages, feasts, medicine,              alcohol industry and the various national departments
worship, hospitality and peace-making, to name a               amidst proposed legislation that aims to restrict the
few. For example, red wine in a religious perspective          marketing of liquor products, seeking to ensure that
was and still is perceived by most Christians as               commercial alcohol communication is conducted in
symbolising the blood of life. Alcoholic beverages             a manner which neither conflicts with nor detracts
were also used as the best medicine available for              from the need for responsibility and moderation in
some illnesses and especially for relieving pain.              liquor merchandising and consumption, and which
                                                               does not encourage consumption by underage
Attempting to control the illegal use or                       persons. This code complements the regulatory
abuse of alcohol in South Africa                               requirements that already exist in South Africa.
Around 31 % of the population (15 years and older) in          One of the regulations is the Liquor Act (Act 59 of
South Africa consumes alcohol. The country is rated            2003), which regulates the distribution of alcoholic
as one of the highest pure alcohol consumers in the            beverages on a wholesale level by registering/
world. Individuals use alcohol for various reasons             licensing manufacturers and distributors. Such
– the majority of South Africa’s drinkers see it as a          regulations are in place to regulate the legal and
relatively inexpensive, effective relaxant and as an           responsible consumption of alcohol.
important accompaniment. South Africa’s drinking
population consumes an average of 29.9 litres of               How will this restriction on the advertising
pure alcohol per capita annually, with a daily intake          of alcohol affect the agricultural sector?
of 64.6 grams of alcohol. Most South African citizens          The production of alcoholic beverages is primarily
(56 %) consume beer, followed by wine (18.5 %) and             sourced in various crops (grains and horticulture).

                     Author: Ms Fezeka Matebeni is an economist under the Agro- Food
                     Chain Unit at the National Agricultural Marketing Council. She can
                     be contacted at fmatebeni@namc.co.za or (012) 341 1115.

                                                                                                                   7
The new restriction on the advertising of alcohol might cause a reduction in sales of alcohol, mainly in the
local retail outlets (e.g. shebeens, taverns and shisanyama establishments). However, this might not have a
significant impact on the industry as a whole. South Africa has a relatively open international trade market for
alcohol. In particular, South Africa exports a great deal of wine to Europe. South Africa also has significant
trade links with its neighbouring countries, especially Namibia. It is noteworthy that South Africa imports small
quantities of alcohol from neighbouring countries. The only exception is Namibia, from where South Africa
imports large quantities of alcohol, mainly beer, to meet the local demand. This means that alcohol will be
available and accessible in the right targeted markets. In general, the agricultural sector will not be affected
by this new development. I also believe that there are more opportunities to be unlocked in this industry.
However, the promotion of alcohol-free or non-alcoholic beverages may not create the same demand as
alcoholic beverages due to different tastes and preferences and its use for recreational purposes.

Conclusion
Alcoholic beverages are intended to be consumed for recreational purposes during celebrations, but in many
instances, alcohol has been and continues to be abused. In a nutshell, this new code for responsible alcohol
consumption will have a minimul effect on agriculture production and other related industries. The shift to
non-alcoholic or alcohol-free beverages will not happen overnight, but will serve a valuable purpose in future,
especially for the coming generation.

8
Potential economic impact of the coronavirus outbreak: South
Africa’s wool exports
									                                                                                  By Lucius Phaleng

Coronaviruses were identified in the mid-1960s and are known to infect humans and a variety of animals.
Since 2002, two coronaviruses infecting animals have evolved and caused infections in humans. Recently,
China experienced a coronavirus (CoV) outbreak which was first reported by the World Health Organization
(WHO) on 31 December 2019. Coronavirus is a large family of viruses that cause illnesses ranging from the
common cold to more severe diseases such as Middle East Respiratory Syndrome (MERS-CoV) and Severe
Acute Respiratory Syndrome (SARS-CoV). CoV can be transmitted between animals and people and it can
give rise to a variety of symptoms in different animals. Some strains cause diarrhoea in livestock such as
pigs and turkeys, among others. The coronavirus affects the agricultural sector, especially the livestock sub-
sector, because animals are also affected. This article is motivated on the fact that there is an expectation
that the coronavirus outbreak could disrupt trade by China’s trading partners, and its aim is to analyse the
possible impact of coronavirus from South Africa’s perspective.

Globally, China is one of the main contributors to the global economy and trade; therefore, its contribution is
beneficial to all countries. Approximately 16 % and 15 % of the worldwide gross domestic product (GDP) and
manufacturing output respectively are a contribution from China. South Africa and China have been working
together to expand trade relations, and these, to some extent, have led to increased trade between these
two countries. China is the top importer from and top exporter to South Africa and is considered the fastest
growing trading partner. In 2019, South Africa exported about R136 billion worth of agricultural products to
the world market, 5.8 % of which was imported by China. Figure 1 highlights China’s demand for agricultural
products from South Africa and globally. China’s demand for agricultural products from both South Africa and
the world has been growing. However, South Africa has shown negative growth, due to a decline in South
Africa’s exports of wool, nuts and sugar cane as the most demanded commodities.

Figure 1: China’s agricultural demand from global markets and South Africa
Source: TradeMap (2020)

                 Author: Mr Lucius Phaleng is an economist under the Trade
                 Research Unit at the National Agricultural Marketing Council. He can
                 be contacted at lphaleng@namc.co.za or (012) 341 1115.

                                                                                                              9
The coronavirus pandemic has suddenly become a serious concern to the economies of China, South Africa
and the world. The global economic impact of Covid19 is expected to be substantially more significant than
that of SARS, primarily because China has gone from being a small player in the global economy in the
2000s to an economic powerhouse today. According to the World Trade Organization (WTO), the outbreak
of coronavirus is set to further weaken global trade growth. Therefore, the coronavirus is expected to reduce
real worldwide GDP, and the demand for exports might decline. Countries that are heavily dependent on
imports from China will be profoundly impacted. According to the World Bank, South Africa’s economic growth
forecast is below 1 % for the year 2020. The initial forecast was 1.4 %, but this was later reduced to 0.9 %
growth due to electricity issues. Therefore, there is an expectation that the CoV outbreak might reduce South
Africa’s real GDP due to the belief that China might reduce demand for exports.

Figure 2 highlights the agricultural products that China mainly imports from South Africa, the demand for
which might be affected by the coronavirus. South Africa must plan for alternative markets for these products
in the event of global trade being affected. China is the sixth-largest importer of South Africa’s agricultural
exports, accounting for about 5.76 %. Additionally, South African exporters need to redirect their agricultural
exports to other competitive markets such as the Netherlands, Botswana, Namibia, the United Kingdom (UK)
and Mozambique.

 Figure 2: China’s agricultural imports from South Africa by product
 Source: TradeMap (2020)

In conclusion, the coronavirus outbreak poses uncertainties for the global trade of agricultural products and
there is fear among trading countries of the further spread of the virus. South Africa has already faced
challenges such as drought and foot-and-mouth disease (FMD), which affected agricultural production and
exports. The coronavirus outbreak will likely have an adverse economic impact. The troubled Chinese econ-
omy will result in the decline of South Africa's agricultural exports, which might affect the local economy. It is
important to explore potential markets that South Africa can consider in case Chinese imports are negatively
affected.

10
TRADE OPPORTUNITIES

Global and local trade performance of frozen chicken (HS: 020712)
								                                                                                        By Zosuliwe Kala

Introduction                                                largest supplier of poultry products to South Africa.
The poultry industry is a vital subsector within South      Imports of poultry have also been reported as a
African agriculture, contributing more than 16 % to         major source of risk for local producers.
the agricultural gross value-added. Poultry meat
remains the primary affordable protein source for           Global trade overview of frozen chicken
many South African consumers as opposed to pork,            Table 1 below shows the world’s leading exporters
beef and mutton.                                            of frozen chicken between 2009 and 2018 measured
                                                            in thousand tons. Global exports showed a negative
South Africa is unable to produce sufficient quantities     growth rate of 6 % between 2009 and 2018.
of broiler meat to satisfy the demand. Since 2010 the       Furthermore, data reveals that Brazil is the largest
industry has been struggling to recover from the rising     exporter of frozen chicken globally, and exported
feed costs. The growth in chicken consumption has           1109 thousand tons in 2018, owning a share of 55
been addressed through increased imports rather             % in the world’s exports. Turkey, France, Ukraine
than domestic production. As a result, the poultry          and Poland had a share of 13 %, 6 %, 5 % and 3
industry is faced with numerous challenges that             % respectively. Of the top 10 leading exporters, five
constrain its competitiveness and growth potential.         experienced a negative growth rate. Nevertheless,
The primary difficulties pertaining to the industry are     Russia showed the highest positive growth rate of
rising feed costs, import penetration, rising electricity   2313 %, followed by Ukraine (1038 %), Poland (563
tariffs, access to reliable supply, exchange rate           %), Turkey (359 %), and then Spain at 138 %. It
fluctuations, and access to finance. Currently, the         can be noted that there were no African countries
poultry industry is struggling to remain competitive,       amongst the top 10 leading exporters of frozen
with large quantities of chicken meat being dumped          chicken. South Africa is a small player in the world
in the market by other countries at prices far below        market and was ranked 14th in the world’s exports
the cost of local production. Brazil is by far the          of frozen chicken with a global share of 1 % in 2018.

Table 1: World’s leading exporters of frozen chicken, 2018
                        Exported volumes in ‘000 Tons                Share (%)             Growth rate (%)
Exporters               2009                    2018                 2018                  2009-2018
World                   2119                    2002                 100                   -6
Brazil                  1398                    1109                 55                    -21
Turkey                    58                      266                13                    359
France                  206                      123                 6                     -40
Ukraine                   8                      91                  5                     1038
Poland                    8                     53                   3                     563
Argentina               94                      43                   2                     -54
Netherlands             45                      36                   2                     -20
Spain                   13                      31                   2                     138
Belgium                 30                      30                   2                     -0.6
Russia                   1                      24                   1                     2313
Source: TradeMap (2020)

                                                                                                               11
The world’s imports of frozen chicken have increased over the past few years. Table 2 shows the world’s
leading importers of frozen chicken between 2009 and 2018 measured in thousand tons. The world’s imports
increased from 1791 to 2106 thousand tons, representing a positive growth rate of 17 %. Saudi Arabia was
the largest importer of frozen chicken amounting to 446 thousand tons, accounting for a share of 21 % in
2018. Iraq has been ranked as the second-largest importer of frozen chicken with a share of 12 %, followed
by the United Arab Emirates (UAE) (10 %), South Africa (8 %), Angola and Kuwait both with a 5 % share,
Yemen (4 %), and Libya, Oman and Qatar with a share of 3 %. South Africa showed the highest positive
growth rate of 706 % in the period between 2009 and 2018. This can be associated with the fact that chicken
is the first choice of meat for many South Africans, coupled with the fact that the domestic supply does not
sufficiently meet the demand.
Table 2: World’s leading importers of frozen chicken, 2018
Exported volumes in ‘000 Tons Share (%) Growth rate (%)
Importers 2009 2018 2018 2009-2018
World 1792 2106 100 17
Saudi Arabia 494 446 21 -10
Iraq 0 248 12 100
UAE 0 207 10 100
South Africa 22 178 8 706
Angola 41 96 5 134
Kuwait 67 95 5 42
Yemen 108 91 4 -16
Libya 0 68 3 100
Oman 129 65 3 -50
Qatar 371 53 3 -86
Source: TradeMap (2020)
South Africa’s trade overview of frozen chicken
Although South Africa has a negative trade balance on poultry meat, the country exports some poultry meat
mostly to SADC member countries. Figure 3 shows the share of leading importers of South Africa’s frozen
chicken. Mozambique was the largest importer of frozen chicken in 2018 with a share value of 29 %, followed
by Lesotho (16 %), Botswana and Namibia both at 13 %, Eswatini and Zambia both at 9 %, Zimbabwe (8 %)
and the Democratic Republic of Congo (DRC) at 3 %.
Author: Ms Zosuliwe Kalais is a junior economist under the Trade
Unit at the National Agricultural Marketing Council. She can be
contacted at kala@namc.co.za or (012) 341 1115.
12Figure 3: South Africa’s main export destinations for frozen chicken, 2018
Source: TradeMap
Figure 4 below illustrates the share of South Africa’s leading suppliers of frozen chicken. South Africa
imported 1778 tons of frozen chicken in 2018, with Brazil being the maian supplier accounting for an 86
% share of all frozen chicken. This is associated with the fact that Brazil produces large volumes of cereal
grains and oilseeds, thereby reducing the cost of feeds used for poultry farming. In addition, poultry farming is
subsidised by the Brazilian government. However, Argentina and Thailand increased exports to South Africa
in the absence of many European Union (EU) nations, with a share of 6 % and 4 % of imports respectively,
followed by Ireland (2 %), Denmark and Poland owning a share of 1 %.
Figure 4: South Africa’s leading suppliers of frozen chicken, 2018
Source: TradeMap
13Conclusion In a global context, South Africa’s poultry industry is struggling to remain competitive. The sector came under pressure with the extension of the African Growth Opportunity Act (AGOA) in 2015 from the USA. Poultry producers have been under pressure for some time following significant increases in the prices of poultry feeds, which account for approximately 70 % of broiler production costs. The industry is experiencing high fluctuations in production costs due to exogenous factors such as climate change, which manifested in the form of the recent drought. Also, the fluctuation in the South African exchange rate makes it difficult for producers to do proper planning. As a result, South Africa is not producing enough to meet the demand, hence, the country is a net importer of frozen chicken. Brazil remains South Africa’s leading supplier of frozen chicken. 14
TRADE OPPORTUNITIES

South Africa’s plum market and opportunities in the United
Kingdom (UK)
									                                                                                      By Mr Thabile Nkunjana

The South African deciduous fruit industry needs                  exported. The UK is the leading market for South
no introduction to the global market, as it is export             Africa’s plum exports and for that reason, this article
oriented in the setting. The sector is made up of table           seeks to explore market opportunities for plums
grapes (31 %), apples (28 %), pears (15 %), peaches               exported by South Africa to the UK. Competitors are
(11 %), plums (7 %), apricots (5 %), nectarines (3                analysed and compared in terms of market share,
%) and cherries (Theron, 2013). Fruit consumption                 growth rate and quantity.
varies from country to country depending on various
factors, including the buying power. Generally,                   Global overview of plums and sloes
lower- and middle-income countries like South                     For countries to remain competitive in this highly
Africa consume fewer fruits compared to high-                     globalised market, they must continuously monitor
income countries. This is not necessarily because                 the overall global market changes and position
they cannot produce fruits, but because consumers                 themselves accordingly. Table 3 below presents
tend to prioritise staple crops. Developed countries              the leading plum- and sloe-exporting countries
in Europe and the United Kingdom (UK), for                        across the globe for the period 2010 and 2018.
example, consume higher quantities of fruits, thus                Data from the ITC shows that global exports more
demanding more, possibly because vast quantities                  than doubled between 2010 (R5 billion) and 2018
of fruit are processed, leaving a smaller proportion              (11.1 billion) growing at a rate of 121.6 % over that
for consumption as fresh fruits. South Africa’s                   period. Chile is in the lead, boasting a share value
fruit exports are mainly in their unprocessed state               of 20.5 %, representing a growth rate of 174.6 %.
or dried, while low volumes are processed and                     In second place is Spain, followed by South Africa,

                  Author: Mr Thabile Nkunjana is a junior economist under Agro Food
                  chain unit at the National Agricultural Marketing Council. He can be
                  contacted at thabile@namc.co.za or (012) 341 1115.

                                                                                                                       15
Hong Kong, and the United States of America (USA), having a global share value of 12.1 %, 10 %, 9.1 % and
7.2 % respectively. To show that the worldwide demand for plums and sloes has increased, all the top eight
exporting countries report increased exports above 60 % except for USA exports, which grew at a rate of 39.1
%. China’s growth rate increased by close to 1300 % from 2010 to 2018.
Table 3: World’s leading plum and sloe exporters
Exporters Exported value in 000 (R) Share in value (%) Growth rate (%)
2010 2018 2018 2018
World 5,034,995 11,159,894 100 121.6
Chile 832,937 2,287,593 20.5 174.6
Spain 829,956 1,347,695 12.1 62.3
South Africa 443,270 1 116 602 10 151.9
Hong Kong, China 185,836 1 012 839 9.1 445.0
USA 578,849 805 194 7.2 39.1
Italy 442,286 761 179 6.8 72.1
Netherlands 348,767 628 424 5.6 80.1
China 38,007 530 546 4.8 1295.9
Source: ITC (2020)
Table 4 presents the major importers of plums and sloes. China tops the list with a global market share to
the value of 4.1 %, representing a growth rate of 581.0 % between 2010 and 2018. Notably, China’s growth
rate is close to five times the global growth rate (129.5 %). China is followed by Hong Kong, the Netherlands,
the UK and Germany, with a market value share of 5.4 %, 8.6 %, 11.4 % and 6.5 % respectively. The UK
registered a 35.7 % growth rate amongst the top eight importers, but it has the biggest share value in the
world. Russia has the second biggest market share in terms of value, but its growth rate is rather low (29.9
%). South Africa’s plum exports to Russia have noticeably been increasing. The USA has a market share
value of 6.5 %.
Table 4: World’s leading plum and sloe importers from 2010 to 2018
Importers Imported value in 000 (R) Share in value (%) Growth rate in value (%)
2010 2018 2018 2018
World 5,563,440 12,768,767 100 129.5
China 227,196 1,547,295 4.1 581.0
Hong Kong 298,684 1,331,330 5.4 345.7
Netherlands 478,916 876,818 8.6 83.1
United Kingdom 634,471 861,058 11.4 35.7
Germany 481,248 837,570 8.7 74.0
USA 360,114 745,274 6.5 106.9
Russia 570,467 741,193 10.3 29.9
Brazil 236,255 510,415 4.2 116.0
Source: ITC (2020)
South Africa’s plum and sloe exports are global in reach and Table 5 below presents the top market destinations
between the years 2010 and 2019. The Netherlands and the UK are the two major markets for South African
plums and sloes with a market share of 34.7 % and 19.9 % in value terms respectively, with the Netherlands
growing at 105.3 % and the UK at 62.6 %. However, the United Arab Emirates (UAE) and the Russian
Federation are currently proving to be promising markets for SA’s exports. Of course, in terms of share value,
the Russian Federation is considerably lower, but its growth rate (1668.5 %) is mouthwatering with only a 5
% tariff applied. The UAE is also offering some room for exports and it can reach second place with a rate
of 328.4 %, with the share value of South African plum exports having grown considerably compared to the
62.6 % of the UK and the 104.0 % of the Netherlands. Additionally, a preferential tariff of 0 % for plums from
South Africa to the UAE is applied.
16Table 5: South Africa’s leading market destinations for plums and sloe from 2010 to 2019
Importers Exported value in 000 (R) Share in value (%) Growth rate in value (%)
2010 2019 2019 2019
World 443,270 904,528 100 104.0
Netherlands 152,727 313,561 34.7 105.3
UK 110,428 179,635 19.9 62.6
United Arab Emirates 29,954 128,354 14.2 328.4
Russian Federation 2,361 41,755 4.6 1668.5
Saudi Arabia 19,393 37,295 4.1 92.3
Malaysia 11,602 31,262 3.5 169.4
Source: ITC (2020)
Global market access depends on various factors, from trade agreements to colonial ties, and these vary
across the globe. Figure 2 below presents the top plum- and sloe-exporting countries to the UK from the
year 2015 to 2019. South Africa’s main exporting competitor for the UK market is Spain and Italy to a certain
extent. Spain exported 16 969 tons in 2015 and 18 838 tons in 2016 compared to 14 301 tons in 2015 and 14
900 tons in 2016 for South Africa. In 2017 South Africa surpassed Spain’s exports for the first time since 2004
and exported 15 376 tons compared to 14 739 tons for Spain and it has since remained the biggest plum and
sloe exporter even though Spain closed in during 2019. Chile is a notable exporter and it has a preferential
trade agreement with the UK, with 0 % tariff applied to its exports. Germany also exports plums and sloes to
the UK, but it is not a strong contender within the UK market, although it is gradually increasing.
Figure 5: Leading plum- and slo- exporting countries to the UK between 2015 and 2019
Source: ITC (2020)
Concluding remarks
South Africa has enjoyed a reasonably reliable market in the UK over the years. The consistency in the market
share shows this fact and the rate at which it has grown in value with exported quantities over the years.
However, drought persistence in South Africa might prove costly in future as consistency in supply is very
important. Spain and Italy are proving to be regular competitors for the UK market with distance proximity in
their favour. South Africa needs to avoid this where possible. Chile has a preferential trade agreement with
the UK and a 0 % tariff is applied to its exports, the same as South Africa.
In contrast, for Spain, Italy and Germany the EU 0 % rate applies until the end of the year because of Brexit
– until the EU and UK can resolve their trading issues, with implementation possibly coming into effect in the
next marketing season. South Africa has a marginal advantage over Chile when it comes to distance, but
deteriorating infrastructure in South Africa is quickly becoming a concern. For now, South Africa still holds its
position firmly in the UK while expanding its footprint across the globe.
17Berry (HS 081040) market trends and opportunities
By Zosuliwe Kala
Introduction Global perspective on blueberries
Berries such as cranberries and blueberries have Due to increasing demand, the supply volumes for
been labelled as superfoods with numerous health cranberries and blueberries are growing. As a
benefits, improving the demand globally as they result of changing global consumption patterns,
are rich in fibre, vitamin C and flavonoids. Other improving technology, and expanding production,
health benefits include reduced belly fat, improved cranberries and blueberries are fast becoming
blood sugar control, increased body mass, popular in the global markets. Global trade in
prevention of heart disease, cancer and other cranberries and blueberries increased by 46 %
chronic diseases, lowered blood cholesterol, between 2015 and 2018. A total of 5.4 million tons
reduced inflammation, improved memory, balance of cranberries and blueberries were exported in
and eyesight, and prevention of urinary tract 2018. Figure 5 depicts the world’s leading
infections. Last year during the agribusiness exporters of cranberries and blueberries measured
transformation conference of the African Farmers’ in tons. Chile was the largest exporter of
Association of South Africa (AFASA), Minister cranberries and blueberries, constituting 21 % of
Thoko Didiza emphasised identifying new markets the world’s berry exports as of 2018, followed by
and expanding markets for our agricultural goods Canada (19 %) and Peru (13 %). The other
through achieving economic growth, unlocking job countries that made it to the top of the list of
creation and bringing about transformation in the leading exporters were Spain (11 %), the United
economy. Hence this article seeks to explore States of America (USA) (7 %), the Netherlands (6
market trends and opportunities for the berry %) and Mexico (4 %). South Africa was ranked
industry, particularly blueberries. number 12, contributing 1 % to the world’s berry
exports.
Figure 6: World's leading exporters of cranberries and blueberries, 2015 - 2018
Source: TradeMap (2020)
18Berries are also fast-growing and high-value products in the global fruit market. Table 4 below illustrates
the leading importers of cranberries and blueberries between 2014 and 2018. The imports of blueberries
increased significantly by 197 % between 2014 and 2018. The world value of imports amounted to R560
million as of 2018. The USA was ranked as the leading importer of berries, accounting for a 45 % share,
followed by the UK (9 %), the Netherlands (8 %), Canada (8 %), Spain (3 %), China (3 %), Hong Kong (2 %),
France (2 %), and Poland (2 %).
Table 6: World’s leading importers of cranberries and blueberries
Importers Exported volumes in tons Share (%) Growth (%)
2014 2018 2018 2014-2018
World 189 561 197
United States of America 102 252 45 148
United Kingdom 12 48 9 303
Netherlands 3 43 8 1 141
Canada 39 43 8 11
Germany 6 43 8 651
Spain 1 17 3 2 569
China 0 15 3 3 811
Hong Kong, China 1 13 2 2 122
France 2 10 2 469
Poland 1 8 2 667
Source: TradeMap (2019)
South Africa’s exports of cranberries and blueberries
South Africa’s berry industry is export oriented with almost half of the berries destined for the international
markets. Out of all the different berries grown in South Africa, blueberries dominate the market and comprise
74 % of the area planted. Over the last 10 years, fresh blueberries from South Africa have gained popularity
in international markets due to their outstanding high quality. As a result, South Africa was ranked number
12 amongst the world’s leading exporters. It is worth noting that cranberry and blueberry production has
experienced exceptional growth in the past few years and this is reflected in the growth of South Africa’s
cranberry and blueberry exports. As such, in 2019 a total of 13 064 tons of cranberries and blueberries
produced in South Africa were exported, translating into a 62 % growth rate as compared to the previous
season. Figure 7 highlights the export destinations for South Africa’s cranberries and blueberries measured
in tons. The UK has always been a growing and important export market destination for South Africa’s
cranberries and blueberries, commanding a 44 % share, followed by the Netherlands (32 %), Germany (9 %)
and Ireland (3 %).
Author: Ms Zosuliwe Kalais is a junior economist under the Trade
Unit at the National Agricultural Marketing Council. She can be
contacted at kala@namc.co.za or (012) 341 1115.
19Figure 7: World’s leading importers of South Africa’s cranberries and blueberries Source: TradeMap (2020) Conclusion South Africa’s berry industry should further diversify its export markets as the demand for the product keeps on increasing. On the other hand, blueberries can be grown in most parts of the country, coupled with the fact that South Africa produces blueberry varieties that are highly in demand in China. The shorter transit to China as compared to South American countries exporting their products to China presents an advantage for South Africa. South Africa does not have access to the major consuming markets like China and Korea. Therefore, market access strategies should consider the berry industry as a priority and take advantage of this booming market while creating jobs in the process. 20
TRADE NEWS

Gulfood is a Valuable Source of Trade Leads for SA
Companies

The Marketing Manager of Fresh Produce                East is an important market for the industry and is
Exporters’ Forum (FPEF), Ms Marletta Kellerman        also important for the South African fresh fruit and
says the Gulfood exhibition is a source of valuable   vegetable industry to have a strong presence in the
trade leads that can assist the South African         Gulfood as all their competitors are attending the
companies to pursue further export opportunities in   show. “Due to strong competition in the Middle
the Middle East. Kellerman was speaking on the        East it is important to have the industry present at
sidelines of the Gulfood exhibition taking place in   this show and not to miss out on any opportunities
Dubai, United Arab Emirates. FPEF is a voluntary,     offered by this platform. Our driving force is to
non-profit organisation with more than 140            promote the South African fresh fruit and vegetable
members, accounting for about 90% of fresh fruit      industry and our members at Gulfood Dubai,”
exported from South Africa. FPEF members consist      added Kellerman. She emphasised that the FPEF
of fruit and vegetable exporters, producer-           was a pivotal link between government and the
exporters, export and marketing agents, pack          industry regarding market access and related
houses, logistics and other service providers. The    matters. She said more than anything, the FPEF
Forum role is to provide leadership and services to   intended to create value for its members to help
our members, the international buying community       ensure a profitable, sustainable and globally
and the fresh produce export industry as a whole,”    competitive fresh produce export industry.
said Kellerman. According to Kellerman, the Middle

By DTI (https://www.thedti.gov.za/editmedia.jsp?id=7159)
                                                                                                        21
TRADE NEWS
Reduction in the rate if customs duty on wheat and wheaten flour
in terms of the existing variable tariff formula
The international trade administration commission of south Africa (ITAC) considers adjustments
in the customs duty on wheat, once the conditions for adjustment are met. In terms of the last
reviewed and approved variable tariff formula for wheat, conditions for a downward adjustment
in the tariff were met and the South African grain information service (SAGIS) forwarded a letter
of confirmation to this effect. Wheat price information, confirmed by the SAGIS, indicated that
conditions for a downward adjustment in the customs duty were met on 05 November 2019,
when the 3-week moving average of the US No. 2 HRW (ORD) gulf settlement price for wheat
triggered an adjustment at US$215.67/ton. The corresponding rand/US dollar exchange rate
was R14.7391 to US$1.00. if the domestic reference price, the 3-week moving average gulf
settlement price, the R/US$ exchange rate on 05 November 2019 and the latest available
REER, are supplied to the formula, the customs duty on wheat needs to be adjusted downwards
from 100.86c/kg to 77.62c/kg. As the customs duty on wheaten flour is set in the form of a
specific duty at the level of 150% of the rate applicable to wheat, the customs duty on wheaten
flour also needs to be reduced from 151.29c/kg to 116.44c/kg. In light of this, the commission
recommends that the rate of customs duty on wheat and wheaten flour, classifiable under tariff
headings 1001.9 and 1101.00, be reduced from 100.86c/kg and 151.29c/kg to 77.62c/kg and
116.44c/kg, respectively.
By ITAC (http://www.itac.org.za/upload/Minute%2010%20of%202019.pdf)
22TRADE NEWS
Minister Didiza updates the public on the unbanning of auctions
and measures to prevent the spread of FMD in the country
Agriculture, land reform and rural development minister Thoko Didiza, has on the 17 February
2020, announced that the blanket ban on gatherings animals is now lifted, since the outbreak
of the FMD three months ago in the Molemole district in Limpopo. The minister said, there are
preconditions for the resumption of auctions. Auctions will only be conducted under stringent
conditions. All livestock agents must be registered with the agricultural produce agents’ council.
The minister further emphasized that agents already registered with APAC and complaint to the
rules in respect of livestock agents as published in government gazette 41473 board notice 28
of 2018 may proceed with auctions. The lifting the temporary ban on gatherings of animals, is
NOT implying that such activities are safe. Therefore, the Minister is advising all auctioneers to
familiarise themselves with their implementing measures to prevent their animals from becoming
infected. These include: • Not moving high risk animals, such as animals showing signs of
disease,; animals from unknown origin or animals originating from known infected areas; • Only
buying animals from known and proven sources; • Insisting of buyers to be supplied with a
veterinary health declaration before animals are brought onto their farms; • Always placing new
arrivals in isolation until you can satisfy yourself of their health status.
“I wish to remind all livestock keepers of their responsibilities in terms of Section 11 of the Animal
Diseases Act, 1984 that any owner or manager of land on which there are animals
take all reasonable steps to prevent the infection of the animals with any animal disease, or
parasite and the spreading thereof from the relevant land or animals,” said Minister Didiza.
By DAFF (https://www.gov.za/speeches/minister-didiza-updates-17-feb-2020-0000)
23REFERENCES Hall, J.N.; Moore, S.; Harper, S.B. & Lynch, J.W. (2009). Global variability in fruit and vegetable consumption. Ameri- can Journal of Preventive Medicine, 36(5): 402-409. Hortgro (2018). Key deciduous fruit statistics 2018. Available online at https://www.hortgro.co.za/wp-content/uploads/ docs/2019/08/2018-stats-booklet_key-deciduous_web-pdf-revised.pdf Theron, K.I. (2013). The South African Deciduous Fruit Industry. Acta Hortic. 1007: 873-879. Available online at https:// doi.org/10.17660/ActaHortic.2013.1007.104 24
18
                                                                                            ER 20
                                                                                        VEMB
                                                                                 75 | NO
                                                                         ISSUE

                                            orting
                                       Supp owing
                                            g r             y
                                       an d           dustr
                                               ilk in
                                        the m                                 cellen
                                                                                     t
                                                                        an ex xporters
                                                               offers          e
                                                  P ro tocol cerne hay                        ers th
                                                                                                     e
                                               d
                                         Signe unity for L
                                                                 u                     te alt
                                                                                clima roduction
                                         oppo
                                               rt                        ces &           p
                                                            r p re feren ion of fruit
                                                     ume               osit
                                              Cons             comp
                                                                                  red
                                                                            factu
                                                                      manu
                                                         fi le of un
                                                d e pro
                                            Tra
                                                    co
                                            tobac
                                                                                                         1

                                                                  For correspondence:

                                                                   Dr. Sifiso Ntombela
                                                                   sifiso@namc.co.za
                                                                   +27 (0) 12 341 1115

                                        For article contribution to the Trade Probe:
                                                     Mr. Lucius Phaleng
                                                   lphaleng@namc.co.za
                                                     +27 (0) 12 341 1115

                                                                   Designed by
                                                               Mr Sylvester Moatshe
                                                              Smoatshe@namc.co.za
                                                                 +27 (0) 341 1115

                          © 2020. Published by the National Agricultural Marketing Council (NAMC).
                                                           DISCLAIMER
   Information contained in this document results from research funded wholly or in part by the NAMC acting in good
 faith. Opinions, attitudes and points of view expressed herein do not necessarily reflect the official position or policies
of the NAMC. The NAMC makes no claims, promises or guarantees about the accuracy, completeness or adequacy of
the contents of this document and expressly disclaims liability for errors and omissions regarding the contents thereof.
 No warranty of any kind, implied, expressed or statutory, including but not limited to the warranties of no infringement
of third-party rights, title, merchantability, fitness for a particular purpose or freedom from computer virus, is given with
respect to the contents of this document in hardcopy, electronic format or electronic links thereto. Any reference made
  to a specific product, process or service by trade name, trademark, manufacturer or other commercial commodity or
      entity is for information purposes only and does not imply approval, endorsement or favouring by the NAMC.
You can also read