Availability and sustainable provision of biofuels under Annex IX Part B (biodiesel from used cooking oil and animal fat)
←
→
Page content transcription
If your browser does not render page correctly, please read the page content below

Availability and sustainable provision of biofuels
under Annex IX Part B
(biodiesel from used cooking oil and animal fat)
Nabil Abdalla, Horst Fehrenbach

Heidelberg, September 2020

ifeu Wilckensstraße 3 D - 69120 Heidelberg Tel.: +49 (0)6 221. 47 67 - 0 Telefax +49 (0)6 221. 47 67 - 19 E-Mail ifeu@ifeu.de www.ifeu.de
On behalf of the Federal Ministry for the Environment, Nature Conservation
and Nuclear Safety, Germany

IMPRESSUM

Authors:           Nabil Abdalla, Horst Fehrenbach

Publisher:         ifeu – Institut für Energie- und Umweltfor-
                   schung Heidelberg GmbH
                   Wilckensstr. 3, D-69120 Heidelberg

Completion:        2020

Picture Credits:   © GborLstvn/adobestock.com

37 Pages
Table of contents

1 Starting point and objective                                             4

2 Relevance of biofuels under Annex IX Part B of RED II for Germany        6

3 Quantities and utilization of UCO in Germany, Europe and non-European
  export countries                                                        10
   3.1 UCO Collection                                                     10
   3.2 UCO quantities in Germany                                          11
        3.2.1    Domestic origin                                          11
        3.2.2    Imports of UCO                                           13
   3.3 UCO quantities in EU countries                                     15
   3.4 Quantities in the main non-European export markets                 17
        3.4.1    People's Republic of China / South East Asia             18
        3.4.2    USA                                                      19

4 Potentials to increase UCO collection in Germany                        21
   4.1 Value chain of a household UCO collection                          21
   4.2 Household UCO collection – Examples of Best Practice               22
        4.2.1    Belgium                                                  22
        4.2.2    The Netherlands                                          23
        4.2.3    Austria                                                  24

5 Significance of biofuels based on category 1 and 2 animal fats          27
   5.1 Problem definition                                                 27
   5.2 Quantities and destinations of animal fats in Germany and the EU   28
        5.2.1    Germany                                                  28
        5.2.2    Europe                                                   29
   5.3 Importance of biofuels based on category 1 and category 2 animal
       fats in the EU                                                     29
        5.3.1    Produced volumes                                         29
        5.3.2    Price relations                                          31
   5.4 Possible consequences of an eligibility towards the GHG quota in
       Germany                                                            31

6 Summary                                                                 33

7 Bibilography                                                            35

8 Appendix                                                                37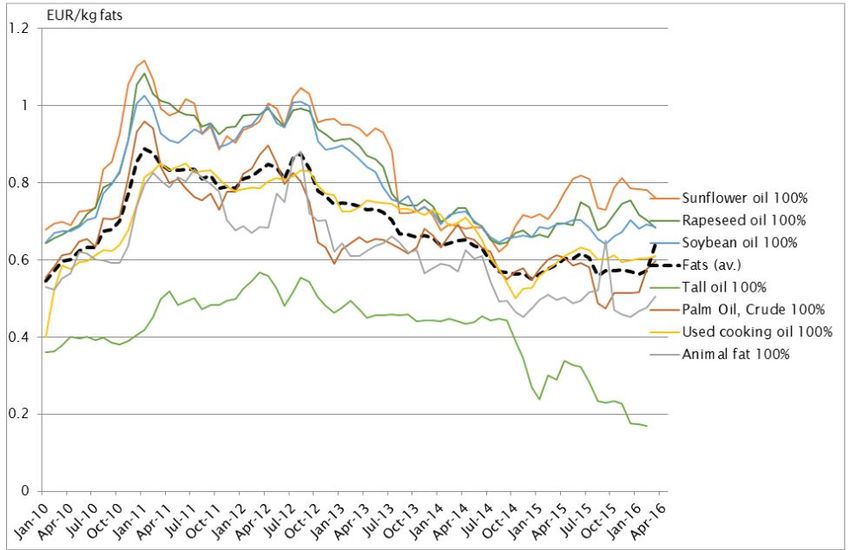
Table of contents

 8.1 UCO Market composition in the Netherlands   37
4 Availability and sustainable provision of biofuels under Annex IX Part B ifeu 1 Starting point and objective The Federal Republic of Germany views climate change as a key challenge of the 21st cen- tury. By ratifying both, the Kyoto Protocol as well as the Paris Climate Convention, Germany committed to a profound and comprehensive decarbonisation of its economy and society. Compared with the reference year 1990, the past 30 years have seen some progress. Espe- cially in the electricity sector, which has successfully reduced its emissions per kilowatt-hour by 32% compared to 1990, the “Energiewende” (Germany’s transition to a sustainable en- ergy sector) is showing first results (Icha & Kuhs, 2019). Both the relative share of renewa- bles has risen from 3.4% in 1990 to around 42% today (2019), and the associated emissions from the electricity sector have fallen by 93 million tons (Umweltbundesamt, 2020) (Icha & Kuhs, 2019). In contrast, the transport sector is stagnating at a similar level to 1990. Technological ad- vances, especially in the area of drivetrain efficiency, have been offset by an increased de- mand for transport, which is increasingly concentrated on roads. The renewable share of final energy consumption in the transport sector is also stagnating at around 5.5%. Accord- ing to the second iteration of the Renewable Energies Directive (EU 2018/2001, hereinafter RED II), this share is to rise to 14% by 2030. While the majority of renewables in the transport sector constituted of conventional biofuels, their share will be heavily regulated in future and limited to a maximum of the share in 2020 plus 1 percentage point, but not more than 7% in total. RED II thus follows the EU's iLUC Directive (Directive (EU) 2015/1513), which, for the first time, takes into account the concerns of conventional biofuels with regard to indi- rect land use changes and associated environmental problems. The fuels listed in Annex IX, Part B, have a special role to play in meeting RED II targets in the transport sector. These include biofuels based on used cooking oil (hereinafter referred to as UCO) and biofuels based on animal fats of categories 1 and 2 of Regulation (EC) No 1069/20091. Due to their classification as residues or wastes, biofuels based on UCO or ani- mal fats achieve very high specific greenhouse gas (GHG) savings. Furthermore, both are considered to be raw materials with a low iLUC risk. Nevertheless, RED II also provides for a 1.7% cap on the fuels listed in Annex IX Part B. However, RED II further states that, at the request of a Member State and with appropriate justification, higher shares are possible. However, unlike conventional biofuels, the cap is not based on environmental concerns. On the contrary, the aim is to prevent these coveted residues from third countries from being siphoned off. Currently, less than 20% of the raw materials listed in Annex IX Part B come from domestic European collection. A large proportion is increasingly being imported from South-East Asian countries, which have their own climate targets to meet. Competition for use cannot therefore be ruled out. In addition, the traceability of the origin and thus sus- tainability of the derived fuel in global supply chains represents a challenge. 1 According to EC 1069 / 2009, there are, in total, three categories of animal fats. Category 3 animal fats are of higher quality and are therefore preferred for other uses.
ifeu Availability and sustainable provision of biofuels under Annex IX Part B 5
This study will therefore examine the following aspects:
1) What is the relevance of biofuels under Annex IX Part B for Germany?
2) How are the quantities and utilization of UCO in Germany, Europe and the main
non-European export countries structured?
3) What is the availability of UCO in the main non-European export markets China,
USA, Malaysia and Indonesia? Will / Do imports from these markets lead to compe-
tition of use?
4) Is there potential for an increase of UCO collection in Germany?
5) What significance can biofuels based on animal fats of categories 1 and 2 have for
Germany? What is their emergence and whereabouts in Europe to this date? How
are the consequences of implementing an eligibility of these biofuels to the GHG
quota?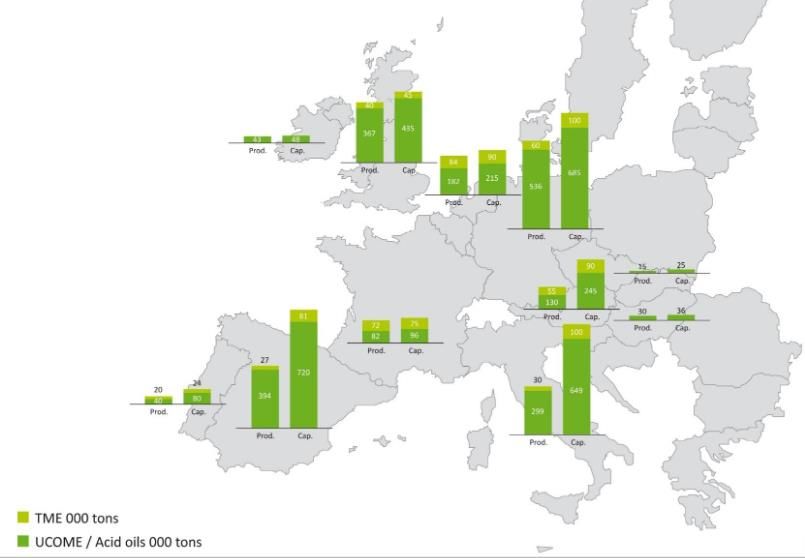
6 Availability and sustainable provision of biofuels under Annex IX Part B ifeu 2 Relevance of biofuels under Annex IX Part B of RED II for Germany This chapter analyses the role and relevance of biofuels under Annex IX Part B for Germany. In the pan-European context, Germany is the largest consumer of fuels in the transport sec- tor. Around 1/6 of total energy consumption in the transport sector in the European Union was consumed in Germany (EUROSTAT, 2020) (see Figure 1 below, for reference). With the United Kingdom's withdrawal from the EU, Germany's market share in the EU 27 is projected to increase to almost 20 %. German (bio)fuel policy thus has a decisive influence on the Eu- ropean market. Figure 1: Fuel consumption in transport of selected EU Member States. Own presentation according to (EUROSTAT, 2020) The German market share is even larger in the biodiesel and especially UCO-ME sector. Ger- many's share of the UCO-ME market in 2018 was around 43 PJ, with 97 PJ in the EU as a whole, or 44% (BLE, 2020) (Flach, Lieberz, & Bolla, 2019). However, it should be noted that the demand for UCO-ME in 2018 has risen sharply, compared to previous years. In 2017, there was demand for around 32 PJ UCO-ME. The exact development can be seen in Figure 2 below.
ifeu Availability and sustainable provision of biofuels under Annex IX Part B 7 * Adjusted import mix (cf. chapter 3.3) Figure 2: UCO Biodiesel demand in Germany from 2013 to 2018. Own presentation according to (BLE, 2019) and (BLE, personal communication, 2020) Although various scenarios on the development of final energy consumption in Germany's transport sector forecast a decline in the period from 2020 to 2030 across all scenarios (a comparison of six common scenarios can be seen in Figure 3). However, it can be assumed that Germany will remain the largest and therefore most important fuel market in the EU in 2030. Moreover, the assumption of a decreasing final energy consumption in Germany has further implications with regard to the fulfilment of RED II. If the UCO-ME volume reported in 2018 is taken as the status quo, the relative share of UCO-ME in final energy consumption in road and rail transport increases from 1.8% in 2020 to 2% in 2026 and finally to around 2.2 % in 2030. This would require a corresponding approval by the European Commission. Figure 3 summarises the developments described above.
8 Availability and sustainable provision of biofuels under Annex IX Part B ifeu Figure 3: Development of final energy consumption of German road and rail transport 2020 – 2030 according to a selection of scenarios; Own presentation. If Germany complies with the 1.7 % cap for UCO based fuels according to RED II, the quantity of these fuels placed on the market would have to fall from the current level of around 42 PJ to 33 PJ (see Figure 4). This would entail a decrease of about 25 %, with corresponding ef- fects on the UCO-ME economy in Germany and, to a lesser extent, Europe. In short: Germany is the largest fuel market in the EU and, with regard to the utilization of UCO as a fuel, is of far above average significance. With today's quantities of UCO-based biofuels, Germany would already exceed the limit of 1.7 % of RED II for biofuels according to Annex IX Part B and even with constant quantities, the excess would continue to increase. Therefore, there is a need for action.
ifeu Availability and sustainable provision of biofuels under Annex IX Part B 9
45
40
35
30
in PJ p.a.
25
20
15
10
5
0
2020 2022 2024 2025 2026 2028 2030
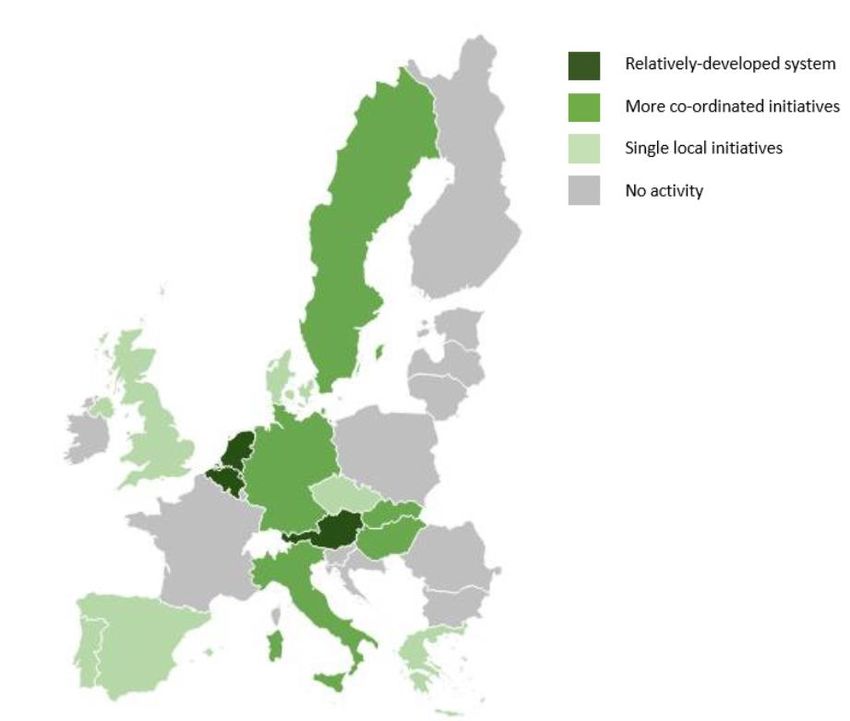
Figure 4: Development of absolute UCO-ME quantities for quota fulfilment according to RED II in Germany.10 Availability and sustainable provision of biofuels under Annex IX Part B ifeu 3 Quantities and utilization of UCO in Ger- many, Europe and non-European export countries 3.1 UCO Collection The quantities and utilization of UCO varies considerably from country to country within the EU. While the eating and nutritional habits of the respective country are the main factors for the former (a high proportion of fried foods or a high proportion of processed "ready- made" meals result in a high specific UCO potential, whereas a healthier lifestyle produces correspondingly low UCO quantities), the framework conditions of the countries’ waste management are decisive for the latter (Greenea, 2016). A comprehensive collection of UCO from "professional" sectors, i.e. from the food industry, restaurants, caters, hotels, refectories and the like, is well established in almost all European countries. However, there are significant differences in the collection of UCO in households1. There are currently only three countries, where the collection of UCO from households is organized at national level: Belgium, the Netherlands and Austria (Greenea, 2016). In addition, Sweden has a household collection, which, unlike in the countries mentioned above, is organized at local level without any coordination or cooperation between the dif- ferent actors. All other countries have either no UCO collection from households at all, or a strongly regionalized collection scheme while other countries rely on isolated regional initi- atives or commenced first pilot projects (Greenea, 2016). Figure 5 gives an overview of the handling of Near-Home UCO in the EU in 2016. 1 UCO generated in private households by e.g. frying processes or food preparation.
ifeu Availability and sustainable provision of biofuels under Annex IX Part B 11 Figure 5: Differences in household UCO collection within the EU (Greenea, 2016) 3.2 UCO quantities in Germany 3.2.1 Domestic origin The collection of UCO in the professional sector in Germany is very advanced. Of a total estimated volume of about 161,000 t per year, 140,000 t (corresponding to about 87.5 %) were collected in 2015 (Greenea, 2016). In comparison, the UCO margins collected in private households are extremely low. Of an estimated potential of 65,000 t per year, only 1,209 t were collected. It is to be assumed that the uncollected quantities in households are either disposed of via household waste or drains, which increasingly represents a challenge for water management. This results in an overall collection rate in Germany of 62 % (see Figure 6).
12 Availability and sustainable provision of biofuels under Annex IX Part B ifeu Figure 6: Collection rate of UCO in Germany 2015. Own presentation according to (Greenea, 2016) Converted to energy, the 142,000 t estimated by (Greenea, 2016) correspond to 5.3 PJ1 from UCO sourced in Germany. The Mittelstandverband abfallbasierter Kraftstoffe (MVaK) estimates that the amount of UCO available for the period 2021 - 2030 will be higher. In addition to a potential of around 250,000 t (or 9.3 PJ) per year in the period 2021 to 2030 from the professional sector, the association estimates that a UCO household collection could add another 100,000 t per year (see Table 1). While these figures represent an estimate of the UCO volumes in Germany, the evaluation reports of the Federal Agency for Agriculture and Food (in the following BLE) provide infor- mation on the quantities of biofuels placed on the market and their raw material base. These quantities, recorded via NaBiSy, correspond to the biofuel quantities counted towards the greenhouse gas quota. Accordingly, the quantity of residue-based biodiesel or UCO could be increased from 6.8 PJ to 8.2 PJ during the period between 2016 to 2018. This corresponds to a quantity of 183,000 t in 2016 and 220,000 t in 2018 (BLE, Evaluation and Experience Report for 2018, 2019). Thus, the UCO-ME of German origin currently placed on the market already corresponds to 88 % of the potential from professional UCO collection identified by the MVaK. If the poten- tial for a UCO household collection is added (100,000 t per year according to MVaK), 63 % of the total potential is currently utilized. 1 Assuming a lower heating value of 37 MJ/kg
ifeu Availability and sustainable provision of biofuels under Annex IX Part B 13
Table 1: UCO potentials from Germany to meet quotas under RED II
2015 2016 2017 2018 2021 – 2030
(Greenea) (BLE) (BLE) (BLE) (MVaK)
Professional collec- 140.000 t 183.000 t 170.000 t 220.000 t 250.000 t
tion
Corresponding share 0.22% 0.29% 0.26% 0.34% 0.43%
of final energy con-
sumption in transport
Household collection 65.000 t k.A. k.A. k.A. 100.000 t
(potential)
Corresponding share 0.1% - - - 0.17%
of final energy con-
sumption in transport
3.2.2 Imports of UCO
The figures above show that UCO from Germany plays only a minor role. According to (BLE,
2019), even in the record year 2018, only around 20 % (8.2 PJ of 41.1 PJ) of the UCOs pro-
cessed into biodiesel came from Germany itself. The rest was imported. As shown in Figure
7 and Figure 8, the following importing countries are the most important besides the EU
states (with 17.2 PJ or 42 %) (BLE, 2019), (BLE, 2020):
the People's Republic of China (7.2 PJ, 17.5%),
the USA (2.5 PJ, 6.1%),
Indonesia (1.7 PJ, 4.1%)
and Malaysia (1.3 PJ, 3.2%)14 Availability and sustainable provision of biofuels under Annex IX Part B ifeu Figure 7: UCO by origin in the German transport sector 2018. Own presentation according to (BLE, 2019) Figure 8: Origin of the UCO for the German market, 2018. Own presentation according to (BLE, personal communication, 2020)
ifeu Availability and sustainable provision of biofuels under Annex IX Part B 15
The following chapters cover the emergence and possible potentials of the import countries
that are important for Germany in the UCO sector.
3.3 UCO quantities in EU countries
As shown in Figure 7, the majority of the UCO utilized in Germany comes from other EU
countries. The relevant import countries and their respective shares in 2018 are shown in
the following Table 2.
Table 2: Major European export countries for the Germand UCO market
The Nether- Poland Slovakia Bulgaria Spain
lands
Quantity 2018 [PJ] 4.3 1.8 1.7 1.2 1.2
Share (relativ) (1) 25% 10% 9.7% 6.8% 6.8%
(1) Share of ohter EU countries: 17.2 PJ
The five largest export countries for Germany therefore only cover slightly more than 50 %
of the EU market in total. According to the BLE (BLE, 2020), UCO was imported from a total
of 26 EU countries, which underlines a robust market integration and the demand of this
coveted resource.
Special case: UCO from the Netherlands
Within the countries of Europe, the Netherlands is the most important and internationally
second most important trading partner for Germany in terms of UCO. Only the People's
Republic of China supplied Germany with more UCO in 2018.
Waste-based fuels play a significant role in the transport sector in the Netherlands. Between
2017 and 2019, the share of UCO in total biofuels was 56% in 2018 and 63% in 2019, respec-
tively (Emissieautoriteit, 2020). It should be noted, however, that the Netherlands also co-
vers only a fraction of its national biodiesel demand from domestic sources. Even though
there is an exemplary organized and established UCO collection system, both in the profes-
sional and the household sector (Greenea, 2016). Nevertheless, the Netherlands' contribu-
tion to UCO consumption in the above period varied between 10% - 20% (Emissieautoriteit,
2020) 1. For the Netherlands, the People's Republic of China and the USA are also the main
sources of UCO. The Netherlands also imports UCO from Germany (8%, as shown in Annex
8.1).
For Germany, this means that the quantities officially sourced from the Netherlands or de-
clared in this way are only imported via the Netherlands, but, for the most part, have not
physically originated in the Netherlands. Consequently, in order to evaluate the real origin
1Furthermore, the 4.3 PJ exported to Germany exceed the total amount of UCO collected domestically in
the Netherlands by several orders of magnitude.16 Availability and sustainable provision of biofuels under Annex IX Part B ifeu of the UCOs imported in Germany, the Dutch import share would have to be allocated ac- cording to its market composition. The market composition of Germany adjusted for the Dutch import share is shown in Figure 9 and Figure 10. Both underline the importance of the source markets People's Republic of China and USA for Germany1. The market compo- sition of the Netherlands can be seen in Appendix 8.1. Figure 9: Adjusted origin of UCOs for the German market, 2018. Own presentation according to (BLE, 2019) and (Emissieautoriteit, 2020)2 1 The specific shares from Indonesia and Malaysia are also increasing slightly. However, to a lesser extend compared to the US and China. 2 Note: The market composition of the Netherlands in 2019 was assumed to be constant.
ifeu Availability and sustainable provision of biofuels under Annex IX Part B 17 Figure 10: Adjusted UCO by origin in the German transport sector 2018. Own presentatio according to (Emissieautoriteit, 2020)1 and (BLE, 2019) Eastern Europe Besides the Netherlands, Eastern European countries – mainly Poland and Slovakia – stand out in the German UCO import statistics. Both countries cover their renewable share in transport primarily with first generation biofuels, mainly rapeseed oil-based fuels. Second generation biofuels currently have a small share, but are expected to play a greater role in the future (Flach, Lieberz, & Bolla, 2019). UCO-based fuels are currently not utilized in either country, and it can be assumed that UCO is intended for export purposes only, accordingly. (Greenea, 2016) states that a professional collection is established in both countries. A collection close to households is not yet avail- able in Poland. In Slovakia, there are first approaches to this, so that for both countries, in contrast to the Netherlands, there are moderate growth opportunities. 3.4 Quantities in the main non-European export markets Chapter 3.2 discussed the main importing countries. Overall, EU countries together make up Germany's most important trading block. European third party countries only play a mar- ginal role. Besides the EU, China (20%), the USA (8%), Indonesia and Malaysia (4% each) have been identified as Germany's main trading partners. As Figure 2 shows, the Southeast Asian market share grew rapidly in 2018 by almost 100%2. However, there are still concerns 1Note: The market composition of the Netherlands in 2019 was assumed to be constant. 2It should be noted, however, that the import mix was adjusted for the Netherlands only for 2018 (see Chapter 3.2).
18 Availability and sustainable provision of biofuels under Annex IX Part B ifeu about the sustainability of the UCO from South East Asia (Phillips, 2019). The following chap- ter therefore focuses separately on the biofuel and UCO markets of these countries. 3.4.1 People's Republic of China / South East Asia The People's Republic of China is by far Germany's largest trading partner for UCO. In 2018, around the same amount of UCO was imported from China as was collected in Germany itself (BLE, 2020). In addition, the Southeast Asian market share from 2013 (6%) grew strongly in recent years until 2018 (27%) (see Figure 2). China's biofuel policy focuses more strongly on bioethanol. Biodiesel has played virtually no role so far. Furthermore, the Chinese blending target of 10% (E10) only applies to petrol. Consequently, there are no incentives for the use of biodiesel here, either. If China’s transport policies remain constant, a competition for use within the transport sector can be ruled out (Kim, 2019). In the PRC, UCO is mainly used in animal feed / fattening. Here, it serves as a cheaply avail- able energy supplier to meet the growing demand for (especially pork) meat1 (Phillips, 2019). Although the use of food waste in animal fattening is officially prohibited or a legal grey area, this ban is only enforced in exceptional cases, such as the outbreak of swine flu in 2019, in affected companies (Argus Media Group, 2020). Another way in which used cooking oil is recycled in the People's Republic of China is to turn it into new cooking oil (Lu & Wu, 2014). This so-called "Gutter Oil" is marketed in China as a cheaper alternative to fresh vegetable oils. However, according to (Lu & Wu, 2014), Gutter Oil is a mixture of used cooking oils and other fats based on residual materials, e.g. low- grade residues from meat production or reused frying fat. This has given rise to controversy in the past about the potential harmful effects on health of consuming Gutter Oil. In re- sponse, the PRC government has successfully initiated a series of measures2 and reforms3 since the beginning of the 2010s to ensure the safety of edible oils in China (Lu & Wu, 2014). As mentioned above, imports of UCO to the EU have grown significantly in recent years, accompanied by Chinese export growth. Total imports already reached 500,000 t in 2018, of which about 200,000 t of Chinese UCO alone went to Germany (Phillips, 2019). This again shows the importance of Germany for the international market, but especially also for the Chinese market. However, there are numerous concerns regarding the sustainability and origin of UCO from China. As Chinese exports of UCO grew, palm oil, a highly controversial resource, was in- creasingly imported to the same extent, in order to compensate for the lack of capacities in animal fattening (Phillips, 2019) (T&E, 2020). This is particularly true for used cooking oils that have not previously been produced in the food or meat industry, but are only slightly contaminated. Between 2016 and 2018, imports of palm oil grew by 20%. Those of soybean and rapeseed oil also grew, but more moderately (Phillips, 2019). Both the demand for UCO and the profit margin on palm oil have risen sharply in Southeast Asia in recent years: the former already exceeds supply in Asia. The latter doubled between 2016 and 2018 to 10 % - 15 % compared to palm oil (Chow, 2018). Furthermore, there is a price fixing between UCO 1 This was also the main use of UCO in Europe until 2003 pre the BSE problem. 2 Among other things, a reward system has been developed for the notification of infringements or illegiti- mate use. 3 In the event of a conviction, the death penalty is not excluded.
ifeu Availability and sustainable provision of biofuels under Annex IX Part B 19 and palm oil, whereby the profit margin described above is solely because UCO is a more environmentally friendly fuel alternative with correspondingly increased demand (Chow, 2018). (Phillips, 2019) therefore suggests that this resulting iLUC risk should be taken into account in the ecological assessment of UCO-based biodiesel from China1 and that these fuels should be labelled accordingly. The situation is further complicated by concerns about the origin of Chinese UCO. Since the increased UCO imports to Europe in recent years, the UCO market price has been constantly above the price of palm oil (CPO, Crude Palm Oil) (Phillips, 2019).2 This difference represents a potential profit margin from the sham use of (previously imported) palm oil or a direct misdeclaration of fresh vegetable oils as UCO (Phillips, 2019) (Michalopoulos, 2020). More- over, existing protection mechanisms are often inadequate and are based only on the com- pletion of self-declarations, which moreover only have to be fulfilled by major suppliers of 120 tons per year or more (Phillips, 2019) (Meyer, 2020). These relatively weak anti-fraud measures in combination with an attractive profit margin of up to 25 % per ton (correspond- ing to the price difference between UCO and CPO) make the system vulnerable to potential exploitation (Phillips, 2019) (T&E, 2020) (Meyer, 2020). In addition, there are also concerns about the sustainability and robustness of the UCO sup- ply chain in the other Southeast Asian countries of origin, especially Indonesia and Malaysia (Phillips, 2019) (Kharina, Searle, Rachmadini, Kurniawan, & Prionggo, 2018) (T&E, 2020) (Meyer, 2020). Even though both countries share a large-scale palm oil industry and corre- sponding economic markets, the price difference between UCO and palm oil is an incentive for increased exports – but also fraud by blending fresh vegetable oil (Phillips, 2019) (Kha- rina, Searle, Rachmadini, Kurniawan, & Prionggo, 2018) (T&E, 2020). Possible fraud cases are currently being investigated in several cases in the Netherlands and UK (T&E, 2020) (Meyer, 2020) (Phillips, 2019). A further complicating factor for Indonesia is that – despite a high per capita volume, which is only utilized / collected in the professional sector – UCO cannot be counted towards the national biodiesel quota of 30 % (20 % in Malaysia) (Kharina, Searle, Rachmadini, Kurniawan, & Prionggo, 2018). This quota is met exclusively by palm oil- based biofuels. The UCO, which is thus available in surplus for export, could be used alter- natively as feedstock to meet quotas in Indonesia or Malaysia and substitute palm oil. In summary, an iLUC risk of UCO from China, Indonesia and Malaysia cannot be ruled out due to displacement effects and/or potential fraud/false declaration (T&E, 2020) (Phillips, 2019) (Michalopoulos, 2020). 3.4.2 USA After China, the USA follows as the second most important supplier of UCO exported to Germany (BLE, 2020). In the USA, too, there are legal requirements to meet the challenge of decarbonising the transport sector, which are summarised under the "Renewable Fuel Standard" (EPA, 2020). This standard distinguishes four different sustainable fuel categories, each of which has to meet annual volume targets. Analogous to the regulation under RED II (and FQD), conventional biodiesel has been capped since 2015.3 The key raw material for 1 The same applies to any UCO imports from abroad which are domestically substituted with high-iLUC vegetable oils. 2 The price development for UCO can be followed at: https://www.greenea.com/en/market-analysis/, that of palm oil at: https://www.rea.co.uk/websites/reaholdingsplc/English/2450/cpo-price.html 3 It should be noted that there is no explicit cap, but it is based on the overall quantity target minus ad- vanced biofuels.
20 Availability and sustainable provision of biofuels under Annex IX Part B ifeu the production of biodiesel in the USA is soybean oil (approx. 70%) (EPA, 2020) (US Energy Information Administration, 2020). Used cooking fats, known in the USA as "yellow grease", had a share of around 13 % and 12 % in 2018 and 2019, respectively (US Energy Information Administration, 2020). This makes Yellow Grease the third largest biodiesel feedstock in the USA (Zhou, Baldino, & Searle, 2020). In total, about 65% of the Yellow Grease collected in the USA was used for the production of biodiesel. In the future, even more biodiesel will be produced in the US from Yellow Grease. By 2032, its contribution is expected to grow by 50%, compared to 2018 (Zhou, Baldino, & Searle, 2020), while use in other sectors is largely predicted to remain constant or increase slightly. Thus, the US UCO market is dominated by the production of biodiesel, with a further in- creasing trend (Zhou, Baldino, & Searle, 2020). According to (Zhou, Baldino, & Searle, 2020), however, the increase in production or growth in the UCO-based biofuel industry will not be at the expense of other sectors, but can be met by expanding collection. Furthermore, it is not clear to what extent exports or an increase in exports of UCO would lead to increased use of conventional biofuels in the USA. In summary, UCO imports from the USA can be considered uncritical with respect to iLUC risk.
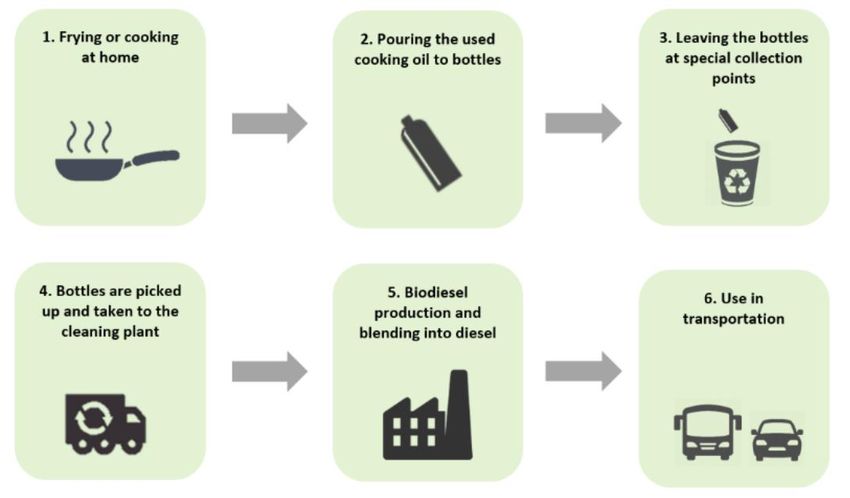
ifeu Availability and sustainable provision of biofuels under Annex IX Part B 21 4 Potentials to increase UCO collection in Germany Chapter 3.2 presented the UCO potentials available in Germany. While only limited growth potential is forecast for the professional sector, the greatest growth potential is in the area of household collection, which is currently limited to isolated regional initiatives (Greenea, 2016). This chapter describes the possibilities of implementing nationwide UCO collection from private households, provided that appropriate quantities are available in households. The eating and cooking habits of the population of the respective country play a decisive role. Assuming the forecast of MVaK of 100,000 t per year. for Germany, this results in a per capita collection volume of 1.20 kg per year. This means that Germany is well above the quantities actually collected in other European countries. For comparison: Belgium, a coun- try with a well-established private collection system, collects about 0.73 kg per year. A pos- sible implementation in Germany is mainly based on the experiences of the UCO household collection in the neighboring countries Netherlands, Belgium and Austria. 4.1 Value chain of a household UCO collection How can the collection of UCO from private households be designed? In general, there are two options. A collection obligation (see e.g. Belgium) or a voluntary collection scheme (see e.g. the Netherlands). Regardless of these options, a possible UCO collection from house- holds always starts with the use of a vegetable oil in households, for example, for the prep- aration of food. If, at the end of the use of the oil (e.g. after frying something), residual (used) oil remains, it should be collected in a container / bottle / receptacle specially de- signed for this purpose instead of being disposed of via the residual waste bin or flushed down the drain. The UCO containers can then either be handed in at (de)central points 1 or collected by third parties in the households2, whereby experiences from other countries proved that collection at central points is clearly advantageous (Greenea, 2016). As a next step, the collected UCO is transported to a treatment plant and prepared for fur- ther recovery/treatment before being transported to a biodiesel producer. Here, the trans- esterification process (from UCO to UCO-ME) takes place to condition the UCO for optimal combustion in diesel engines. Glycerin is produced as a co-product, which has further tech- nical applications. The UCO-ME can then either be used directly or blended with conven- tional diesel (Greenea, 2016). Figure 11 provides an overview of the value chain of a house- hold UCO collection. 1 Analogous, e.g., to the collection of used batteries in businesses or at other central collection points like schools. 2 Similar to conventional household waste collection by waste disposal companies.
22 Availability and sustainable provision of biofuels under Annex IX Part B ifeu
Figure 11: Presentation of a value chain of household UCO collection (Greenea, 2016)
4.2 Household UCO collection – Examples of Best Prac-
tice
The aim of this chapter is to briefly outline the different approaches to household UCO col-
lection in the European countries Belgium, the Netherlands and Austria.
4.2.1 Belgium
According to (Greenea, 2016), Belgium is - by far - the country in Europe with the highest
percentage of UCO collected in households1. The total potential in Belgian households is
estimated at 13,000 tons per year (corresponding to a per-capita volume of 1.16 kg per
year). Currently, already 8,300 t per year (corresponding to a per capita collection of 0.73 kg
per year) are collected (Greenea, 2016). For comparison: The second most successful coun-
try, Sweden, achieves a collection rate of 47%. For the EU as a whole, (Greenea, 2016) esti-
mate a collection rate of only 5.6% or 47,700 tons per year from European households, with
a total UCO potential of 850,000 tons per year.
In Belgium, household UCO collection is organised in the so-called Valorfrit system. The ini-
tiative dates back to 2004 and is the result of the merger of eleven companies active in the
sector. The Valorfrit system was created following the introduction of a law on the recycling
of edible oils. Producers, importers and distributors in general are obliged to report both
the quantity of edible oils placed on the market as well as the quantity of recycled UCO.
Valorfrit as the umbrella organisation coordinates the exchange of information on the one
1Belgian eating and cooking habits, with its’ high proportion of frying and correspondingly large amounts
of UCO constitute a major influencing factor.ifeu Availability and sustainable provision of biofuels under Annex IX Part B 23 hand and the collection itself on the other. The collection companies licensed in the system are paid by Valorfrit. The Belgian Valorfrit system constitutes a form of central collection1. The total of around 700 collection points are distributed to central and easily accessible locations, such as a shopping centers, malls, and the like. Each collection point collected an average of around 12 tons of UCO in 2014. The cooperation of households in collection is an integral part of the success of the house- hold collection in Belgium. In order to ensure this, a continuous PR campaign is indispensa- ble to highlight the necessity of household collection. At the same time, however, this PR campaign is a major cost factor, amounting to around €1 million per year. However, other factors contribute to the success of the collection system. Firstly, the culi- nary environment in Belgium means a relatively high per capita UCO potential. In addition to the culinary habits of the Belgian population, the attitude towards recycling is generally decisive. The willingness to recycle waste is traditionally high among the population of the Benelux countries, which is also reflected in the considerable collection rate of almost 2/3. 4.2.2 The Netherlands Following Belgium, the Netherlands have also introduced a nationwide household UCO col- lection in 2011. In contrast to Belgium, however, this is based on a voluntary approach. There is no collection obligation by the state. The Dutch system is also centrally organised. However, with around 2,000 collection points, it comprises around three times as many con- tact points, resulting in comparatively low quantities collected per collection point of only 1.8 tons. Similar to the successful Valorfrit system in Belgium, the Dutch household UCO collection system was also developed from a merger of various actors - including wastewater treat- ment companies - in the UCO economy. In addition to the central collection infrastructure, the Dutch system has produced a number of other innovations. Firstly, an application for simplified UCO collection for conventional (drinking) bottles, the so-called "EKOFUNNEL", has been developed. This attachment en- courages UCO to be collected in standard PET or other plastic bottles rather than in specially designed containers. Figure 12 shows a UCO collection from a pan using the EKOFUNNEL design and PET bottle. 1 There are individual municipal collections in the households themselves, similar to conventional waste disposal.
24 Availability and sustainable provision of biofuels under Annex IX Part B ifeu Figure 12: EKOFUNNEL - Design for simplified UCO collection in private households (EKOFUNNEL, 2020) Secondly, the Dutch collection system is strongly involved in schools, sports clubs and other youth organisations. These young people are encouraged to collect UCO and in return re- ceive a grant or funding. This targeting of young people and children has the advantage of establishing habits at an early age. Furthermore, it sensitises young people and children in general to the subject of recycling and environmental protection, which is hoped to have an effect beyond UCO collection. Furthermore, cooperation with these institutions makes it easier to choose the location for UCO collection, as cooperating institutions are encouraged to set up collection containers on their premises. Nevertheless, compared to the mandatory system in neighboring Belgium, households in the Netherlands collect comparatively little UCO: per capita, the collection rate in 2014 was 0.21 kg per year with a potential of 0.7 kg per capita and year, or 30% (Greenea, 2016). Apart from the voluntary nature of the collection, a major reason for this may be the relatively low per capita consumption of edible oils, which is due to Dutch dietary habits. Furthermore, the Belgian collection system has existed around twice as long as that in the Netherlands (introduction 2004 vs. 2011) and is therefore more mature. 4.2.3 Austria Starting in 1990, private households in Austria have been collecting UCO (Greenea, 2016). In contrast to the Netherlands and Belgium, however, the UCO collection originated as a regional or municipal initiative of the city of Graz. In addition, there is no uniform, area-wide system, but the Ökodrive System of the City of Graz and the Öli System for other regions. The Öli System was created in 1999 and, too, covers parts of southern Germany, among other things. The Austrian systems are also centrally organised with publicly accessible delivery points. In contrast to Belgium and the Netherlands, however, Öli uses a specially designed 3l con- tainer, which is exchanged for an empty one when the oil is submited (Figure 13).
ifeu Availability and sustainable provision of biofuels under Annex IX Part B 25 Figure 13: Demonstration of the Öli design, Austria (Fritzens, 2020) The Öli system collects up to 1 kg per capita and year. However, the UCO collection schemes in Austria do not cover the entire national territory, but only about 27 % so far. Culinary factors are also decisive here. Austrian cuisine, for example, produces a dispropor- tionately high amount of UCO. This is not easily transferable to other countries, such as Ger- many. Furthermore, the UCO collected with the Öli System is not processed into biofuels, but is used for energetic use directly or after fermentation to biogas. Summary: The analysis of the experiences of the European neighbouring countries Belgium, the Neth- erlands and Austria has revealed a number of key factors, which are decisive for the success of a household UCO collection: The main factor determining the UCO potential from private households is primarily the quantities used, which in turn are mainly determined by culinary factors. Furthermore, the comparison of the Netherlands and Belgium shows that a political / governmental collection obligation has a positive effect on recovered margins1. Another significant factor are general recycling habits of the population of the respective country. If these are generally well established and well anchored, it can be assumed that they can also be transferred to a further collection of a special waste material, UCO. How- ever, the example of Belgium shows that a continuous PR campaign - at least when a sepa- rate UCO collection is first introduced - is essential to promote motivation and participation 1As already mentioned in 4.2.2, the per-capita differences are not solely due to the collection obligation. However, it can be assumed that it plays a decisive role.
26 Availability and sustainable provision of biofuels under Annex IX Part B ifeu of the population. In order to facilitate the creation of new habits, the approach and tar- geted sensitisation of young people and children via schools and recreational facilities proved to be particularly successful. As regards the form of organisation (uniform across the board vs. regionally different struc- tures/associations/collaborations) or collection technology (specially developed collection container vs. collection in plastic bottles with an application), no clear trends could be de- rived. Various concepts have proven successful in practice. Common to all systems investi- gated is that collection is organised centrally and UCO is not collected decentrally in the households of waste management companies. Nor is the influence of possible incentives or remuneration for the collection and delivery of the privately collected UCO clear. Whether or to what extent a possible (financial) remuner- ation has a decisive influence on collection behaviour is not the subject of this study. If, however, UCO household collection is to be introduced in Germany or other countries, this question should be given greater consideration.
ifeu Availability and sustainable provision of biofuels under Annex IX Part B 27
5 Significance of biofuels based on cate-
gory 1 and 2 animal fats
5.1 Problem definition
The raw materials and RED II Annex IX Part B include animal fats classified in categories 1
and 2 of Regulation (EC) No 1069/2009. These categories are defined as follows:
Category 1: Raw material presenting a high risk, such as animals suspected of being
infected by a TSE or specified risk material
Category 2: Medium risk material, e.g. carcasses of animals which have died by means
other than slaughter or killing for human consumption, including animals killed for
disease control purposes
These materials must be disposed of as waste by incineration. Category 2 animal fats can
also be utilized for the production of biogas.
Category 3 animal fats may also be used for the production of feed for other farmed animals.
For this reason, they are not eligible for double counting towards the quota under RED II
(minimum percentage under RED II Article 25 (1)).
Germany constitutes the only EU country to have excluded the production of biofuels based
on animal fats (hereinafter referred to as TME, an abbreviation of tallow methyl ester or
animal fat methyl ester) from the scope of eligibility (BImSchG, § 37b (8) No. 3). Among
other EU Member States, so far, only Denmark, Finland, France and the Netherlands1 allow
a double counting of TME.
The reason for the exclusion in Germany is the competition for use that would be created
by the promotion of TME in comparison with other industries that already use animal fats
as raw materials.2 A further (informal) argument was that the promotion of TME would cre-
ate a contribution to limiting the costs of rendering, which could lead to a reduction in the
price of meat and, thus, also further stimulate meat consumption.
1The UK, too, allows for a double counting, when assessing the EU-28.
2See Bundesrat Drucksache 360/14 of 08.08.2014 (p. 19, explanatory memorandum to number 5 (§37b,
paragraph 8); https://www.bundesrat.de/SharedDocs/drucksachen/2014/0301-0400/360-
14.pdf?__blob=publicationFile&v=128 Availability and sustainable provision of biofuels under Annex IX Part B ifeu
The focus of this chapter is the question of what role can a possible future eligibility of bio-
fuels based on animal fats of categories 1 and 2 play towards the for the fulfilment of quotas
for Germany. Which arguments speak in favour, which against? The following additional
questions need to be further clarified:
What are the quantities and destinations of animal fats in Germany and in the EU?
How important are biofuels based on animal fats of categories 1 and 2 in the EU?
What are the possible consequences of an additional GHG quota eligibility?
5.2 Quantities and destinations of animal fats in Ger-
many and the EU
5.2.1 Germany
Quantities of animal fats in Germany were investigated in the so-called BioRest study (Feh-
renbach, 2019), among others. The figures in Table 3 (reference year 2016) are taken from
this study. The background data is based primarily on data from the Servicegesellschaft Tie-
rische Nebenprodukte (STN) in the Verband der Verarbeitungsbetriebe Tierischer Nebenpro-
dukte e. V. (VVTN). According to these data, Germany produces about 130,000 tons of cat-
egory 1 and 2 animal fats per year, 86 % of which fall under category 1. Roughly, 96 % of
them are processed into bio-diesel, which corresponds to about 4.8 PJ. Assuming that this
quantity is constant, this would amount to about 12 % of UCO in Germany (about 42 PJ in
2018, see above).
Table 3: Collection and use of animal fats in Germany; source: (Fehrenbach, 2019)
2016 in [t/a] Techn. Appli- Thermal Own con-
Animal feed Biodiesel
cations utilization sumption
Cat. 1 animal fats - 3,864 105,779 625 456
Cat. 2 animal fats - - 18,003 - -
Cat. 3 animal fats 63,962 151,624 103,861 71 -
Sum 63,962 155,488 227,643 696 456
Total 448,245
It is also worth noting that of the 320,000 tonnes of category 3 animal fat, a third is also
processed into biodiesel, which corresponds to a further 3.8 PJ. Only 20% are being used as
animal feed, while 47 % go to technical applications (mainly oleochemistry).
The TME produced in Germany from animal fats is exported in its entirety to neighbouring
European countries because it is not eligible towards the GHG quota. However, (Flach,
Lieberz, & Bolla, 2019) show that Germany also uses TME.ifeu Availability and sustainable provision of biofuels under Annex IX Part B 29
5.2.2 Europe
According to data from the European Fat Processors and Renderers Association (EFPRA), ap-
proximately 6 million tons of Category 1 and 2 material are recycled in Europe. Approxi-
mately 12 % of this is animal fat. Figure 14 shows the volume development of animal fats
until 2014. More current figures are not published.
Figure 14: Volume of category 1+2 and 3 animal fats in Europe; source: (Chudziak & Haye, 2016), based on data from EFPRA
5.3 Importance of biofuels based on category 1 and cat-
egory 2 animal fats in the EU
5.3.1 Produced volumes
According to the GAIN report by (Flach, Lieberz, & Bolla, 2019), about 1 million tons TME
have been used as fuels in Europe in recent years. At 37 PJ, this corresponds to more than a
third of UCO. Until 2013, quantities ranged from 0.3 to 0.4 million t and then increased
sharply, collapsed again sharply in 2016 and have been rising continuously ever since. This
development of the TME in the EU shown in Figure 15 does not quite fit in with the picture
in Figure 14, according to which, following EFPRA data, only just under 600,000 tons of Cat-
egory 1 and 2 animal fat were available in 2014, but 900,000 tons of TME had already been
used. There is no doubt, however, that the use in the last five years is significantly higher
than before.
The authors of the GAIN report attribute the increasing use of animal fats predominantly to
the installation of new plants or capacity increases in already existing plants, then as a func-
tion of raw material prices, as the use of animal fat requires changes in technical equipment.
Figure 16 therefore does not show the current situation, but shows the distribution of TME
(and UCO) production and pro-capacity in Europe.30 Availability and sustainable provision of biofuels under Annex IX Part B ifeu
Figure 15: Utilization of TME in the EU; Source: (Flach, Lieberz, & Bolla, 2019)
Total:
Production:
2.12 million tons UCOME
0.47 million tons TME
Capacity:
3.55 million tons UCOME
0.74 million tons TME
Figure 16: Waste based biodiesel production and capacities in Europe, 2016; Source: (greenea, 2016)
The main countries using TME as a biofuel are Italy, the Netherlands and France. Significantly
smaller shares are found in Finland, UK, Denmark, Spain, Austria, Ireland, Hungary, Poland
and the UK. As mentioned above, Germany (Flach, Lieberz, & Bolla, 2019), too, utilizes TME,
but with comparatively low margins, only.ifeu Availability and sustainable provision of biofuels under Annex IX Part B 31
Denmark and Italy recognise animal fats (and UCO) as a feedstock for advanced biofuels.
There, as well as in the Netherlands, France and Finland, they are processed together with
other wastes (also Annex IX, Part A) in plants using the hydrotreatment process.
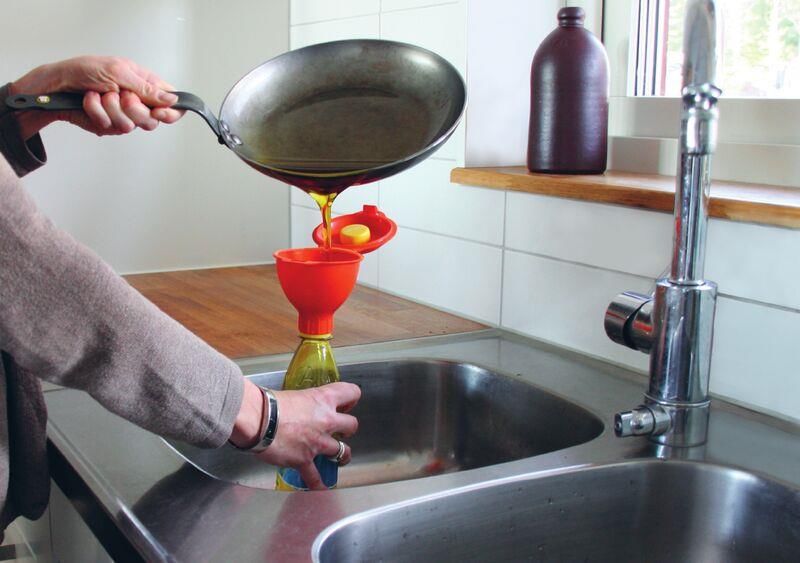
5.3.2 Price relations
According to Greenea, the animal fat market is relatively stable due to the dominance of a
few top buyers. According to (Chudziak & Haye, 2016), the price of animal fat follows the
developments of vegetable oils (see Figure 17) and is always slightly below them. In most
cases, the price is close to crude palm oil (CPO), but always below UCO.
This suggests that TME is more competitive compared with UCOME.1
Figure 17: Development of prices of animal fats compared to several vegitable oils and UCO; Source: (Chudziak & Haye, 2016), based on
data from O. Licht, Oil World
5.4 Possible consequences of an eligibility towards the
GHG quota in Germany
The starting position for this question can be outlined as follows:
The potential of animal fat is limited and exhausted by the status quo in Germany as is;
the quantities produced in Category 1 and 2 rendering plants cannot be significantly
increased in view of the technology already installed in the plants.2
1 NOTE: The large price advantage of animal fat over UCO is not easy to explain because the quality of the
output from the fat melting plant is comparatively high and can be used directly in biodiesel production
(transesterification).
2 According to the self-presentation of the companies that process category 1 and 2 in Germany (websites).32 Availability and sustainable provision of biofuels under Annex IX Part B ifeu
In Germany, the available animal fats of categories 1 and 2 are already almost completely
processed into biodiesel (TME); due to legal requirements, these quantities do not
compete with alternative material uses (e.g. animal feed or oleochemistry).
Category 3 animal fats, which more than doubles the other categories in terms of
volumes, is mainly used materially. Nevertheless, high proportions of this raw material
are already being processed into TME.
TME produced in Germany is being exported to other EU Member States in (almost) its
entirety, where it’s eligible towards the GHG quota.
The quantity of TME produced in Germany from categories 1 and 2 (in 2016, this was
approx. 130,000 t with an energy content of 4.8 PJ) corresponds to 12 % of the quantity
of UCO currently counted as Part B biofuel towards the GHG quota; with these TME
quantities, Part B biofuels would increase to approx. 48 PJ and thus account for a total of
2.0 % of final energy consumption in transport (for 2020, see Chapter 2).
Prices for animal fats are lower than UCO prices.
If in light of the implementation of RED II, Germany would allow TME to be eligible towards
the GHG reduction quota, the following consequences can be expected:
As a result of the price advantage, market participants subject to the quota in Germany
would increasingly demand TME and thus enter into competition with existing customers
in other EU countries.
Additional production of TME, i.e. additional development of category 1 and 2 animal
fats, is unlikely due to the limited and already widely developed potential;
To what extent further untapped volumes for biodiesel production in other EU countries
can be developed, cannot be assessed at present; neither can it be assessed whether,
similar to UCO, imports from non-EU countries are an option for TME.
With a cap in place, the additional use of TME is expected to displace the use of UCO.
This would probably primarily affect the UCO with the comparatively most expensive
production costs, which could possibly be UCO of German origin.
For the German GHG quota, the eligibility of TME would have a positive effect due to its’
high specific savings rate; the effect would be limited, however, if it reduced the share of
UCO (which also has a high savings rate).
The overall changes from the previous situation, both positive and negative, would be
limited:
‒ little incentive or potential for more TME, but rather a redistribution of biofuels
between current TME importing countries from German production and Germany
itself.
‒ GHG savings largely limited to avoided transports.
Accordingly, a future possible eligibility of TME towards the GHG reduction quota in Ger-
many must be assessed ambivalently.ifeu Availability and sustainable provision of biofuels under Annex IX Part B 33 6 Summary This study focuses on the importance of biofuels on the basis of raw materials listed in Annex IX Part B of the Renewable Energy Directive II (RED II) for Germany and Europe. One of the central questions was, what role biofuels based on used cooking oil (UCO) and animal fats of categories I to III can play at present and in the future to fulfil Germany's obligations in the transport sector. On the other hand, the sustainability of the provision of these fuels was examined, particularly with regard to competition for use and the risk of inducing indi- rect land use changes. Against this background, the quantities and utilization of UCO in Ger- many, Europe and in the main non-European export markets (China, USA, Malaysia, Indo- nesia) of Germany were analysed. Furthermore, the potential for increasing UCO collection in Germany was investigated. For this purpose, experiences from the UCO collection in other European countries were evaluated and decisive influencing factors were derived. In addi- tion to UCO as a raw material for biofuels, the relevance of category I and II animal fats in the biofuel sector was further investigated. In particular, quantities and utilization as well as the possibilities and effects of counting these fuels towards the GHG quota were discussed. Germany is a key market in Europe, consuming around one sixth of all fuels within the EU 28. This also and in particular applies to UCO-based fuels. Their demand in Germany has increased rapidly from 15 PJ in 2013 to over 40 PJ in 2018, and thus already corresponds to the 1.7 % of final energy consumption in the transport sector which, according to RED II, is to be attributed to these biofuels by 2030. In view of a forecast slight decrease in final energy consumption in Germany's transport sector, the current situation would mean that the 1.7 % ceiling of RED II would be exceeded in absolute terms. This would then require a sep- arate approval by the European Commission, resulting therefore in a need for action in any case. The German UCO market is dominated by imports. Domestic production accounts for only around 20%. The main import destinations are other EU countries, the People's Republic of China, the USA, Malaysia and Indonesia. Within the EU, Eastern European countries in par- ticular play an important role for Germany. The EU country with the largest share of UCO imports for Germany is the Netherlands, which on closer inspection, however, almost exclu- sively acts as a transit country for UCO from international sources. Sustainability all along the value chain is a key issue for the evaluation of UCO-based fuels. Especially considering UCO from the South East Asian region, there have been and still are accusations regarding the origin of UCO. Thus, it cannot be ruled out with certainty that it is actually UCO and not fresh vegetable oils based on palm oil fraudulently declared as UCO. This is not only favoured by an increasing overall European demand, but also, above all, by higher market prices for UCO, compared to fresh crude palm oil. Equally relevant is the as- sessment of competition for use and displacement effects. The continued use of used cook- ing fats in food preparation, which is harmful to health and therefore prohibited in China, must be viewed critically and the alternative use of these oils should be supported. How- ever, used edible fats are also being withdrawn from other existing areas of use, such as the use of UCO in animal fattening. It can therefore be assumed that UCO exported from China
You can also read