GBE Gene Similarity Networks Unveil a Potential Novel Unicellular Group Closely Related to Animals from the Tara Oceans Expedition
←
→
Page content transcription
If your browser does not render page correctly, please read the page content below
GBE

Gene Similarity Networks Unveil a Potential Novel Unicellular
Group Closely Related to Animals from the Tara Oceans
Expedition
Alicia S Arroyo1,*, Romain Iannes2,*, Eric Bapteste2, and In
                                                           ~aki Ruiz-Trillo                                                 1,3,4,
                                                                                                                                   *

1
 Institut de Biologia Evolutiva (CSIC-Universitat Pompeu Fabra), Barcelona, Spain

                                                                                                                                                                                        Downloaded from https://academic.oup.com/gbe/article/12/9/1664/5857131 by guest on 06 December 2020
2
 Institut de Systematique, Evolution, Biodiversite (ISYEB), Sorbonne Universite, CNRS, Museum National d’Histoire Naturelle, EPHE, Universite des
Antilles, Paris, France
3
 Departament de Genètica, Microbiologia I Estadıstica, Institut de Recerca de la Biodiversitat, Universitat de Barcelona, Spain
4
 ICREA, Barcelona, Spain

*Corresponding author: E-mail: alicia.arroyo@ibe.upf-csic.es; inaki.ruiz@multicellgenome.org.
Accepted: 8 June 2020

Abstract
The Holozoa clade comprises animals and several unicellular lineages (choanoflagellates, filastereans, and teretosporeans).
Understanding their full diversity is essential to address the origins of animals and other evolutionary questions. However, they are
poorly known. To provide more insights into the real diversity of holozoans and check for undiscovered diversity, we here analyzed 18S
rDNA metabarcoding data from the global Tara Oceans expedition. To overcome the low phylogenetic information contained in the
metabarcoding data set (composed of sequences from the short V9 region of the gene), we used similarity networks by combining two
data sets: unknown environmental sequences from Tara Oceans and known reference sequences from GenBank. We then calculated
network metrics to compare environmental sequences with reference sequences. These metrics reflected the divergence between
both types of sequences and provided an effective way to search for evolutionary relevant diversity, further validated by phylogenetic
placements. Our results showed that the percentage of unicellular holozoan diversity remains hidden. We found novelties in several
lineages, especially in Acanthoecida choanoflagellates. We also identified a potential new holozoan group that could not be assigned
to any of the described extant clades. Data on geographical distribution showed that, although ubiquitous, each unicellular holozoan
lineage exhibits a different distribution pattern. We also identified a positive association between new animal hosts and the ichthyo-
sporean symbiont Creolimax fragrantissima, as well as for other holozoans previously reported as free-living. Overall, our analyses
provide a fresh perspective into the diversity and ecology of unicellular holozoans, highlighting the amount of undescribed diversity.
Key words: networks, metabarcoding, 18S, molecular diversity, unicellular Holozoa, novelty.

Introduction                                                                                  forming the Holozoa clade (Lang et al. 2002; Ruiz-Trillo et al.
The origin of animals from their unicellular ancestor is, undoubt-                            2004, 2008; Shalchian-Tabrizi et al. 2008; Torruella et al. 2012,
edly, an important evolutionary question. To address this ques-                               2015; Grau-Bove et al. 2017). In contrast, environmental data
tion in the most effective way, we first need to have a well-                                 show us that we still do not have a full understanding of the
resolved phylogenetic framework as well as a good understand-                                 diversity of Holozoa (del Campo et al. 2015; Arroyo et al. 2018).
ing of the diversity of the closest unicellular relatives to animals                          Therefore, current interpretations on the evolutionary transition
(Ruiz-Trillo et al. 2007). Thanks to phylogenomic analyses, a                                 toward animal multicellularity may be challenged by improving
well-resolved phylogenetic framework of animal origins is                                     our knowledge about Holozoa diversity (Ruiz-Trillo et al. 2007;
now in place. We know that animals are closely related to several                             del Campo et al. 2014).
unicellular lineages, namely Choanoflagellatea, Filasterea, and                                  To fill this gap and provide a more accurate perspective on
Teretosporea (Ichthyosporea and Corallochytrea), all together                                 Holozoa diversity and their geographical distribution, we

ß The Author(s) 2020. Published by Oxford University Press on behalf of the Society for Molecular Biology and Evolution.
This is an OpenAccess article distributedunder the terms ofthe Creative Commons Attribution Non-Commercial License (http://creativecommons.org/licenses/by-nc/4.0/),whichpermits non-
commercial re-use, distribution, and reproduction in any medium, provided the original work is properly cited. For commercial re-use, please contact journals.permissions@oup.com

1664       Genome Biol. Evol. 12(9):1664–1678. doi:10.1093/gbe/evaa117 Advance Access publication 13 June 2020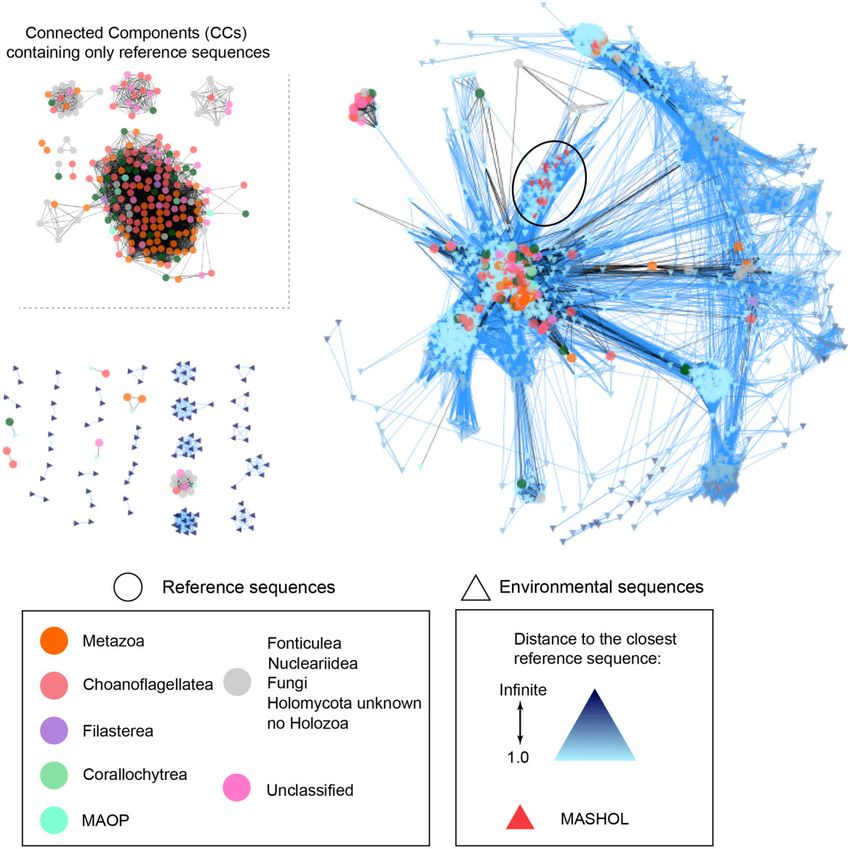
Potential Novel Unicellular Group Related to Animals from the Tara Oceans Expedition                                   GBE

analyzed the longest and largest metabarcoding marine data            reference data set with known holozoan sequences. The en-
set: the Tara Oceans expedition, which is based on the 18S            vironmental data set came from the worldwide Tara Oceans
ribosomal RNA gene (hereafter 18S or 18S rDNA) (de Vargas             expedition (de Vargas et al. 2015), which included metabar-
et al. 2015; Pesant et al. 2015). Tara Oceans comprise thou-          coding data from the V9 region of the 18S rRNA gene from a
sands of reads from hundreds of sampling stations around the          total of 1,086 samples from 210 oceanic stations, 3 water
globe, with a third of those reads not matching any reference         column layers, and 10 size fractions (further details about
in databases (de Vargas et al. 2015). However, a drawback of          sampling procedures can be found in Pesant et al. 2015).
this data set is the absence of full-length 18S sequences, be-        The reference data set was built by collecting sequences
ing composed by the relatively small V9 region (130 bp               from both GenBank Nucleotide and PR2 databases (see
long), located at the end of the 18S (Hugerth et al. 2014).           Materials and Methods).

                                                                                                                                          Downloaded from https://academic.oup.com/gbe/article/12/9/1664/5857131 by guest on 06 December 2020
    To overcome the issue of the limited phylogenetic signal,             The initial unicellular Holozoa network was built from
we decided to analyze the Tara Oceans data set using gene             2,426 sequences (2,197 from Tara Oceans, 229 from the
similarity networks. Networks have been preferentially applied        reference data set). In the network, each node represented
to study ecological interactions, such as predator–prey, para-        either an environmental OTU from Tara Oceans (hereafter
site–host, or mutualism (Logares et al. 2014; Krabberød et al.        ENV) or a sequence from the reference database (hereafter
2017; Layeghifard et al. 2017; Pilosof et al. 2017; Valverde          REF) (fig. 1). The basic structure of the network consisted of
et al. 2018). Networks are now becoming widely adopted to             Connected components (CCs): subgraphs of the network in
explain complex evolutionary processes, such as horizontal            which there is always a path between all nodes (fig. 2). The
gene transfer, gene domain fusion, and gene or genome in-             initial network was subsequently partitioned using increasing
trogression (Corel et al. 2016; Pathmanathan et al. 2018;             percentages of sequence similarity thresholds (85%,
Ocan ~ a-Pallarès et al. 2019). To our knowledge, there are          87%, 90%, 95%, and 97%), resulting in more frag-
very few metabarcoding studies that used networks to de-              mented networks (fig. 2). In each of these networks, CCs
scribe novelty in metabarcoding data sets (Forster et al. 2015,       could be classified in three types: CCs in which all nodes
2019), even though this methodology offers a structure to             were environmental (CCENV), CC in which all nodes were ref-
test evolutionary questions in massive high-throughput data           erence (CCREF), and CC in which there were both types of
and to mine large data sets for sequences of interest.                nodes (CCMIX) (fig. 1).
    Our analyses showed novel unicellular Holozoa diversity, in           Networks produced at all thresholds displayed a similar
particular within Choanoflagellatea and Ichthyosporea.                trend: the number of CCENV was always the largest, followed
Specifically, we found unicellular Holozoa operational taxo-          by a CCMIX and CCREF (supplementary fig. 1, Supplementary
                                                                      Material online), which indicated the presence of abundant
nomic units (OTUs) branching off several acanthoecid sub-
                                                                      divergent groups of environmental sequences, independently
groups (e.g., Choanoflagellate H), Syssomonas multiformis
                                                                      of the stringency level considered.
and Creolimax fragrantissima. We also retrieved 15 Filasterea-
related OTUs, detecting this clade for the very first time in an
environmental survey. Interestingly, we also identified a puta-       Definition of Novelty
tive novel unicellular Holozoa group, composed of 21 OTUs             To find potential novelty, we then explored the structure of
(6,244 reads in total)., that could not be located within any         the sequence similarity networks to search for molecular di-
other known lineage and may represent a novel lineage (here           versity. To do so, we calculated different metrics that are
tentatively named as MASHOL, for marine small Holozoa                 grouped into four categories:
clade). We also observed that the freshwater environmental
                                                                     1. Closeness centrality (fig. 2 and supplementary material 1,
group FRESCHO3 could have diverged from a marine clade,
                                                                        Supplementary Material online): It defines to which extent a
showing another marine-to-freshwater transition in choano-
                                                                        node (sequence) is central in a network. Typically, a periph-
flagellates. Finally, our co-occurrence analyses suggested po-
                                                                        eral sequence in a CC is more divergent than the rest of the
tential novel associations between animals and                          nodes in this CC because it has less direct neighbors, mean-
ichthyosporeans. For example, the ichthyosporean                        ing that peripheral sequences share less similarity with the
C. fragrantissima could be associated with a broader range of           majority of the sequences with which they cluster.
animal hosts than previously described.                                 Therefore, we tested whether and which environmental
                                                                        sequences (ENV) were significantly more peripheral than
Results and Discussion                                                  reference sequences (REF) as a way to test whether ENV
                                                                        sequences extends the current known diversity of
Initial Data Sets and Network Construction                              Holozoa, as well as to identify significantly peripheral ENV
To look for potential new diversity of unicellular Holozoa and          nodes.
to address their geographical distribution, we combined two          2. Preferential association (assortativity, fig. 2, and supplemen-
18S rRNA data sets: an environmental data set of OTUs and a             tary material 1, Supplementary Material online):

Genome Biol. Evol. 12(9):1664–1678 doi:10.1093/gbe/evaa117 Advance Access publication 13 June 2020                              1665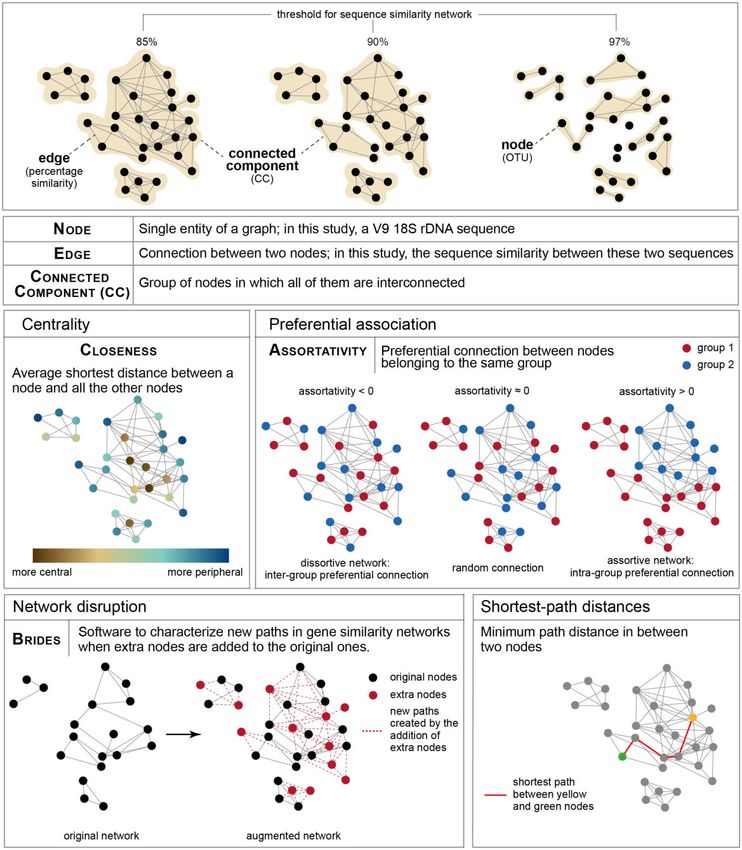
Arroyo et al.                                                                                                                                GBE

                                                                                                                                                                  Downloaded from https://academic.oup.com/gbe/article/12/9/1664/5857131 by guest on 06 December 2020

    FIG. 1.—Network metrics. Upper panel: once the unicellular Holozoa network was constructed, different similarity thresholds were applied to gain a
more detailed structure of their diversity. Lower panels: network metrics computed in this study to address molecular novel diversity in unicellular Holozoa. A
more technical explanation of closeness and Assortativity can be found in supplementary material 1, Supplementary Material online, and of BRIDES in
supplementary figure 2, Supplementary Material online.

1666      Genome Biol. Evol. 12(9):1664–1678 doi:10.1093/gbe/evaa117 Advance Access publication 13 June 2020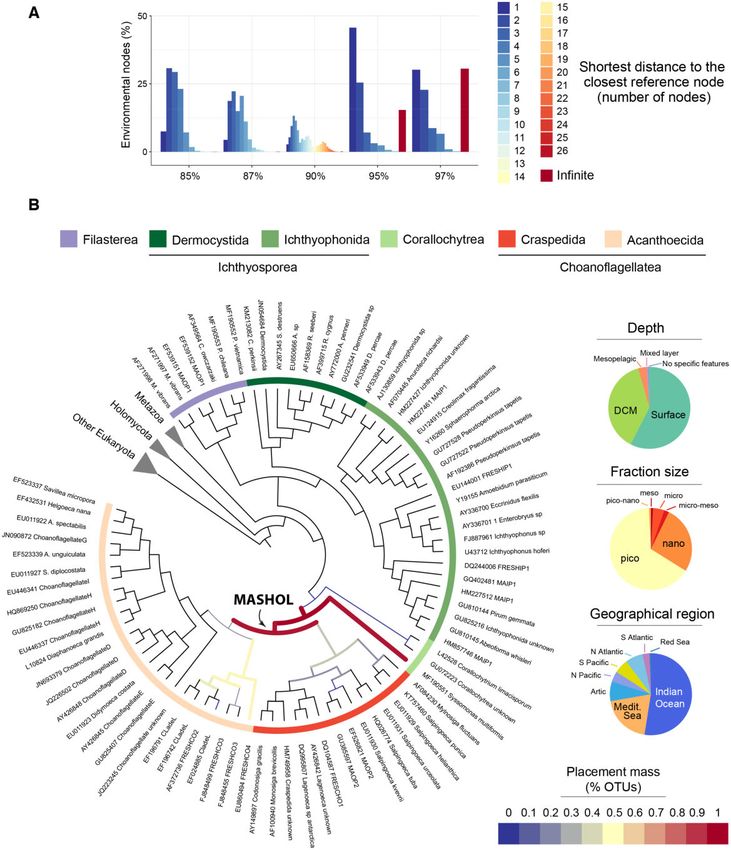
Potential Novel Unicellular Group Related to Animals from the Tara Oceans Expedition                                                   GBE

                                                                                                                                                            Downloaded from https://academic.oup.com/gbe/article/12/9/1664/5857131 by guest on 06 December 2020
     FIG. 2.—Unicellular Holozoa network at 85% similarity threshold. Environmental nodes from Tara Oceans are depicted with triangles that are colored
according to the distance to their shortest reference sequences (right panel). Reference nodes from GenBank data set are depicted with circles that are
colored according to the taxonomy (left panel). Connected components composed of only reference nodes are located in the top right corner. The novel
Holozoa group described in this article, MASHOL (for MArine Small HOLozoa), is shown in red triangles and pointed in the network with a black circle. Raw
network data can be found in supplementary material 4, Supplementary Material online.

  Assortativity quantifies whether nodes that belong to the                   3. Network comparison (path analyses by BRIDES) (fig. 2 and
  same category (e.g., ENV or REF) are more connected with                       supplementary fig. 2, Supplementary Material online): It
  each other rather than with nodes from other categories.                       quantifies the new paths created in an augmented network
  For example, a significant preferential association between                    when new sequences (e.g., ENV) are added to an original
  ENV nodes in a network would indicate the existence of                         network (with only REF), as in Lord et al. (2016). In partic-
  groups of similar environmental sequences, distinct from                       ular, this allows the evaluation of whether newly added ENV
  sequences from already described Holozoa.                                      sequences fill in some gaps between the original REF

Genome Biol. Evol. 12(9):1664–1678 doi:10.1093/gbe/evaa117 Advance Access publication 13 June 2020                                                1667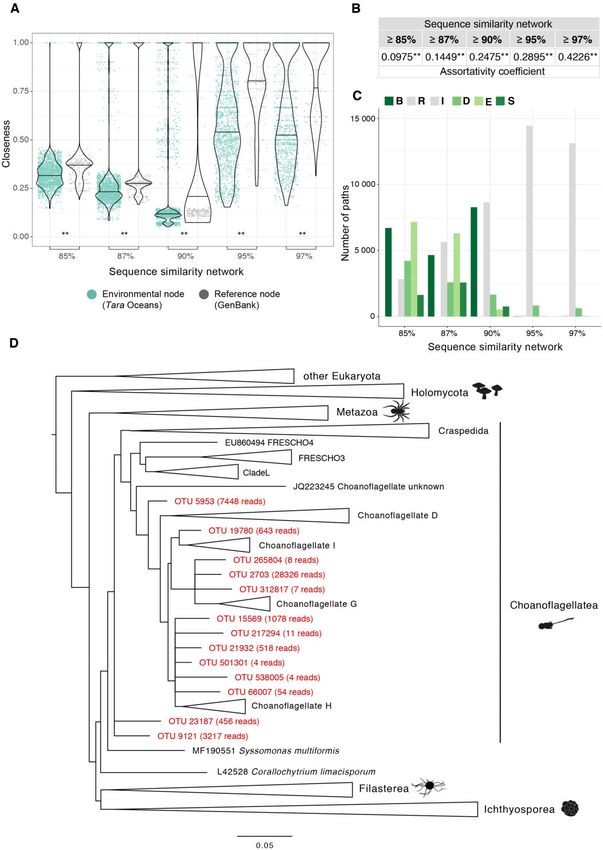
Arroyo et al.                                                                                                         GBE

   sequences. Typically, Breakthroughs (B paths) and Shortcuts        values of all our real networks (see Materials and Methods).
   (S paths) indicate that added ENV sequences decrease the           All networks were significantly assortative (one-sample t-test,
   topological distance (hence by assumption the putative phy-        P value < 0.01**) (fig. 3B). This tendency for intragroup pref-
   logenetic distance) between known REF sequences. By con-           erential linkage suggests a lack of representation of oceanic
   trast, Impasses (I paths) indicate that added ENV sequences        Holozoa in the reference data set before the Tara Ocean ex-
   locate outside short paths between REF sequences in the            pedition, stressing the high level of potential new diversity
   augmented network.                                                 present in Tara Oceans data.
4. Shortest path distance (fig. 2): Shortest paths describe the          Overall, these metrics (closeness and assortativity) indicated
   minimal number of edges to connect any pairs of nodes in a         that our environmental data set of unicellular holozoans from
   network. We used these metrics to quantify a topological           Tara Oceans was different from the reference data set,

                                                                                                                                          Downloaded from https://academic.oup.com/gbe/article/12/9/1664/5857131 by guest on 06 December 2020
   distance between ENV and REF nodes in the graph. By def-           expanding the current known diversity of this group.
   inition, increasingly divergent ENV sequences will be located
   increasingly far from REF sequences. If ENV and REF sequen-        New Molecular Diversity in Holozoa, Including a Potential
   ces are located in distinct CCs, there is even no path be-         Novel Clade
   tween them; thus the shortest path distance for such pairs
   of nodes is infinite.                                              To identify new groups of interest, we first performed net-
                                                                      work comparisons using BRIDES software (fig. 2 and supple-
    All these steps of graph-mining were used to detect ENV           mentary fig. 2, Supplementary Material online) (see Materials
 sequences that could potentially indicate novelty, for which         and Methods and Lord 2016). This allowed us to contrast the
 phylogenetic placement could be finally computed.                    topologies of networks built exclusively from REF nodes (orig-
                                                                      inal networks) with that in which ENV nodes had been in-
 The Structure of the Unicellular Holozoa Network Shows               cluded (augmented networks). BRIDES analysis showed that
 Potential Undiscovered Diversity                                     ENV sequences of unicellular Holozoa created numerous new
                                                                      paths in the augmented similarity networks (fig. 3C), guiding
 The general structure of the network provided an overview of
                                                                      the discovery of evolutionary relevant novel sequences. First,
 the unicellular Holozoa diversity and highlighted potential
                                                                      despite the enhanced molecular diversity provided by the Tara
 new diversity (fig. 1). First, we computed the closeness of all
                                                                      Oceans data set, some REF nodes remained disconnected
 nodes (figs. 2 and 3 and supplementary material 1,
                                                                      from other REF nodes, indicating that the diversity of most
 Supplementary Material online) to test whether the distribu-
                                                                      ENV sequences was not close enough to fill the gaps between
 tion of closeness values for REF nodes was: 1) significantly
                                                                      REF sequences. This was especially noticeable for networks
 different and 2) significantly higher than the distribution of
                                                                      built at high similarity thresholds. At 97% threshold, the
 closeness values for ENV nodes, using Wilcoxon signed-rank
                                                                      vast majority of paths were impasses (I), meaning that ENV
 test. The results showed that ENV nodes were significantly
 more peripheral than REF nodes (Wilcoxon signed-rank test,           sequences did not create bridges between REF sequences in
 P value < 0.01**) (fig. 3A) in all networks. This result indicates   the augmented network (supplementary fig. 2,
 a high amount of potential new diversity in our unicellular          Supplementary Material online). This is logical because, given
 Holozoa data set from Tara Oceans. Not only the closeness            this high level of stringency, only sequences from the closest
 distributions for REF nodes were significantly higher than that      related holozoan lineages would connect in a given CC, con-
 for ENV nodes but also their shapes were different. At 85%,         firming the general divergent nature of most ENV sequences
 87%, and 90% identity similarity thresholds, most close-           with respect to sequences from sequenced holozoan taxa.
 ness values of both ENV and REF distributions were low (95%          Interestingly, when lowering the similarity threshold required
 confident interval between 0.2 and 0.4, approximately), and          to connect sequences in the networks, the proportion of
 only few nodes presented a closeness value of 1. On the other        impasses decreased, showing that some of these divergent
 hand, at 95 and 97% identity thresholds, when the net-             ENV sequences started to connect some REF sequences. Still,
 work was more disconnected into divergent clusters of similar        at 85% identity, some Holozoa REF sequences remained
 sequences, the distributions of closeness values for ENV nodes       disconnected, suggesting that the Tara Oceans data set did
 were scattered along a wider range of higher closeness values        not provide evidence for ENV groups bridging phylogenetic
 (0.2–1). This change reflected the fragmentation of the net-        gaps between some known Holozoan clades. Possible explan-
 work into more but smaller CCs.                                      ations to this amount of impasses may be: 1) a lack of suffi-
    Next, we analyzed the assortativity, which showed signif-         cient sampling effort, 2) the absence of intermediate ENV
 icant preferential connections between ENV sequences. For            sequences in marine water columns (there may be in other
 every network, we computed 1) the distribution of null assor-        habitats), 3) the nature of the Holozoa clade, which may be
 tativity values by randomly shuffling the ENV and REF node           comprised some significantly divergent lineages without ex-
 labels, and we contrasted these values with 2) the assortativity     tant intermediate diversity between them, or 4) that most

 1668     Genome Biol. Evol. 12(9):1664–1678 doi:10.1093/gbe/evaa117 Advance Access publication 13 June 2020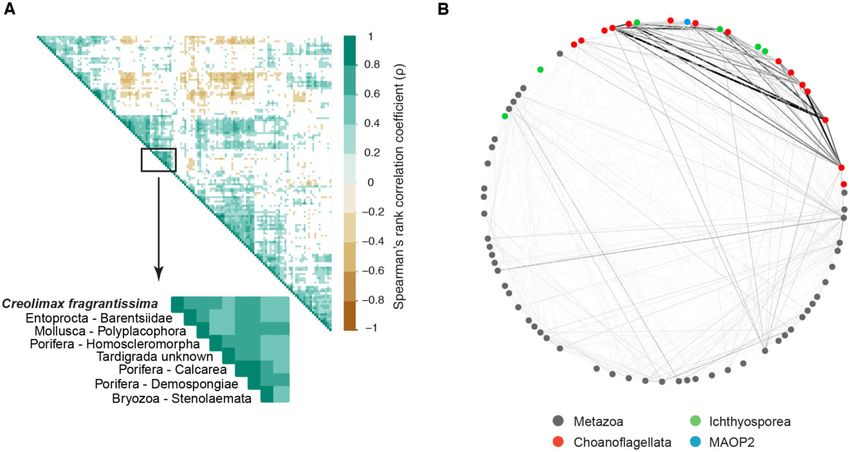
Potential Novel Unicellular Group Related to Animals from the Tara Oceans Expedition                                                         GBE

                                                                                                                                                                  Downloaded from https://academic.oup.com/gbe/article/12/9/1664/5857131 by guest on 06 December 2020

     FIG. 3.—Network approach to the analysis of novel diversity of unicellular Holozoa. (A) Closeness distribution of reference nodes was significantly higher
than that of environmental nodes. This showed that environmental nodes were located at the periphery of the connected components because they were

Genome Biol. Evol. 12(9):1664–1678 doi:10.1093/gbe/evaa117 Advance Access publication 13 June 2020                                                     1669
Arroyo et al. GBE
ENV sequences belong to groups branching outside currently OTUs clustered within freshwater environmental choanofla-
described Holozoans. gellate groups, such as FRESCHO3 or FRESCHO1, which
On the other hand, breakthroughs (B) and shortcuts (S) shows a wider ecosystem range in which these species can
were increasingly observed in networks at lower thresholds inhabit. We confirmed the good quality of these phylogenetic
(fig. 3C). These two types of paths correspond to sequences placements gauging the likelihood and distance between
that introduce either new paths between known Holozoan placements (supplementary fig. 3A and B, Supplementary
groups (B) or new ENV sequences closely related to known Material online). Alignments and the full tree of figure 3D
groups, and likely belonging to known clades (S). Thus, under can be found in supplementary material 2, Supplementary
the hypothesis that an intermediate position in the network Material online.
reflected an intermediate phylogenetic position in the corre- Our second approach to examine in detail the novelty in
Downloaded from https://academic.oup.com/gbe/article/12/9/1664/5857131 by guest on 06 December 2020
sponding sequence phylogeny (Atkinson et al. 2009; Meheust unicellular Holozoa was to perform a shortest path distance
et al. 2018), we assumed B paths could potentially indicate analyses between every ENV node and its closest REF node in
ENV sequences branching in between two phylogenetically the network (fig. 4). The longer the topological distance be-
distant groups of Holozoans in a phylogenetic tree, whereas S tween REF and ENV nodes, the more divergent the ENV se-
paths may potentially indicate ENV sequences branching quence is, because many steps are required to reach the
within a less divergent group of sampled holozoans (supple- nearest REF sequence. The most extreme case is the infinite
mentary fig. 2, Supplementary Material online). Overall, the distance, shown by ENV nodes belonging to exclusively envi-
presence of a high proportion of B and S paths (36.93% at ronmental CCs. Our results showed that indirect connections
85%, 33.22% at 87%, 45.42% at 90% ID) suggested to REF (when there are >1 step from ENV to REF) were the
that Tara Oceans data hinted at the existence of novel, phy- most abundant, ranging from 92.5% of all ENV nodes at
logenetically relevant, holozoan diversity. 85% ID similarity network to 69.83% at 97% identity
To corroborate the potential novelty of those sequences (fig. 4A). In addition, networks at higher similarity thresholds
and have a better understanding of their phylogenetic posi- (95% identity and 97% identity) exhibited a high propor-
tion within Holozoa, we performed phylogenetic placement tion of infinite distances (15.39% of ENV nodes at 95%
analyses (see Materials and Methods). In particular, we ana- similarity threshold; 30.56% at 97% similarity threshold)
lyzed the OTUs that created breakthroughs and shortcuts in (fig. 4A). We then extracted those distant ENV OTUs to per-
the network at 85% similarity threshold (fig. 3D). These OTUs form phylogenetic placement against a curated reference
unraveled novelty within Acanthoecida, one of the two sub- Holozoa tree (see Materials and Methods). The deepest nov-
groups of Choanoflagellatea. A group of 6 sequences or elty (understood as the diversity that lays in deeper, more
OTUs (with a total of 1,675 reads) branched off internal nodes in the Holozoan tree) was observed in the net-
Choanoflagellate H, suggesting a potential novel environ- works at 95% and 97% thresholds. We performed a
mental group of acanthoecids. Another group of 3 sequences specific phylogenetic placement of this deep novelty, shown
(including one of the most abundant OTUs in the whole Tara in figure 4B. A group of 21 OTUs with a total abundance of
Oceans data set: OTU 2703, with >28,000 reads) appeared 6,244 reads was located in the most internal branch outside
to be the sister group of Choanoflagellate G. The importance Choanoflagellata, specifically scattered across the internal
of this result lies in the fact these OTUs did not cluster together branches of choanoflagellates and Syssomonas multiformis.
with the already morphologically described Choanoflagellate These OTUs were mainly recovered in the pico (0.8–3/5 lm)
G species (i.e., Acanthocorbis unguiculata, Acanthoeca spec- and nano (3/5–20 lm) fraction sizes from the Indian Ocean
tabilis, Savillea micropora, Helgoeca nana), but branched at an and Mediterranean Sea. Inspired by its uncertain phylogenetic
internal node, showing their divergent nature. We also recov- position and the small size, we tentatively named this group
ered the second earliest diverging acanthoecid (OTU 5953, as MASHOL (standing for MArine Small HOLozoa). The quality
with 7,448 reads), splitting apart from the reference sequence of the placement test revealed that the placements had very
JQ223245, which had already been identified as a divergent low likelihood weight ratios (supplementary fig. 3D,
choanoflagellate (del Campo et al. 2015). Finally, several Supplementary Material online), although all of them were
more divergent. Two asterisks mark the significance of the Wilcoxon signed-rank test when P value < 0.01. (B) Assortativity values were significantly positive
in all networks, meaning that environmental nodes tended to connect preferentially together rather than with reference nodes. (C) BRIDES analysis.
Environmental OTUs from unicellular Holozoa created new paths with respect to the original reference network, as green bars show (see supplementary
fig. 2, Supplementary Material online, for details about each type of path). (D) New molecular groups in Choanoflagellatea. Phylogenetic placement of the
OTUs that created breakthroughs and shortcuts at 85% similarity threshold in (C; in red) against a curated reference tree of unicellular Holozoa. We
computed the placement using the RAxML-EPA algorithm with the GTRþCATþI evolutionary model (Berger et al. 2011). Several OTUs branched off some
acanthoecid clades, such as Choanoflagellate I, G, and H, showing a different diversity from the extant known species. This novel molecular diversity is well
supported by the high abundance of some OTUs (shown as the number in brackets) and the good quality of their placement (supplementary fig. 3A and B,
Supplementary Material online). Alignments and the full phylogenetic tree can be found in supplementary material 2, Supplementary Material online.
1670 Genome Biol. Evol. 12(9):1664–1678 doi:10.1093/gbe/evaa117 Advance Access publication 13 June 2020Potential Novel Unicellular Group Related to Animals from the Tara Oceans Expedition GBE
Downloaded from https://academic.oup.com/gbe/article/12/9/1664/5857131 by guest on 06 December 2020
FIG. 4.—Potential new group of unicellular Holozoa (MASHOL) found branching off Choanoflagellatea. (A) Shortest path analysis showed that a
considerable proportion of environmental nodes have infinite distance with their closest reference node (15.39% in the network at 95% similarity
threshold; 30.56% in the network at 97%). These ENV nodes were not connected to any reference node whatsoever, suggesting a substantial amount of
diverging diversity. (B) Phylogenetic placement of the 21 OTUs that exhibited infinite distance in the networks at 95% and 97% similarity threshold in (A).
All OTUs were allocated in internal branches, outside Choanoflagellatea and Syssomonas multiformis, depicted as a thick magenta line. The lack of high
support (measured as likelihood weight ratio or LWR) in the placements suggests a deep uncertainty about the exact placement of these sequences in the
Holozoa tree of life (supplementary fig. 3D, Supplementary Material online). However, their narrow scattering over the tree and their clear position in internal
rather than external branches open the possibility for these OTUS to be a potential new Holozoa group that we tentatively named as MASHOL (for Marine
Small HOLozoa). Phylogenetic placement was carried out using RAxML-EPA algorithm (Berger et al. 2011) under the GTRþCATþI evolutionary model.
Alignments and the full phylogenetic tree can be found in supplementary material 3, Supplementary Material online.
Genome Biol. Evol. 12(9):1664–1678 doi:10.1093/gbe/evaa117 Advance Access publication 13 June 2020 1671Arroyo et al. GBE
located around the same internal branches in the tree. As 97% identity), it shows a tendency of OTUs from the same
Mahe et al. (2017) pointed out, these low-probability place- geographical region to be more associated between them,
ments do not necessarily mean that they are incorrect, but hence genetically more similar, than with OTUs from other
they hold a high molecular distance with the reference regions.
sequences in the tree. This result indicates that these OTUs Regarding the depth in the water column, the majority of
do not really belong to any of the already known unicellular the unicellular Holozoans were preferentially located in the
holozoan lineages, although its exact position remains uncer- surface or the deep chlorophyll maximum (DCM) layers
tain. In any case, they probably represent a novel clade among (fig. 5B). This tendency indicates that holozoan sequences in
Holozoa. the upper layers were more similar than those sampled at
lower depths (positive assortativity, supplementary table,
Downloaded from https://academic.oup.com/gbe/article/12/9/1664/5857131 by guest on 06 December 2020
Unicellular Holozoans Are Globally Distributed, with Some Supplementary Material online). Even though these are low
Lineages Showing Specific Geographical Patterns positive numbers, they were significantly different from the
random shuffled distribution (one-sample t-test, P val-
There is no data on the geographical distribution of unicellular
ue < 0.01**), which supported the tendency for a shallower
Holozoa. Thus, we decided to take the most of the Tara
preference location.
Oceans data set and evaluate the geographical distribution
Finally, unicellular holozoans were recovered from a wide
of the different unicellular holozoan lineages across oceans,
range of size fractions (fig. 5C). For example, within
layers of the water column, and size fractions. In general, all
Choanoflagellata, the majority of Acanthoecida abundance
lineages of unicellular Holozoa were widely distributed across
(69.37%) was present in the nano fraction (3/5–20 lm), fol-
the world’s oceans (fig. 5A). Ichthyosporeans were the most
lowed by 19.4% in the pico fraction (0.8–3/5 lm). Filasterean
homogeneously dispersed group across all oceans. There
reads were mainly found in meso (43.18%) and nano
were, however, some exceptions. For example,
(46.21%) fractions. Ichthyosporeans had a different pattern
Acanthoecida choanoflagellates were more abundant in the
of sizes (fig. 5C). The distribution of Dermocystida reads was
Arctic samples (60.29% of total abundance), and in contrast
shifted toward the largest fractions (10.96%, 19.98%, and
to Craspedida (4.5%) (fig. 5A). These results are consistent
57.73% in meso, micro, and nano fractions, respectively). On
with previous morphological studies of choanoflagellates in
the contrary, the distribution of Ichthyophonida reads was
sea ice (Thomsen et al. 1997). OTUs assigned to Filasterea
shifted toward the smallest fractions (24.46% in nano and
were widely distributed, but their abundance was higher in
61.97% in pico fractions). OTUs associated with
the samples coming from the South Pacific Ocean (43.37%),
Corallochytrea were preferentially found in the pico, nano,
Red Sea (24.7%), and Indian Ocean (16.97%) (fig. 5A). OTUs
and pico–nano fractions (0.8–20 lm). Finally, both MAOP
related to Corallochytrea group were widely distributed, al-
groups were more present in the smallest fractions: nano
though the OTU with the highest abundance (OTU 30781,
(54.94%) and pico (37.81%), which differ from previous find-
248 reads) was mainly located in the North Pacific Ocean
ings that showed MAOP dominating the micro fraction (del
(fig. 5A). Both the Indian Ocean and the Arctic Ocean held
Campo and Ruiz-Trillo 2013). Nevertheless, these results are
30% of the reads of corallochytreans (fig. 5A). On the con-
consistent with these authors, who already suggested that
trary, the presence of corallochytreans in the Atlantic Ocean
MAOP group might be composed by species with different
seemed to be insignificant. Regarding the environmental
sizes. The MAOP group might also undergo a life cycle with
groups Marine Opisthokonts 1 and 2 (MAOP1 and MAOP2,
several stages that include different cell sizes. The preferential
respectively), they showed a pattern of distribution similar to
location of different holozoan lineages in different size frac-
Choanoflagellata. MAOP2 appeared to be most abundant
tions can be seen in the assortativity values (supplementary
and with more OTUs than MAOP1, in contrast to what had
table, Supplementary Material online). In all networks, assor-
been found in European coastal waters (del Campo et al.
tativity coefficients of fraction sizes were the highest among
2015). Moreover, although MAOP1 was not found in the
all elements considered (depths, oceanic provinces, oceans,
Arctic or Antarctic Oceans, MAOP2 exhibited 36% of its
and size). These values were also significant compared with
abundance in the Arctic, expanding to the maximum the
the distribution of randomly shuffled labels (one-sample t-
range of geographical locations in which this environmental
test, P value < 0.01**), indicating a tendency for similar
group has been found up to now (fig. 5A) (Romari and Vaulot
Holozoa sequences to be found in specific size fraction, com-
2004; Amacher et al. 2009; Edgcomb et al. 2011; Marshall
pared with other sizes.
and Berbee 2011). Assortativity coefficients of geographical
distribution across oceans and oceanic provinces showed pos-
itive values in all networks (supplementary table, Co-Occurrence of Creolimax fragrantissima and Its Animal
Supplementary Material online). Even though these values Hosts
were not very high (a range from 0.016 in the network at Some of these unicellular species, especially the
85% identity similarity threshold to 0.046 in the network at Ichthyosporea, have been previously described as animal
1672 Genome Biol. Evol. 12(9):1664–1678 doi:10.1093/gbe/evaa117 Advance Access publication 13 June 2020Potential Novel Unicellular Group Related to Animals from the Tara Oceans Expedition GBE
Downloaded from https://academic.oup.com/gbe/article/12/9/1664/5857131 by guest on 06 December 2020
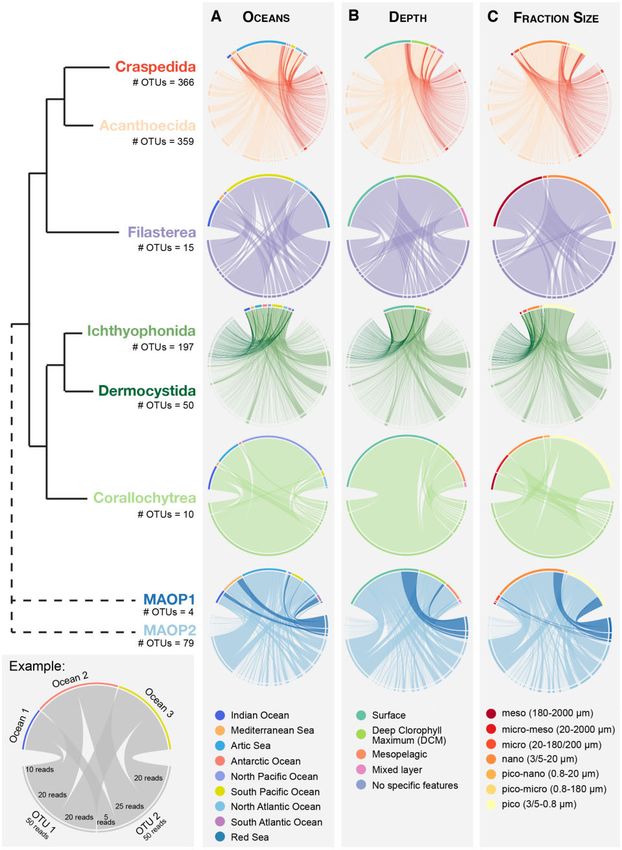
FIG. 5.—Geographical distribution of unicellular Holozoa OTUs from the Tara Oceans expedition. As depicted in the example (bottom left panel), chord
diagrams show OTUs on the bottom half of the circle, and oceanic regions, depths, and fraction sizes on the upper half. Each OTU is represented by a line,
whose thickness depicts the OTUs abundance in that particular place. In general, all unicellular holozoans were widespread and located in surface or DCM
layers of the water column. However, some had different preferential geographical location (i.e., MAOP1 vs. MAOP2, or Craspedida vs. Acanthoecida), or
fraction sizes (i.e., Ichthyophonida vs. Dermocystida, or Craspedida vs. Acanthoecida). Note that the thickness of each OTU is relative to the amount of OTUs
in each group, so comparisons between lineages are not possible. Numbers below group names indicate the number of OTUs.
Genome Biol. Evol. 12(9):1664–1678 doi:10.1093/gbe/evaa117 Advance Access publication 13 June 2020 1673Arroyo et al. GBE
Downloaded from https://academic.oup.com/gbe/article/12/9/1664/5857131 by guest on 06 December 2020
FIG. 6.—Co-occurrence analysis between unicellular Holozoa OTUs and animal classes from Tara Oceans. (A) Heatmap representing the Spearman’s
rank correlation coefficient (q). The ichthyosporean symbiont Creolimax fragrantissima had the strongest correlation coefficient (qS¼0.6–0.8, P < 0.01**)
with several animal phyla, suggesting a wider diversity of animal hosts in which this organism can dwell. Full heatmap can be found in supplementary figure
4A, Supplementary Material online. (B) Network depicting other possible associations, besides monotonic and linear. The environmental clades marine
ichthyosporea 1 (MAIP1) and marine opisthokonta 2 (MAOP2) were connected with several animal phyla, suggesting nonexclusive free-living lifestyles, or
coincidence due to the use of same ecological resources. Full network can be found in supplementary figure 4B, Supplementary Material online.
parasites or symbionts (Mendoza et al. 2002; Glockling et al. We also found that the environmental group Marine
2013). To see whether our data could illuminate us on this Ichthyosporea 1 (MAIP1) was associated with
aspect, we checked if there was any association between the Acoelomorpha, Arthropoda (Hexapoda, Crustacea),
presence of unicellular Holozoa and animals. Bryozoa, Cnidaria, Nematoda (Enoplea), and Chordata
Our results showed that there were indeed significant pos- (Tunicata, Craniata). This result suggests that the environmen-
itive and negative correlations between unicellular Holozoa tal group MAIP1 may be associated with animal phyla and not
and animals (fig. 6A). The strongest positive correlation being exclusively free-living. Another interesting result was
(Spearman’s rank correlation coefficient, qS¼0.6–0.8, the interaction between MAOP2 and Ctenophora
P < 0.01**) was shown between OTUs associated with (qS¼0.409) or Mollusca (Cephalopoda) (qS¼0.317), which
C. fragrantissima and several animal phyla such as could imply that these taxa use the same resources or have
Entoprocta (Barentsiidae), Mollusca (Polyplacophora), some ecological interaction, as it was found for other envi-
Tardigrada, and Porifera (Homoscleromorpha, Calcarea, and ronmental groups (Lima-Mendez et al. 2015; Lambert et al.
Demospongiae). To see if we could detect other associations 2019).
but monotonic and linear (as Spearman and Pearson describe, Regarding MASHOL, the potential new Holozoa group de-
respectively), we used a bipartite network (fig. 6B). We cor- scribed here, no strong correlations could be found with any
roborated the previous finding of C. fragrantissima with sev- animal group, suggesting that this environmental group
eral animal phyla, specifically with Polyplacophora might be free-living or not have a strong association with
(qS¼0.465), Calcarea (qS¼0.352), and Demospongiage any particular animal phyla.
(qS¼0.311). Creolimax fragrantissima was isolated 27 times Overall, these results suggest more complex ecological
from invertebrate guts, mostly from a sipunculid species, but interactions between parasitic/symbiotic unicellular holozoans
also one tunicate, sea cucumber, and chiton (Marshall et al. and animals than what it is currently known. These biotic
2008). Thus, our results corroborated some symbiotic rela- effects (grazing, pathogenicity, and parasitism) have been
tionships (with Polyplacophora, commonly known as chiton) reported to explain 82% of the variability in the Tara
and suggested some other putative hosts (Entoprocta, Oceans interactome, giving a greater importance to these
Tardigrada, and Porifera). interspecific connections (Lima-Mendez et al. 2015). This
1674 Genome Biol. Evol. 12(9):1664–1678 doi:10.1093/gbe/evaa117 Advance Access publication 13 June 2020Potential Novel Unicellular Group Related to Animals from the Tara Oceans Expedition GBE
also implies that sampling within animal phyla may still be a length range of this region (Amaral-Zettler et al. 2009). The
useful method to isolate new species from unicellular holozo- second database, PR2-Opistho, was a well-curated and
ans. However, we refuse to claim that correlation implies cau- updated version of the original PR2 database for
sation. What is certain though is that metabarcoding has a Opisthokonta clade. This database (PR2-Opistho) was also
great power to assess diversity in its multiple forms, from pure trimmed with the Tara Oceans primer sequences to keep
ecological and evolutionary studies to applied conservation- only the V9 region. The third database, PR2_V9, was gener-
ism, which is of vital importance in a world of threat to ated by the Tara Oceans consortium (de Vargas et al. 2015).
biodiversity. Because both PR2-Opistho and PR2_V9 were originally gen-
erated from PR2 database, we eliminated redundancies and
kept the taxonomical annotation from the PR2-Opistho data-
Conclusions
Downloaded from https://academic.oup.com/gbe/article/12/9/1664/5857131 by guest on 06 December 2020
base. Finally, we combined all databases, producing a global
Our analysis of metabarcoding data from Tara Oceans using reference database of 49,379 eukaryotic sequences.
sequence similarity networks shows a greater diversity of uni- To retrieve the unicellular Holozoa sequences, we per-
cellular holozoans than previously sampled, including a po- formed a phylogenetic placement of both environmental
tential novel clade. Our data also demonstrate global and reference data sets against a eukaryotic reference tree
geographical distribution from most unicellular holozoans and took those that branched within Holozoa and outside
and pinpoint to potential associations with different animal animals. A phylogenetic placement consists of mapping short
phyla. amplicons (in this case, Tara Oceans OTUs) into a fixed refer-
ence tree made from full-length 18S rDNA sequences. This
reference was constructed using 130 full 18S sequences that
Materials and Methods covered all eukaryotic groups. We performed the phyloge-
Data Sets netic placement using the RAxML-EPA algorithm (Berger
The initial environmental data set was provided by the Tara et al. 2011) and we selected the sequences that were placed
into unicellular Holozoa using the Cþþ script extract_clade_-
Oceans consortium, which contained a total of 474,303 OTUs
placements from Genesis software v0.18.1 (Czech and
from all eukaryotic clades. Note that this is the full data set
Stamatakis 2016). Therefore, the starting data set of unicel-
generated in the expedition, not the one used in de Vargas
lular Holozoa contained 2,426 sequences (2,197 were envi-
et al. (2015), as the latter is a subsample of the former. The
ronmental from Tara Oceans, whereas 229 were reference
Tara Oceans consortium provided us with this data set already
sequences). This data set can be found in supplementary ma-
cleaned, filtered, and clustered. During the first steps of the
terial 4, Supplementary Material online.
bioinformatic pipeline, they merged, dereplicated, and quality
filtered the original V9 barcodes. A chimera detection analysis
was carried out using the usearch program (Edgar et al.
Similarity Network Construction
2011). After a filtering process to discard possible spurious We built the initial similarity network based on a BLAST all-
reads, barcodes were clustered using Swarm approach against-all of the unicellular Holozoa data set. We used BlastN
(Mahe et al. 2017). For further details on the OTU table gen- v2.7.1þ (Camacho et al. 2009), with the following options: E-
eration, see http://taraoceans.sb-roscoff.fr/EukDiv/. valueArroyo et al. GBE
annotated. Thus, we decided to use a phylogenetic method to Novelty Assessment: Phylogenetic Placement
taxonomically assign the rest of the unannotated OTUs: tax2- In order to validate the putative novel diversity previously
tree algorithm (McDonald et al. 2012). This software requires obtained with BRIDES and shortest path analyses, we per-
the structure of the phylogenetic tree of both reference and formed a phylogenetic placement of the OTUs into our cu-
unannotated sequences. Then, it assigns the taxonomy to the rated reference Holozoa tree, which can be found in
unannotated tips, given a file with the taxonomical informa- supplementary material 5, Supplementary Material online.
tion of the annotated tips. We could successfully annotate We aligned the sequences using PaPaRa with default param-
1,503 additional sequences. Thus, a total of 1,941 sequences eters (Berger and Stamatakis 2011) and manually examined
(78.8% of the initial data set) could be taxonomically the alignment and corrected wrong positions in Geneious
annotated. v9.0.5 (Kearse et al. 2012). We then trimmed the nonhomol-
Downloaded from https://academic.oup.com/gbe/article/12/9/1664/5857131 by guest on 06 December 2020
ogous positions with trimAl 1.4.rev15, setting the gap thresh-
Sequence Similarity Network Analyses old option at 0.2 for the alignment of selected sequences
To address the molecular diversity and novelty of unicellular found on B and on S paths by ourBRIDES analysis (Capella-
Holozoa, we analyzed topological metrics, as well as closeness Gutierrez et al. 2009). Regarding the alignment of divergent
and assortativity using NetworkX v2.1 library on python 3.5.1 sequences identified by our shortest path analyses, the trim-
(Hagberg et al. 2008). ming was done manually, removing those positions with a
mean pairwise identity over all pairsPotential Novel Unicellular Group Related to Animals from the Tara Oceans Expedition GBE
species in unicellular Holozoa. We used “corrplot” and Corel E, Lopez P, M eheust R, Bapteste E. 2016. Network-thinking: graphs
“Hmisc” libraries in Rstudio v.1.1.383 to perform the analyses to analyze microbial complexity and evolution. Trends Microbiol.
24(3):224–237.
(RStudio 2017; Wei et al. 2017; Harrell 2019). These consist of Czech L, Stamatakis A. 2016. Genesis. a toolkit for working with phylo-
building a correlation matrix among all pairwise comparisons genetic data. Available from: https://github.com/lczech/genesis.
and then extract the significant relationships (Spearman’s sig- del Campo J, et al. 2014. The others: our biased perspective of eukaryotic
nificance < 0.01**), which finally were plotted in a heatmap. genomes. Trends Ecol Evol. 29(5):252–259.
There was a possibility, however, that some associations del Campo J, et al. 2015. Diversity and distribution of unicellular opistho-
konts along the European coast analysed using high-throughput se-
could be neither monotonic nor linear. In that case, we would quencing. Environ Microbiol.
not be able to detect them using Spearman’s or Pearson’s del Campo J, Ruiz-Trillo I. 2013. Environmental survey meta-analysis
correlation coefficients. We used instead MICtools package reveals hidden diversity among unicellular opisthokonts. Mol Biol
Downloaded from https://academic.oup.com/gbe/article/12/9/1664/5857131 by guest on 06 December 2020
(Albanese et al. 2018), which is able to identify a wider range Evol. 30(4):802–805.
de Vargas C, et al. 2015. Eukaryotic plankton diversity in the sunlit ocean.
of relationships in large data sets and assess their statistical
Science 348(6237):1261605–1261612.
significance. Final networks were created using Cytoscape Edgcomb V, et al. 2011. Protistan microbial observatory in the Cariaco
3.3.0 (Shannon et al. 2003). Basin, Caribbean. I. Pyrosequencing vs Sanger insights into species
richness. ISME J. 5(8):1344–1356.
Forster D, et al. 2015. Testing ecological theories with sequence similarity
Supplementary Material networks: marine ciliates exhibit similar geographic dispersal patterns
Supplementary data are available at Genome Biology and as multicellular organisms. BMC Biol. 13(1):16.
Forster D, et al. 2019. Improving eDNA-based protist diversity assessments
Evolution online.
using networks of amplicon sequence variants. Environ Microbiol.
21(11):4109–4124.
Glockling SL, Marshall WL, Gleason FH. 2013. Phylogenetic interpretations
Acknowledgments and ecological potentials of the Mesomycetozoea (Ichthyosporea).
Fungal Ecol. 6(4):237–247.
We thank Ramo n Massana, Philippe Lopez, and Ramiro
Grau-Bov e X, et al. 2017. Dynamics of genomic innovation in the unicel-
Logares for discussion on the article. This work was supported lular ancestry of animals. Elife 6:e26036.
by grants (BFU2014-57779-P and BFU2017-90114-P) from Gu Z, Gu L, Eils R, Schlesner M, Brors B. 2014. circlize implements and
Ministerio de Economıa y Competitividad (MINECO), enhances circular visualization in R. Bioinformatics 30(19):2811–2812.
Hagberg AA, Schult DA, Swart PJ. 2008. Exploring network structure,
Agencia Estatal de Investigacion (AEI), and Fondo Europeo
dynamics, and function using NetworkX. In: Varoquaux G, Vaught
de Desarrollo Regional (FEDER) to I.R.-T. T, Millman J, editors. Proceedings of the 7th Python in Science
Conference (SciPy2008). Pasadena (CA). p. 11–15.
Harrell FE. 2019. Hmisc: Harrell miscellaneous. Available from: https://
Literature Cited github.com/harrelfe/Hmisc.
Albanese D, Riccadonna S, Donati C, Franceschi P. 2018. A practical tool Hugerth LW, et al. 2014. Systematic design of 18S rRNA gene primers for
for maximal information coefficient analysis. Gigascience 7(4):1–8. determining eukaryotic diversity in microbial consortia. PLoS One
Amacher J, Neuer S, Anderson I, Massana R. 2009. Molecular approach to 9(4):e95567.
determine contributions of the protist community to particle flux. Kearse M, et al. 2012. Geneious Basic: an integrated and extendable
Deep Sea Res. 56(12):2206–2215. desktop software platform for the organization and analysis of se-
Amaral-Zettler LA, McCliment EA, Ducklow HW, Huse SM. 2009. A quence data. Bioinformatics 28(12):1647–1649.
method for studying protistan diversity using massively parallel se- Krabberød AK, Bjorbækmo MFM, Shalchian-Tabrizi K, Logares R. 2017.
quencing of V9 hypervariable regions of small-subunit ribosomal Exploring the oceanic microeukaryotic interactome with metaomics
RNA genes. PLoS One 4(7):e6372. approaches. Aquat Microb Ecol. 79(1):1–12.
Arroyo AS, Lo pez-Escardo D, Kim E, Ruiz-Trillo I, Najle SR. 2018. Novel Lambert S, et al. 2019. Rhythmicity of coastal marine picoeukaryotes,
diversity of deeply branching holomycota and unicellular holozoans bacteria and archaea despite irregular environmental perturbations.
revealed by metabarcoding in middle Paran a River, Argentina. Front ISME J. 13(2):388–401.
Ecol Evol. 6:99. Lang BF, O’Kelly C, Nerad T, Gray MW, Burger G. 2002. The closest uni-
Atkinson HJ, Morris JH, Ferrin TE, Babbitt PC. 2009. Using sequence sim- cellular relatives of animals. Curr Biol. 12(20):1773–1778.
ilarity networks for visualization of relationships across diverse protein Layeghifard M, Hwang DM, Guttman DS. 2017. Disentangling interac-
superfamilies. PLoS One 4(2):e4345. tions in the microbiome: a network perspective. Trends Microbiol.
Berger SA, Krompass D, Stamatakis A. 2011. Performance, accuracy, and 25(3):217–228.
web server for evolutionary placement of short sequence reads under Letunic I, Bork P. 2007. Interactive Tree Of Life (iTOL): an online tool for
maximum likelihood. Syst Biol. 60(3):291–302. phylogenetic tree display and annotation. Bioinformatics
Berger SA, Stamatakis A. 2011. Aligning short reads to reference align- 23(1):127–128.
ments and trees. Bioinformatics 27(15):2068–2075. Lima-Mendez G, et al. 2015. Determinants of community structure in the
Camacho C, et al. 2009. BLASTþ: architecture and applications. BMC global plankton interactome. Science 348(6237):1262073–1262073.
Bioinformatics 10(1):421. Logares R, et al. 2014. Patterns of rare and abundant marine microbial
Capella-Gutierrez S, Silla-Martınez JM, Gabaldo n T. 2009. trimAl: a tool eukaryotes. Curr Biol. 24(8):813–821.
for automated alignment trimming in large-scale phylogenetic analy- Lord E, et al. 2016. BRIDES: a new fast algorithm and software for char-
ses. Bioinformatics 25(15):1972–1973. acterizing evolving similarity networks using breakthroughs,
Genome Biol. Evol. 12(9):1664–1678 doi:10.1093/gbe/evaa117 Advance Access publication 13 June 2020 1677Arroyo et al. GBE
roadblocks, impasses, detours, equals and shortcuts. PLoS One Romari K, Vaulot D. 2004. Composition and temporal variability of picoeu-
11(8):e0161474. karyote communities at a coastal site of the English Channel from 18S
Mahe F, et al. 2017. Parasites dominate hyperdiverse soil protist commu- rDNA sequences. Limnol Oceanogr. 49(3):784–798.
nities in Neotropical rainforests. Nat Ecol Evol. 1. RStudio T. 2017. Rstudio: integrated development for R. Available from:
Marshall WL, Berbee ML. 2011. Facing unknowns: living cultures (Pirum http://www.rstudio.com.
gemmata gen. nov., sp. nov., and Abeoforma whisleri, gen. nov., sp. Ruiz-Trillo I, et al. 2004. Capsaspora owczarzaki is an independent opis-
nov.) from invertebrate digestive tracts represent an undescribed clade thokont lineage. Curr Biol. 14(22):R946–R947.
within the unicellular opisthokont lineage Ichthyosporea Ruiz-Trillo I, et al. 2007. The origins of multicellularity: a multi-taxon ge-
(Mesomycetozoea). Protist 162(1):33–57. nome initiative. Trends Genet. 23(3):113–118.
Marshall WL, Celio G, McLaughlin DJ, Berbee ML. 2008. Multiple isolations Ruiz-Trillo I, Roger AJ, Burger G, Gray MW, Lang BF. 2008. A phyloge-
of a culturable, motile Ichthyosporean (Mesomycetozoa, nomic investigation into the origin of Metazoa. Mol Biol Evol.
Opisthokonta), Creolimax fragrantissima n. gen., n. sp., from marine 25(4):664–672.
Downloaded from https://academic.oup.com/gbe/article/12/9/1664/5857131 by guest on 06 December 2020
invertebrate digestive tracts. Protist 159(3):415–433. Shalchian-Tabrizi K, et al. 2008. Multigene phylogeny of Choanozoa and
McDonald D, et al. 2012. An improved Greengenes taxonomy with explicit the origin of animals. PLoS One 3(5):e2098.
ranks for ecological and evolutionary analyses of bacteria and archaea. Shannon P, et al. 2003. Cytoscape: a software environment for integrated
ISME J. 6(3):610–618. models of biomolecular interaction networks. Genome Res.
Meheust R, et al. 2018. Hundreds of novel composite genes and chimeric 13(11):2498–2504.
genes with bacterial origins contributed to haloarchaeal evolution. Thomsen HA, Garrison DL, Kosman C. 1997. Choanoflagellates
Genome Biol. 19(1):75. (Acanthoecidae, Choanoflagellida) from the Weddell sea, Antarctica,
Mendoza L, Taylor JW, Ajello L. 2002. The class Mesomycetozoea: a het- taxonomy and community structure with particular emphasis on the
erogeneous group of microorganisms at the animal-fungal boundary. ice biota; with preliminary remarks on Choanoflagellates from Arctic
Annu Rev Microbiol. 56(1):315–344. sea ice (Northeast Water Polynya). G Arch Protistenkd. 148(1–
Newman MEJ. 2003. Mixing patterns in networks. Phys Rev E. 67(2):1–13. 2):77–114.
Ocan ~ a-Pallarès E, Najle SR, Scazzocchio C, Ruiz-Trillo I. 2019. Reticulate Torruella G, et al. 2012. Phylogenetic relationships within the
evolution in eukaryotes: origin and evolution of the nitrate assimilation Opisthokonta based on phylogenomic analyses of conserved single-
pathway. PLoS Genet. 15(2):e1007986. copy protein domains. Mol Biol Evol. 29(2):531–544.
Pathmanathan JS, Lopez P, Lapointe F-J, Bapteste E. 2018. Torruella G, et al. 2015. Phylogenomics reveals convergent evolution of
CompositeSearch: a generalized network approach for composite lifestyles in close relatives of animals and fungi. Curr Biol. 25:1–7.
gene families detection. Mol Biol Evol. 35(1):252–255. Valverde S, et al. 2018. The architecture of mutualistic networks as an
Pesant S, et al. 2015. Open science resources for the discovery and analysis evolutionary spandrel. Nat Ecol Evol. 2(1):94–99.
of Tara Oceans data. Sci Data. 2:150023. Wei T, et al. 2017. corrplot: visualization of a correlation matrix. Available
Pilosof S, Porter MA, Pascual M, K efi S. 2017. The multilayer nature of from: https://github.com/taiyun/corrplot.
ecological networks. Nat Ecol Evol. 1:0101.
Associate editor: Sandra Baldauf
1678 Genome Biol. Evol. 12(9):1664–1678 doi:10.1093/gbe/evaa117 Advance Access publication 13 June 2020You can also read