Spatiotemporal dynamic of COVID-19 mortality in the city of São Paulo, Brazil: shifting the high risk from the best to the worst socio-economic ...
←
→
Page content transcription
If your browser does not render page correctly, please read the page content below
Spatiotemporal dynamic of COVID-19 mortality in the city of São Paulo,
 Brazil: shifting the high risk from the best to the worst socio-economic
                                  conditions
       Patricia Marques Moralejo Bermudi1, Camila Lorenz1, Breno Souza de Aguiar2,
       Marcelo Antunes Failla2, Ligia Vizeu Barrozo3 and Francisco Chiaravalloti Neto1

1 Departamento de Epidemiologia, Faculdade de Saúde Pública da Universidade de São Paulo,
São Paulo, SP, Brazil

2 Gerência de Geoprocessamento e Informações Socioambientais (GISA) da Coordenação de
Epidemiologia e Informação (CEInfo) da Secretaria Municipal de Saúde de São Paulo, SP, Brazil

3 Departamento de Geografia, Faculdade de Filosofia, Letras e Ciências Humanas e Instituto de
Estudos Avançados da Universidade de São Paulo, São Paulo, SP, Brazil

                                         ABSTRACT

Currently, Brazil has one of the fastest increasing COVID-19 epidemics in the world, that has
caused at least 94 thousand confirmed deaths until now. The city of Sao Paulo is particularly
vulnerable because it is the most populous in the country. Analyzing the spatiotemporal
dynamics of COVID-19 is important to help the urgent need to integrate better actions to face
the pandemic. Thus, this study aimed to analyze the COVID-19 mortality, from March to July
2020, considering the spatio-time architectures, the socio-economic context of the population,
and using a fine granular level, in the most populous city in Brazil. For this, we conducted an
ecological study, using secondary public data from the mortality information system. We
describe mortality rates for each epidemiological week and the entire period by sex and age.
We modelled the deaths using spatiotemporal and spatial architectures and Poisson
probability distributions in a latent Gaussian Bayesian model approach. We obtained the
relative risks for temporal and spatiotemporal trends and socio-economic conditions. To
reduce possible sub notification, we considered the confirmed and suspected deaths. Our
findings showed an apparent stabilization of the temporal trend, at the end of the period, but
that may change in the future. Mortality rate increased with increasing age and was higher in
men. The risk of death was greater in areas with the worst social conditions throughout the
study period. However, this was not a uniform pattern over time, since we identified a shift
from the high risk in the areas with best socio-economic conditions to the worst ones. Our
study contributed by emphasizing the importance of geographic screening in areas with a
higher risk of death, and, currently, worse socio-economic contexts, as a crucial aspect to
reducing disease mortality and health inequities, through integrated public health actions.

1. Introduction

       Deaths from COVID-19, caused by the novel coronavirus of the severe acute
respiratory syndrome (SARS-CoV-2), are considered avoidable because some collective and
individual measures can prevent infection and because appropriate health assistance greatly
reduces death risks. Nevertheless, the risk of dying extremely varies according to some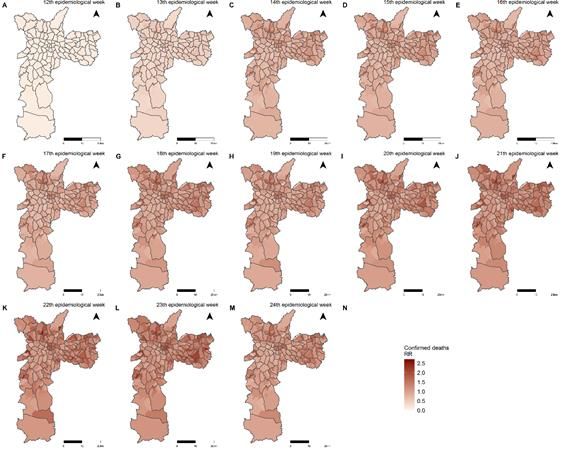
individual and geographic risk factors resulting in health inequity observed in several parts of
the world (Maroko et al., 2020; Wang and Tang, 2020) since the beginning of the pandemic.
In Brazil, COVID-19 was first reported in the city of São Paulo on February 25, 2020 (Souza
et al., 2020). Until August 3, four months after the first reported death, the disease had already
resulted in 2,733,677 confirmed cases and 94,104 deaths in the country (Brasil. Ministério da
Saúde, 2020a). At the moment, the United States of America and Brazil are the epicentre of
the disease.
         Brazil is the fifth country in the world in territory and population, classified as an upper-
middle-income economy (The World Bank, 2020). Almost 60% of the Brazilian population is
concentrated in 6% of the big cities among which São Paulo is the largest. The Brazilian
Unified Health System (SUS) guarantees healthcare for all citizens and thousands of
foreigners residing or passing through the country (Santos, 2018). Despite this universal and
whole care, geographic differences in mortality rates across areas have been observed in the
national and intra-urban scales. Spatial heterogeneity in population features, such as age,
underlying health, household densities, partial lack of sanitation, socio-economic status,
contact networks and, mobility patterns (Yang et al., 2020) have emerged as potential
propellants of the spatiotemporal spread of the disease.
         Since the beginning of the pandemic, mapping the disease occurrence and spread has
become a powerful tool to track and support measures to slow down the infection
transmission (Kamel Boulos and Geraghty, 2020) around the world and at the local scale.
Web-based Geographical Information Systems (GIS) have allowed near real-time monitoring
using map-centric dashboards (Early Alert, 2020; Johns Hopkins University, 2020; World
Health Organization, 2020). Despite advances in the use of technology to reduce the impact
of the pandemic, little is known about the spatiotemporal patterns of mortality from COVID-
19, especially in an intra-urban setting. Studying the spatiotemporal dynamic of deaths
instead of cases may help better evaluate inequity. All the health disadvantages accumulated
over decades of life due to any kind of deprivation increases the risk of dying from COVID-
19. The lack of a robust spatiotemporal analysis undermines the comprehension of the
mitigation strategies to potentialize the disease-control efforts. Thus, this study aims to unveil
the spatiotemporal dynamic of COVID-19 mortality at a fine granular level in the city of São
Paulo considering the socio-economic context of the population. This approach may shed
light on the urgent need for solid evidence on health inequities during the COVID-19 outbreak.

2. Materials and Methods

2.1 Study Area and Data Acquisition

       This ecological study, based on COVID-19 secondary mortality data, was delineated
in the city of São Paulo, state of São Paulo, Brazil (Figure 1), where live an estimated
population of 11,869,660 inhabitants whose distribution over the area produces a mean
demographic density of 7,803 inhabitants/km², in 2020 (Fundação SEADE, 2020).
       When using COVID-19 data, underreporting is always an issue that deserves attention,
even for mortality. To minimize the effect of possible sub notification in deaths, we analyzed
confirmed and suspected deaths from COVID-19. Thus, death data comprised confirmed and
suspected deaths occurred between March 15 and June 13, 2020, extracted on June 18 from
the Mortality Information System (SIM), Mortality Information Improvement Program (PRO-
AIM) from the Epidemiology and Information Coordination (CEInfo) of the São Paulo Health
Secretariat (SMS-SP). Confirmed deaths due to coronavirus infection corresponded to the
code B34.2 (coronavirus infection disease), according to the International Classification of
Diseases Tenth Revision (ICD-10). Suspected deaths are coded as U04.9 (severe acute
respiratory syndrome).
       The places of residence of the COVID-19 deaths were geocoded by CEInfo/SMS-SP
according to the residence place using its databases and Google Maps API geocoding script
that uses public places as the base map. Resulting geocoded addresses were validated
comparing the road or ZIP code where the record was allocated with the original ZIP code.
Geocoded data were assigned to the 310 sample areas of the Brazilian Institute of Geography
and Statistics (IBGE), for which demographic and socio-economic census data are available
(IBGE, 2010). We considered these areas as the spatial units in our models (Figure 1).
       The records, including the basic cause, age, sex, the date of the death according to
the epidemiological week (EW) (Brasil. Ministério da Saúde, 2020b) and the sample areas of
residence were obtained by formal request to the São Paulo Electronic Information System
(e-SIC, protocol 48567), whose data information is hosted in an open session, on the
municipality's transparency portal for public access (São Paulo. Prefeitura, 2020). Here, we
named this information as e-SIC database. It was not necessary to submit this study to an
Ethics Committee because we did not have access to the names and addresses. Thus, the
use of secondary data, without personal identification and in the public domain, dispenses
with the need for prior approval by the Ethics Committee on Research with Human Beings as
per Resolution No. 510/2016, of the National Health Council (Guerriero, 2016).
       We also used the data available in Tabnet-DataSUS and named this information as
Tabnet         database.        Tabnet         is       an        app,        available       in
, provided by the
Municipal Health Department of São Paulo and developed by DataSUS. This app provides
free access (to any user) to population databases and to the database information systems
of SUS, such as the Mortality Information System (SIM), which is supplied by the Secretariat's
Program (PRO-AIM). Through the Tabnet app, it is possible to perform tabulation and
crossing several variables of interest such as epidemiological week, sex, age group, and
specific cause. The databases are updated periodically.
       As a measure of the socio-economic context of the population, since individual-level
data are not available in the mortality database, we used a socio-economic index especially
elaborated for health research. The GeoSES index (Barrozo et al., 2020) was developed
using Principal Component Analysis, starting with 41 variables. The index conceives the
socio-economic context preserving seven dimensions based on the theoretical background
(Duncan et al., 2002; Krieger et al., 1997): education, mobility, poverty, wealth, income,
segregation, and deprivation of resources and services. The index was defined in three
scales: national, Federative Unit and, intra-municipal. Figure 1 presents GeoSES for the
sample areas of the city of São Paulo, showing that the areas with the best socio-economic
conditions (GeoSES equal to or close to 1) are located in the central part of the city and that
these conditions deteriorate towards the periphery, where they reach the worst levels
(GeoSES equal to or close to -1). It has been shown to be useful in studies of mortality from
avoidable causes of deaths (from 5 to 74 years old) due to interventions at the Brazilian health
system in the national scale and, mortality from circulatory system diseases in the city of São
Paulo (Barrozo et al., 2020).
2.2 Data Analysis
We used the information of confirmed (B34.2) and suspected (U04.9) death from
COVID-19 available for the entire city of São Paulo from EW 11th to 29th of Tabnet database
to calculate the weekly mortality rates of confirmed (B34.2), suspected (U04.9) and total
(B34.2 + U04.9) COVID-19 deaths. We did the same using the e-SIC database from EW 11th
to 24th. We exclude from the information e-SIC database the COVID-19 deaths occurred on
25th because the data from this week was incomplete (it was extracted on 18th June 2020
and included only part of EW 25th). These rates were obtained dividing the respective
numbers of deaths in each week by the total population of the city and presented as death
per 100,000 inhabitants-week. In the sequence, we obtained the mortality rates for confirmed,
suspected, and total COVID-19 deaths by sex and age for the entire period from EW 11th to
24th using Tabnet and e-SIC databases. These comparisons between the data of these two
sources were useful to evaluate how complete was the data we used for the spatial and
spatiotemporal analysis. For the calculation of the mortality rates by sex and age, we excluded
the data without this information.
As only one suspected COVID-19 death occurred in EW 11th, we restricted our spatial
and spatiotemporal analysis from EW 12th to 24th and spatial or spatiotemporal architecture
was considered in all the models we performed. We first modelled the confirmed and total
COVID-19 deaths using spatiotemporal models only with the intercept and random effects
accounting for spatial and temporal autocorrelation and the interaction between them. The
spatial dependence was modelled considering a Besag-York-Mollié (BYM) model with two
components representing the spatially structured and non-structured random effects
(Blangiardo et al., 2013; Blangiardo and Cameletti, 2015). These two components were
considered independent one for another and followed the parametrization proposed by
Simpson et al. (2017). The temporal dependence was modelled by a non-structured random
effect and a structured random effect given by a random walk autoregressive model of first-
order (RW1). The interaction between space and time was modelled considering spatial and
temporal non-structured random effects (Blangiardo and Cameletti, 2015).
The number of confirmed and total COVID-19 deaths by EW and sample areas were
modelled using Poisson and zero-inflated Poisson probability distributions in a latent
Gaussian Bayesian model approach. We considered the expected confirmed and total
COVID-19 death for each EW and spatial unit as an off-set in these models. The expected
deaths were estimated by indirect standardization taking into account the age and sex
structure of each sample area and the mortality rates for the entire study period and city. This,
therefore, enables us to interpret the outcomes of our analysis as relative risks (RR)
concerning the mortality rates for the entire period and city. We obtained, from these models,
the temporal and spatiotemporal RR. Subsequently, we introduced the socio-economic
covariate (GeoSES) in these models and obtained the corresponding RR.
Finally, we used a spatial approach to model the confirmed and total COVID-19 death
by EW to evaluate the role of the socio-economic covariate in each one of the EW. For doing
this, we considered spatial models with intercept, BYM spatial random effects, and the
GeoSES as a covariate. The expected COVID-19 deaths were obtained in a similar way forthe spatiotemporal models, but considering the entire city mortality rates for each EW,
allowing us to interpret the RR concerning the entire city mortality rates for each EW.
We did our models in a Bayesian context using the integrated nested Laplace
approximation (INLA) approach (Rue et al., 2009). We selected our best models using the
Deviance Information Criterion (DIC) so that the best-adjusted models were those with lower
DIC values (Blangiardo and Cameletti, 2015). We used non-informative priors for the fixed
effects and priors with penalized complexity for the precision parameters of the random
effects (Simpson et al., 2017). We ran our models in the R environment (R Core Team, 2019).
3. Results
We found 14,753 confirmed and suspected COVID-19 deaths in the Tabnet database,
from EW 11th to 29th, and 10,760 in the e-SIC database, from EW 11th to 25th, in the city of
São Paulo. We removed 67 deaths from the e-SIC database because they were referent to
the EW 25th which was not completed when the data were extracted. Figure 2 shows the
mortality rates for COVID-19 for both sources of data, considering the confirmed, suspected
and total deaths. The curves from the e-SIC database are similar to the curves with data from
the Tabnet database and the differences among these curves in EW 23 th and 24th are related
to a delay in the notification of the COVID-19 deaths.
Table 1 shows the numbers and mortality rates of confirmed, suspected, and total
COVID-19 deaths obtained from e-SIC and Tabnet databases from EW 11th to 24th by sex
and age. To build Table 1, we excluded six deaths with ignored age and three deaths with
ignored sex from the 10,693 (10,760 – 67) death in the e-SIC database and we excluded six
ignored age and four deaths with ignored sex from the 11,098 deaths in the Tabnet database.
We can observe that mortality was higher for males and that it increases as age increases,
corresponding to 460.9 deaths per 100,000 inhabitants (in fourteen weeks) for people aged
60 years or older. This pattern of increased mortality as age increases is also observed when
making a greater stratification among people aged or older, as shown in supplementary
material 1.
Table 1 shows that the data we used to build our spatial and spatial models (e-SIC
database) is close to the municipality's official data on the pandemic (Tabnet-DataSUS). For
doing these models we excluded, from the e-SIC database, a suspected COVID-19 death
occurred on EW 11th (the first one in the city) and nine with ignored sex or age and 68 whose
addresses were not geocodified and did not have the sample area codes. We achieved a
high geocoding success rate of 99.3%, once 10,619 records were geocoded using address
data out of a total of 10,692 (excluding the first death in EW 11th). Of these, 5,837 refer to ICD
B34.2 (99.4% of the initial total of 5,875 records) and 4,782 to ICD U04.9 (99.2% of the total
of 4,817 records).
During this period, 30.6 and 17.4% of the sample areas had zero confirmed and total
COVID-19 deaths and, therefore. The DIC values of the spatiotemporal models with Poisson
probability distribution were lower than the value of zero-inflated Poisson distribution
(Supplementary material 2). Considering each week separately, the amount of zeros deaths
in the sample areas varied from 6.1 to 85.5%. The DIC values for the spatial models with
Poisson probability distribution were, in most cases, lower than the values with zero-inflated
Poisson distribution, and, in the cases that this did not occur, they are very close to each other(Supplementary material 3). From these results, we considered the best-adjusted spatial and
spatiotemporal models that ones with the Poisson distribution.
First, we present the results of the models with spatiotemporal architecture only with
intercept. We have, in Figure 3, the temporal RR from EW 12th to 24th, where we can see that
maximum RR occurred on EW 20th for the total COVID-19 deaths and in EW 23 for the
confirmed ones in our study period. These results, even adjusted for the temporal
autocorrelation, are similar to those presented in Figure 2. Considering the data presented in
Figures 2 and 3, the apparent pattern of the temporal curves shows a tendency to stabilize,
but a new rise in mortality cannot be ruled out soon.
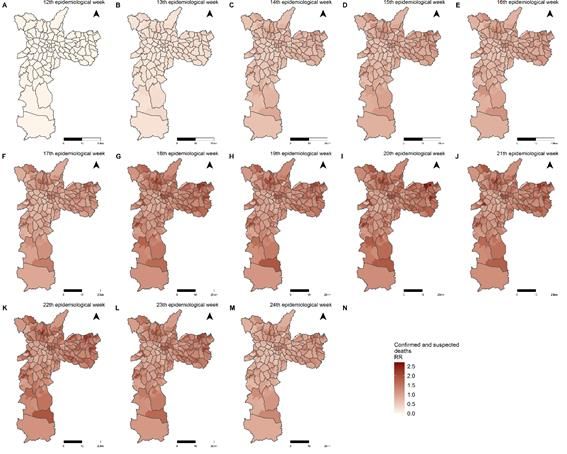
Figures 4 and 5 show the posterior means of the spatiotemporal RR for the sample
areas and EW, respectively, for confirmed and total COVID-19 deaths. Apart from the fact
that the RR is greater for the total deaths than the confirmed ones, the distribution of the RR
is similar between them, following the behaviour of the temporal RR. In the first two EW, the
sample areas presented lower values of RR that increased over time. However, this increase
occurred with greater intensity in the peripheral areas.
Next, we performed the spatiotemporal models, now taking into account the socio-
economic variable (GeoSES). Table 2 shows the spatiotemporal RR and the 95% credibility
intervals for GeoSES obtained for the models with confirmed and total COVID-19 deaths. In
both models, it is noted that the high socio-economic level was shown to protect against the
risk of dying from COVID-19 throughout the study period. Thus, the increase of one unit in
the socioeconomic indicator represented a 25% reduction in the risk of dying from COVID-
19, for the model using confirmed deaths, and a 33% reduction in the risk of dying, for the
model using COVID- 19 total deaths. Moreover, the risk of dying from COVID-19 in the sample
areas with the best socio-economic conditions (GeoSES close to 1), about the areas with the
worst ones (GeoSES close to -1) was 50% lower for the model with confirmed deaths and
66% lower for the model with the total deaths.
Finally, we performed the spatial modelling of confirmed and total COVID-19 deaths in
the EW separately, taking into account the socio-economic covariate. Figure 6 shows RR and
95% credibility intervals for GeoSES, according to the confirmed and total COVID-19 deaths
for each one of the EW. We identified a shift in the pattern of the relationship between COVID-
19 mortality and socio-economic status over time. The best socio-economic level presented
itself as a risk factor for COVID-19 deaths in the first two EW in the city of São Paulo. From
EW 15th, for the total death, and from EW 16th, for confirmed and total death, the worst socio-
economic level became a risk factor. Even if some values were not significant, there was a
continuous decrease in RR from EW 12th to 17th, followed by stabilization.
4. Discussion
This is the first population-based study on the evolution of the spatiotemporal pattern
of mortality from COVID-19 in the intra-urban setting of the largest city of Brazil. Using two
different datasets, analyzing confirmed and confirmed + suspected deaths separately allows
evaluating how uncertainty would impact the association between RR and the socio-
economic context. The robust models by EW clearly show when the high risk of death shifted
from the best to the worst socio-economic conditions in the city.
Our findings showed that the most critical period regarding mortality by COVID-19 in
the city of Sao Paulo occurred between EW 20th and 23th, followed by an apparentstabilization of the temporal trend. However, it is not possible to predict a future scenario, as
social distancing measures have been relaxed in the city since the 25th week (MS, 2020) this
could increase the number of infected people and, consequently, the number of deaths. Albeit
social distancing alone seems not to be enough to contain COVID-19, many studies
frequently concluded that it is a critical component of outbreak control (Nussbaumer-Streit et
al., 2020). It is important to point out that both total deaths and only confirmed deaths showed
similar patterns in our study, despite its differences. The suspected deaths need, for the one
hand, to be treated with caution, because they may be not COVID-19 and, for the other hand,
to consider them is one of the strengths of the study. First of all, there is a delay in the
confirmation of the suspected cases, consequently part of the suspected deaths will be
confirmed as COVID-19 deaths in the future. Furthermore, part of them would be confirmed,
if there were no difficulties related to the strict case definition, which requires testing often not
available or not performed in the appropriate time window. From this point of view, the
amplitudes of variation in rates and relative risks obtained from confirmed and total deaths
could be considered as lower and upper limits (or vice versa) for the magnitudes of these
measures.
The elderly population represents one of the groups that are more prone to the infection
and symptomatology by COVID-19 in the city of Sao Paulo, with a higher risk of death for
men after the seventh decade of life, similar to statistics found for China and the United States
(CDC. The Novel Coronavirus Pneumonia Emergency Response Epidemiology Team, 2020).
Recently Souza et al (2020) analyzed the Brazilian population and also found that most
COVID-19 deaths were male, and the most frequent comorbidities were cardiovascular
disease and diabetes. Behavioural elements, especially posture that may prejudice
adherence to lockdown measures, have been demonstrated as potentially crucial in
determining susceptibility to SARS-CoV-2 (Pawlowski et al., 2008; Raisi-Estabragh et al.,
2020). This unequal death ratio in men may be interpreted considering a lot of factors: their
comparatively higher presence of comorbidities (i.e., hypertension, diabetes, cardiovascular
disease, and chronic lung disease) (Sharma et al., 2020), higher risk behaviours (i.e., smoking
and alcohol use), occupational exposure (Global Health 5050, 2020) and, sex differences in
immune responses (Klein and Flanagan, 2016). In contrast, there may be other social and
behavioural characteristics that favour women, with previous studies proposing women are
more likely than men to adopt hand hygiene practices (Johnson et al., 2003) and seek
preventive care (Bertakis et al., 2000).
The spatial distribution of suspected and confirmed deaths by COVID-19 in the city of
Sao Paulo shows inequalities, with spatial dependence and positive correlation associated
with socio-economic factors of the areas, remarkably similar to the results of Maciel et al.
(2020). Our findings reveal that socio-economic status acts as a protective factor against the
risk of dying from COVID-19. In the models with only confirmed deaths and with all deaths,
the increase of one unit in the socio-economic indicator represented, respectively, a 25% and
33% decrease in the risk of dying. The first observation is that, when considering all deaths,
the protective effect of the socio-economic level is more evident, showing that there must be
a higher incidence of suspected deaths in the less-favoured areas concerning the most
favoured areas (in areas with better socio-economic level, access to confirmation for COVID-
19 probably is more available). A study conducted by Souza et al. (2020) reinforces this
finding. They compared the spatial pattern of confirmed cases of COVID-19 and severe acute
respiratory infection with unknown aetiology with the socio-economic level in the metropolitanregion of São Paulo and found that the firsts were more associated with better levels and the
seconds. They pointed out the degree of underreporting of COVID-19 cases should increase
with a decrease in socio-economic status. Therewith, our results have confirmed the
association between COVID-19 and human development, pointing to the importance of
geographic screening in locations with a potential for local infectious transmission as a
fundamental aspect to coordinate better actions against the pandemic (Maciel et al., 2020).
The low levels of socio-economic position reveal that not only the vulnerability of the
population but also the difficulties in health services concerning diagnosis and treatment of
the condition, similar to the overview of fragility expected from health services in Brazil (Ribas
et al., 2020) and in the countries of Latin America to face the pandemic (Rodriguez-Morales
et al., 2020). Besides, living conditions also may be strongly influenced by the low income in
different ways, such as residence in more poor neighbourhoods and housing conditions,
particularly confined or overcrowded housing (Khalatbari-Soltani et al., 2020), which has been
related with a greater risk of contagion from several other pathogens, such as Helicobacter
pylori (Webb et al., 1994), tuberculosis (Gupta et al., 2004) or Epstein–Barr virus (Gares et
al., 2017). Besides, a person’s employment may expose them to different risks related to the
type of job (Khalatbari-Soltani et al., 2020). Work requiring continuous human contact, such
as caring for people or interaction with others means that risk of infection dissemination
through droplets of aerosol is higher (Rule et al., 2018). Regarding COVID-19, studies
showed that occupation is an explicit determinant of contagion and a secondary determinant
of COVID-19 severity and deaths by the association between occupational social class and
comorbidities (Khalatbari-Soltani et al., 2020). For example, workers such as cleaners, retail
staff, teachers, or healthcare workers suffer the direct impact of the COVID-19 incidence
(Koh, 2020). People with underprivileged socio-economic conditions are more prone to be
exposed to job stress including burnout syndrome and unemployment, which may contribute
to disrupted immune and inflammatory system responses (Berger et al., 2019; Nakata, 2012)
as well as a higher risk for comorbidities for COVID-19 (Kivimäki and Kawachi, 2015). Until
now, both debilitated immunity and the existence of comorbidities are recognized risk factors
of COVID-19 severity (Khalatbari-Soltani et al., 2020).
We showed that the first cases of deaths occurred in the neighbourhoods with the best
socio-economic position in the city of Sao Paulo. This may be related to the fact that all of the
infected subjects had been abroad (MS, 2020). In the first two weeks, the best socio-
economic level was presented as a risk factor. Then there was a change in the spatial pattern:
from the fourth week onwards, the worst socio-economic level becomes a risk factor.
Similarly, Souza et al. (2020) showed a higher risk of diagnosed COVID-19 cases in census
tracts with higher per-capita income in the Sao Paulo metropolitan region during the early
phase of the COVID-19 epidemic. After these first cases in richer areas, the virus started to
circulate in the suburbs of the city, with high population density and worsened sanitary
conditions (Silva and Muniz, 2020), and probably explain its fast transmission. The city of Sao
Paulo is particularly vulnerable because it is the most populous in the country, with
approximately 12 million inhabitants (IBGE, 2020), and is highly connected within Brazil and
around the world. Its main airport, the São Paulo-Guarulhos International Airport, is the largest
in Brazil, with non-stop passenger flights to 103 destinations in 30 countries (Rodriguez-
Morales et al., 2020).
In this study, we used the SIM database instead of SIVEP-Gripe, unlike other studies
(Souza et al., 2020). The recommendation of the Ministry of Health to register the notificationof death and the monitoring of mortality from this system, in practice, leads to a longer time
between the event and the use of information by the teams since the registration of death
occurs initially in the SIM, based on the death certificate and requires health service teams
and/or COVISA, who access the systems, to insert the evolution for each notified case or the
notification of death for cases not previously notified. These characteristics, combined with
the coping strategy adopted by SMS-SP, which did not include mass testing, motivated the
option of using SIM data considering the confirmed and suspected diagnoses for analyzing
mortality caused by coronavirus infection in the analyzes performed.
Our study findings must be considered in the context of several assumptions and data
limitations. We associate patient’s addresses or postcodes to area-based socio-economic
positions using the geolocalisation, which may provide some insight into the likelihood of
exposure to health factors and COVID-19 risks. This approach is frequently used as
representative for the individual socio-economic condition; nevertheless, they are not a
perfect picture of individual circumstances, could underestimate the magnitude of social
disproportion related to individual social measures (Lamy et al., 2019) and are best employed
in complement with individual-level variables to reflect geographical or aggregate-level risks
(Khalatbari-Soltani et al., 2020). We highlight that our spatial analysis is subject to
methodological limitations caused by ecological fallacy and the modifiable areal unit problem.
These constraints are intrinsic to any spatial analysis using aggregated data (Subramanian
et al., 2009). Even so, our study contributes to healthcare planning measures and for future
precision studies focusing on the effects of social health factors on COVID-19 deaths. Also,
one of the strengths of our study was dealing with deaths by COVID-19 instead of using the
cases, due to the better accuracy and reliability of the data. When we consider only the cases,
there may be many underreporting asymptomatic patients that can hamper the conclusions.
5. Conclusions
We used models with spatial and spatio-temporal architectures to investigate the
spatial and spatio-temporal patterns of confirmed and total (confirmed and suspected)
COVID-19 deaths in the city of São Paulo. The obtained results from considering both
categories showed differences regarding the magnitude of rates and RR, however, there were
no differences concerning the conclusions we achieved. The maximum risk of dying from
COVID-19 occurred between EW 20th and 23th, followed by an apparent stabilization of the
temporal trend, but we did not rule out a new rise in mortality soon. We identified that the high
socio-economic level was shown to protect against the risk of dying from COVID-19
throughout the study period. However, this was not a uniform pattern, since we identified a
shift in the risk of dying from COVID-19 in the city of São Paulo over time: from high risk in
the best socio-economic contexts in the first two EW to high risk in the worst contexts, from
EW 16th ahead. Concerning sex and age, men and elderly people presented the highest risk
from dying of COVID-19. Our study has corroborated the relationship between COVID-19
mortality and socio-economic condition, revealing the importance of geographic screening in
areas with a higher risk for deaths as a crucial aspect to integrate better actions to face the
pandemic.Funding
This work was supported by the Conselho Nacional de Desenvolvimento Científico e
Tecnológico [grant numbers 301550/2017-4 to LVB and 306025/2019-1 to FCN]; and the São
Paulo Research Foundation (FAPESP) [grant number 2017/10297-1 to CL].
Figures and Tables
Table 1. Number and mortality rates (per 100,000 inhabitants in fourteen weeks) of suspected
(U04.9), confirmed (B34.2), and total (U04.9 + B34.2) COVID-19 deaths, according to e-SIC
and Tabnet databases, sex, and age. City of São Paulo, 11th to 24th epidemiological weeks,
2020. Data source: Deaths: Sistema de Informações sobre Mortalidade – SIM/PRO-AIM –
CEInfo –SMS-SP. Population: Fundação SEADE. Tabnet database was updated on
7/23/2020 and e-SIC database was provided on 6/08/2020.
e-SIC database Tabnet database Ratio:
(provided on 6/18/2020) (updated on Tabnet
7/23/2020) database / e-SIC
database
Nº of Mortality rate Nº of Mortality rate
deaths (per 100,000 deaths (per
inhab.) 100,000
inhab.)
Male sex
Confirmed 3350 59.3 3861 68.3 1.2
Suspect 2507 44.4 2228 39.4 0.9
Total 5857 103.6 6089 107.7 1.0
Female sex
Confirmed 2524 40.6 2906 46.7 1.2
Suspect 2309 37.1 2099 33.8 0.9
Total 4833 77.7 5005 80.5 1.0Total
Confirmed 5875 49.5 6768 57.0 1.2
Suspect 4818 40.6 4330 36.5 0.9
Total 10693 90.1 11098 93.5 1.0
Total: 0 to 19 years old
Confirmed 17 0.6 20 0.7 1.2
Suspect 41 1.4 41 1.4 1.0
Total 58 1.9 61 2.0 1.1
Total: 20 to 39 years old
Confirmed 236 6.2 284 7.5 1.2
Suspect 208 5.5 172 4.5 0.8
Total 444 11.7 456 12.0 1.0
Total: 40 to 59 years old
Confirmed 1145 35.5 1324 41.1 1.2
Suspect 825 25.6 706 21.9 0.9
Total 1970 61.2 2030 63.0 1.0
Total: 60 years old or older
Confirmed 4475 241.5 5140 277.3 1.1
Suspect 3739 201.7 3405 183.7 0.9Total 8214 443.2 8545 461.1 1.0
Table 2. Posterior means of the relative risks (RR) and 95% credibility intervals for the socio-
economic covariate (GeoSES) obtained with the spatiotemporal models for confirmed and
total COVID-19 deaths. City of São Paulo, 12th to 24th Epidemiology Weeks, 2020.
COVID-19 Covariate RR posterior 95% credible interval
deaths means
0.025 quantil 0.975 quantil
Confirmed Intercept 0.82 0.78 0.85
GeoSES 0.75 0.69 0.82
Total Intercept 0.74 0.71 0.77
GeoSES 0.67 0.62 0.72
Figure 1. a) South America, Brazil, State of São Paulo, city of São Paulo. b) Distribution of
socio-economic Index of the Geographic Context for Health Studies (GeoSES) according to
the sample area and delimited by administrative districts (DA), city of São Paulo, 2010.Figure 2. Distribution of mortality rates (per 100,000 inhabitants-week) of suspected (U04.9), confirmed (B34.2), and total (U04.9 + B34.2) COVID-19 deaths, according to e-SIC and Tabnet databases and epidemiological week. City of São Paulo, 2020. Data source: Deaths: Sistema de Informações sobre Mortalidade – SIM/PRO-AIM – CEInfo –SMS-SP. Population: Fundação SEADE. Tabnet database was updated on 7/23/2020 and e-SIC database was provided on 6/08/2020. Figure 3. Posterior means of the temporal relative risks (RR) of COVID 19. City of São Paulo, 12th to 24th Epidemiological Week, 2020.
Figure 4. Posterior means of the spatiotemporal relative risks (RR) for confirmed COVID-19
deaths. Sample areas of the city of São Paulo, 12th to 24th Epidemiological Week, 2020.

Figure 5. Posterior means of the spatiotemporal relative risks (RR) for total COVID-19 deaths
by sample areas of the city of São Paulo, 12th to 24th Epidemiological Week, 2020.
Figure 6. Posterior means of the relative risks and 95% credible interval for the socio-
economic covariate obtained with spatial models for confirmed and total COVID-19 deaths,
according to each one of the epidemiologic weeks. City of São Paulo, 12th to 24th
Epidemiology Week, 2020.

References

Barrozo, L.V., Fornaciali, M., André, C.D.S., Morais, G.A.Z., Mansur, G., Cabral-Miranda,
    W., Miranda, M.J., Sato, J.R., Amaro Jr., E., 2020. GeoSES: A socioeconomic index for
    health and social research in Brazil. PLoS One 15, e0232074.
    https://doi.org/10.1371/journal.pone.0232074

Berger, E., Castagné, R., Chadeau-Hyam, M., Bochud, M., D’Errico, A., Gandini, M., Karimi,
    M., Kivimäki, M., Krogh, V., Marmot, M., Panico, S., Preisig, M., Ricceri, F., Sacerdote,
    C., Steptoe, A., Stringhini, S., Tumino, R., Vineis, P., Delpierre, C., Kelly-Irving, M.,
    2019. Multi-cohort study identifies social determinants of systemic inflammation over
    the life course. Nat. Commun. 10, 773. https://doi.org/10.1038/s41467-019-08732-x

Bertakis, K.D., Azari, R., Helms, L.J., Callahan, E.J., Robbins, J.A., 2000. Gender
    differences in the utilization of health care services - PubMed [WWW Document]. J
    Fam Pr. URL https://pubmed.ncbi.nlm.nih.gov/10718692/ (accessed 8.3.20).

Blangiardo, M., Cameletti, M., 2015. Spatial and Spatio-temporal Bayesian Models with R-
    INLA. John Wiley & Sons, Ltd, Chichester, UK. https://doi.org/10.1002/9781118950203

Blangiardo, M., Cameletti, M., Baio, G., Rue, H., 2013. Spatial and spatio-temporal models
    with R-INLA. Spat. Spatiotemporal. Epidemiol. 4, 33–49.
    https://doi.org/10.1016/j.sste.2012.12.001

Brasil. Ministério da Saúde, 2020a. Painel coronavírus [WWW Document].

Brasil. Ministério da Saúde, 2020b. SINAN – Calendário Epidemiológico 2020 [WWW
Document]. URL https://portalsinan.saude.gov.br/calendario-epidemiologico-2020
(accessed 7.22.20).
CDC. The Novel Coronavirus Pneumonia Emergency Response Epidemiology Team, 2020.
Vital Surveillances: The Epidemiological Characteristics of an Outbreak of 2019 Novel
Coronavirus Diseases (COVID-19) [WWW Document]. URL
http://weekly.chinacdc.cn/en/
Duncan, G.J., Daly, M.C., McDonough, P., Williams, D.R., 2002. Optimal Indicators of
Socioeconomic Status for Health Research. Am. J. Public Health 92, 1151–1157.
Early Alert, 2020. Coronavirus 2020 (dashboard) [WWW Document]. URL
https://earlyalert.maps.arcgis.com/apps/opsdashboard/index.html#/20bfbf89c8e74c049
4c90b1ae0fa7b78 (accessed 7.24.20).
Fundação SEADE, 2020. População projetada [WWW Document]. URL
https://produtos.seade.gov.br/produtos/projpop
Gares, V., Panico, L., Castagne, R., Delpierre, C., Kelly-Irving, M., 2017. The role of the
early social environment on Epstein Barr virus infection: A prospective observational
design using the Millennium Cohort Study. Epidemiol. Infect. 145, 3405–3412.
https://doi.org/10.1017/S0950268817002515
Global Health 5050, 2020. COVID-19 Sex-Disaggregated Data Tracker [WWW Document].
URL http://globalhealth5050.org/covid19
Guerriero, I.C.Z., 2016. Resolução no 510 de 7 de abril de 2016 que trata das
especificidades éticas das pesquisas nas ciências humanas e sociais e de outras que
utilizam metodologias próprias dessas áreas. Cien. Saude Colet. 21, 2619–2629.
https://doi.org/10.1590/1413-81232015218.17212016
Gupta, D., Das, K., Balamughesh, T., Aggarwal, N., Jindal, S., 2004. Role of socio-
economic factors in tuberculosis prevalence. Indian J. Tuberc. 51, 27–31.
IBGE, 2020. Cidades e Estados [WWW Document]. URL https://www.ibge.gov.br/cidades-
e-estados/sp.html
Johns Hopkins University, C., 2020. Coronavirus COVID-19 Global Cases (dashboard)
[WWW Document]. URL
https://gisanddata.maps.arcgis.com/apps/opsdashboard/index.html#/bda7594740fd402
99423467b48e%0A9ecf6 (accessed 7.24.20).
Johnson, H.D., Sholcosky, D., Gabello, K., Ragni, R., Ogonosky, N., 2003. Sex Differences
in Public Restroom Handwashing Behavior Associated with Visual Behavior Prompts.
Percept. Mot. Skills 97, 805–810. https://doi.org/10.2466/pms.2003.97.3.805
Kamel Boulos, M.N., Geraghty, E.M., 2020. Geographical tracking and mapping of
coronavirus disease COVID-19/severe acute respiratory syndrome coronavirus 2
(SARS-CoV-2) epidemic and associated events around the world: how 21st century
GIS technologies are supporting the global fight against outbr. Int. J. Health Geogr. 19,
8. https://doi.org/10.1186/s12942-020-00202-8
Khalatbari-Soltani, S., Cumming, R.G., Delpierre, C., Kelly-Irving, M., 2020. Importance of
collecting data on socioeconomic determinants from the early stage of the COVID-19outbreak onwards. J. Epidemiol. Community Health jech-2020-214297.
https://doi.org/10.1136/jech-2020-214297
Kivimäki, M., Kawachi, I., 2015. Work Stress as a Risk Factor for Cardiovascular Disease.
Curr. Cardiol. Rep. 17, 74. https://doi.org/10.1007/s11886-015-0630-8
Klein, S.L., Flanagan, K.L., 2016. Sex differences in immune responses. Nat. Rev. Immunol.
16, 626–638. https://doi.org/10.1038/nri.2016.90
Koh, D., 2020. Occupational risks for COVID-19 infection. Occup. Med. (Chic. Ill). 70, 3–5.
https://doi.org/10.1093/occmed/kqaa036
Krieger, N., Williams, D.R., Moss, N.E., 1997. Measuring social class in US public health
research: concepts, methodologies, and guidelines. Annu Rev Public Heal. 18, 341–
378.
Lamy, S., Molinié, F., Daubisse-Marliac, L., Cowppli-Bony, A., Ayrault-Piault, S., Fournier,
E., Woronoff, A.-S., Delpierre, C., Grosclaude, P., 2019. Using ecological
socioeconomic position (SEP) measures to deal with sample bias introduced by
incomplete individual-level measures: inequalities in breast cancer stage at diagnosis
as an example. BMC Public Health 19, 857. https://doi.org/10.1186/s12889-019-7220-4
Maciel, J.A.C., Castro-Silva, I.I., Farias, M.R. de, 2020. Análise inicial da correlação
espacial entre a incidência de COVID-19 e o desenvolvimento humano nos municípios
do estado do Ceará no Brasil. Rev. Bras. Epidemiol. 23. https://doi.org/10.1590/1980-
549720200057
Maroko, A.R., Nash, D., Pavilonis, B.T., 2020. COVID-19 and Inequity: a Comparative
Spatial Analysis of New York City and Chicago Hot Spots. J. Urban Heal.
https://doi.org/10.1007/s11524-020-00468-0
Nakata, A., 2012. Psychosocial Job Stress and Immunity: A Systematic Review. pp. 39–75.
https://doi.org/10.1007/978-1-62703-071-7_3
Nussbaumer-Streit, B., Mayr, V., Dobrescu, A.I., Chapman, A., Persad, E., Klerings, I.,
Wagner, G., Siebert, U., Christof, C., Zachariah, C., Gartlehner, G., 2020. Quarantine
alone or in combination with other public health measures to control COVID-19: a rapid
review. Cochrane Database Syst. Rev. https://doi.org/10.1002/14651858.CD013574
Pawlowski, B., Atwal, R., Dunbar, R.I.M., 2008. Sex Differences in Everyday Risk-Taking
Behavior in Humans. Evol. Psychol. 6, 147470490800600.
https://doi.org/10.1177/147470490800600104
R Core Team, 2019. R: A Language and Environment for Statistical Computing.
Raisi-Estabragh, Z., McCracken, C., Ardissino, M., Bethell, M.S., Cooper, J., Cooper, C.,
Harvey, N.C., Petersen, S.E., 2020. Non-white ethnicity, male sex, and higher body
mass index, but not medications acting on the renin-angiotensin system are associated
with coronavirus disease 2019 (COVID-19) hospitalisation: review of the first 669 cases
from the UK biobank. medRxiv 2020.05.10.20096925.
https://doi.org/10.1101/2020.05.10.20096925
Ribas, R.M., Campos, P.A. de, Brito, C.S. de, Gontijo-Filho, P.P., 2020. Coronavirus
Disease 2019 (COVID-19) and healthcare-associated infections: Emerging and future
challenges for public health in Brazil. Travel Med. Infect. Dis. 101675.https://doi.org/10.1016/j.tmaid.2020.101675
Rodriguez-Morales, A.J., Gallego, V., Escalera-Antezana, J.P., Méndez, C.A., Zambrano,
L.I., Franco-Paredes, C., Suárez, J.A., Rodriguez-Enciso, H.D., Balbin-Ramon, G.J.,
Savio-Larriera, E., Risquez, A., Cimerman, S., 2020. COVID-19 in Latin America: The
implications of the first confirmed case in Brazil. Travel Med. Infect. Dis. 35, 101613.
https://doi.org/10.1016/j.tmaid.2020.101613
Rue, H., Martino, S., Chopin, N., 2009. Approximate Bayesian inference for latent Gaussian
models by using integrated nested Laplace approximations. J. R. Stat. Soc. B 71, 319–
392. https://doi.org/https://doi.org/10.1111/j.1467-9868
Rule, A.M., Apau, O., Ahrenholz, S.H., Brueck, S.E., Lindsley, W.G., de Perio, M.A., Noti,
J.D., Shaffer, R.E., Rothman, R., Grigorovitch, A., Noorbakhsh, B., Beezhold, D.H.,
Yorio, P.L., Perl, T.M., Fisher, E.M., 2018. Healthcare personnel exposure in an
emergency department during influenza season. PLoS One 13, e0203223.
https://doi.org/10.1371/journal.pone.0203223
Santos, N.R. dos, 2018. SUS 30 anos: o início, a caminhada e o rumo. Cien. Saude Colet.
23, 1729–1736. https://doi.org/10.1590/1413-81232018236.06092018
São Paulo. Prefeitura, 2020. Pedidos de informação protocolados à Prefeitura via sistema
e-SIC [WWW Document]. URL http://dados.prefeitura.sp.gov.br/dataset/pedidos-de-
informacao-protocolados-a-prefeitura-via-e-sic1
Sharma, G., Volgman, A.S., Michos, E.D., 2020. Sex Differences in Mortality From COVID-
19 Pandemic. JACC Case Reports 2, 1407–1410.
https://doi.org/10.1016/j.jaccas.2020.04.027
Silva, J.B. da, Muniz, A.M.V., 2020. Pandemia do Coronavírus no Brasil: Impactos no
Território Cearense. Espaço e Econ. https://doi.org/10.4000/espacoeconomia.10501
Simpson, D., Rue, H., Riebler, A., Martins, T.G., Sørbye, S.H., 2017. Penalising Model
Component Complexity: A Principled, Practical Approach to Constructing Priors. Stat.
Sci. 32, 1–28. https://doi.org/10.1214/16-STS576
Souza, W.M., Buss, L.F., Candido, D. da S., Carrera, J.-P., Li, S., Zarebski, A.E., Pereira,
R.H.M., Prete, C.A., de Souza-Santos, A.A., Parag, K. V., Belotti, M.C.T.D., Vincenti-
Gonzalez, M.F., Messina, J., da Silva Sales, F.C., Andrade, P. dos S., Nascimento,
V.H., Ghilardi, F., Abade, L., Gutierrez, B., Kraemer, M.U.G., Braga, C.K. V., Aguiar,
R.S., Alexander, N., Mayaud, P., Brady, O.J., Marcilio, I., Gouveia, N., Li, G., Tami, A.,
de Oliveira, S.B., Porto, V.B.G., Ganem, F., de Almeida, W.A.F., Fantinato, F.F.S.T.,
Macário, E.M., de Oliveira, W.K., Nogueira, M.L., Pybus, O.G., Wu, C.-H., Croda, J.,
Sabino, E.C., Faria, N.R., 2020. Epidemiological and clinical characteristics of the
COVID-19 epidemic in Brazil. Nat. Hum. Behav. https://doi.org/10.1038/s41562-020-
0928-4
Subramanian, S. V, Jones, K., Kaddour, A., Krieger, N., 2009. Revisiting Robinson: The
perils of individualistic and ecologic fallacy. Int. J. Epidemiol. 38, 342–360.
https://doi.org/10.1093/ije/dyn359
The World Bank, D.R.G., 2020. World Development Indicators. Washington, D.C.
Wang, Z., Tang, K., 2020. Combating COVID-19: health equity matters. Nat. Med. 26, 458–
458. https://doi.org/10.1038/s41591-020-0823-6Webb, P.M., Knight, T., Greaves, S., Wilson, A., Newell, D.G., Elder, J., Forman, D., 1994.
Relation between infection with Helicobacter pylori and living conditions in childhood:
evidence for person to person transmission in early life. BMJ 308, 750–753.
https://doi.org/10.1136/bmj.308.6931.750
World Health Organization, 2020. Novel coronavirus (COVID-19) situation (dashboard)
[WWW Document]. URL http://healthcybermap.org/WHO_COVID19/ (accessed
7.24.20).
Yang, H.M., Lombardi Junior, L.P., Castro, F.F.M., Yang, A.C., 2020. Mathematical model
describing CoViD-19 in São Paulo, Brazil – evaluating isolation as control mechanism
and forecasting epidemiological scenarios of release. Epidemiol. Infect. 148, e155.
https://doi.org/10.1017/S0950268820001600
Supplementary materials
Supplementary material 1. Number and mortality rates (per 100,000 inhabitants in fourteen-
weeks) of suspected (U04.9), confirmed (B34.2) and total (U04.9 + B34.2) COVID-19 deaths,
according to e-SIC and Tabnet databases and the age groups among people over 60 years
of age. City of São Paulo, 11th to 24th epidemiological weeks, 2020.
e-SIC database Tabnet database Ratio:
(provided on 6/18/2020) (updated on 7/23/2020) Tabnet-
DataSUS /
Database Provided
Nº of deaths Mortality Nº of deaths Mortality
rate rate
(pe (p
r 100,000 er
inhab.) 100,000
inhab.)
Total: 60 to 64 years old
Confirm 593 99.8 679 114.3 1.1
ed
Suspect 397 66.8 348 58.6 0.9
Total 990 166.6 1027 172.9 1.0Total: 65 to 69 years old
Confirm 667 142.4 776 165.6 1.2
ed
Suspect 499 106.5 437 93.3 0.9
Total 1176 251.0 1213 258.9 1.0
Total: 70 to 75 years old
Confirm 755 221.5 887 260.2 1.2
ed
Suspect 537 157.5 454 133.2 0.8
Total 1292 379.0 1341 393.4 1.0
Total:75 years old or older
Confirm 2450 544.7 2836 630.5 1.2
ed
Suspect 2306 512.7 2128 473.1 0.9
Total 4756 1057.4 4964 1103.6 1.0
Data source: Deaths: Sistema de Informações sobre Mortalidade – SIM/PRO-AIM – CEInfo
–SMS-SP. Population: Fundação SEADE. Tabnet database was update on 7/23/2020 and e-
SIC database was provided on 6/08/2020.
Supplementary material 2. DIC values of spatio-temporal models with Poisson and zero-
inflated Poisson probability distributions for confirmed and total COVID-19 deaths.Probability distribution
Considered Model type
deaths Poisson Zero inflated
Poisson
Confirmed Intercept 11880.2 11888.7
Intercept + covariate 11873.1 11887.5
Total Intercept 14352.9 14354.4
Intercept + covariate 14329.6 14334.1
Supplementary material 3. Percentages of sample areas with zero confirmed deaths and
zero total deaths by COVID-19 and their respective DIC values for the spatial models with
Poisson and zero-inflated Poisson probability distribution, according to epidemiological week
(EW)
EW Considered deaths % zeros Probability distribution and model type
Poisson Zero inflated Poisson
intercept covariate intercept covariate
12 confirmed 85.5 285.7 285.9 286.4 286.7
total 84.8 305.0 304.4 304.6 304.0
13 confirmed 54.5 684.1 677.4 683.1 677.4
total 49.7 730.0 726.4 729.2 726.9
14 confirmed 31.6 928.9 930.5 928.9 930.8
total 20.6 1079.4 1081.0 1079.1 1080.9
15 confirmed 29.7 951.2 952.7 950.9 952.1total 12.6 1162.6 1155.2 1162.9 1154.6
16 confirmed 25.8 932.1 930.2 932.5 930.4
total 11.3 1167.3 1164.5 1167.9 1165.3
17 confirmed 29.0 950.1 941.8 952.9 943.7
total 6.1 1214.2 1204.9 1215.8 1205.8
18 confirmed 22.6 1023.3 1019.5 1023.6 1019.6
total 5.8 1321.2 1310.4 1321.1 1309.4
19 confirmed 24.5 988.5 981.5 989.4 982.6
total 5.1 1306.6 1275.5 1307.9 1274.0
20 confirmed 18.7 1051.7 1035.5 1051.4 1035.4
total 4.2 1344.5 1289.1 1345.8 1288.5
21 confirmed 19.0 1073.5 1063.2 1073.5 1062.2
total 6.5 1328.1 1306.5 1331.2 1307.7
22 confirmed 16.1 1060.2 1052.8 1060.6 1054.3
total 3.5 1291.6 1267.6 1291.9 1268.4
23 confirmed 16.4 1080.1 1060.8 1077.9 1060.8
total 6.1 1284.1 1257.5 1282.7 1257.6
24 confirmed 23.8 1036.3 1028.5 1039.8 1028.8
total 10.0 1203.1 1187.1 1206.9 1187.4You can also read