SUBMISSION TO THE AUSTRALIAN ENERGY REGULATOR (AER) LOCAL GOVERNMENT RESPONSE TO THE VICTORIAN ELECTRICITY DISTRIBUTION PRICE REVIEW (EDPR) ...
←
→
Page content transcription
If your browser does not render page correctly, please read the page content below

SUBMISSION TO THE AUSTRALIAN
     ENERGY REGULATOR (AER)

LOCAL GOVERNMENT RESPONSE TO THE
 VICTORIAN ELECTRICITY DISTRIBUTION
     PRICE REVIEW (EDPR) 2021-26

     Prepared by the Victorian Greenhouse Alliances

                       May 2020

                                                      1
Prepared by the Victorian Greenhouse Alliances, the Public Lighting Group and their member
councils.

Primary authors and key contacts:

 Scott McKenry                                    Rob Law
 Executive Officer                                Executive Officer
 Eastern Alliance for Greenhouse Action (EAGA)    Central Victorian Greenhouse Alliance (CVGA)
 03 9298 4250                                     0467 692 827
 scott.mckenry@maroondah.vic.gov.au               eo@cvga.org.au

 Contributing authors:

 Paul Brown                                       Fran MacDonald
 Managing Director                                Executive Officer
 Ironbark Sustainability                          Western Alliance for Greenhouse Action (WAGA)
 1300 288 262                                     03 9249 4864
 paul@realaction.com.au                           FranM@brimbank.vic.gov.au

 David Meiklejohn                                 Bronwyn Chapman
 Executive Officer                                Executive Officer
 Northern Alliance for Greenhouse Action (NAGA)   Goulburn Broken Greenhouse Alliance (GBGA)
 0422 458 690                                     0402 912 303
 david@naga.org.au                                eo@gbga.com.au

 Dominique La Fontaine                            Faye Adams
 Executive Officer                                Public Lighting Group
 South East Councils Climate Change Alliance      Manningham City Council
 (SECCCA)                                         03 9840 9325
 0428 455 005                                     Faye.Adams@manningham.vic.gov.au
 dlafontaine@seccca.org.au

 Claire Dunn
 Manager Environment and Regulatory Services
 Municipal Association of Victoria (MAV)
 03 9667 5533
 cdunn@mav.asn.au

                                                                                             2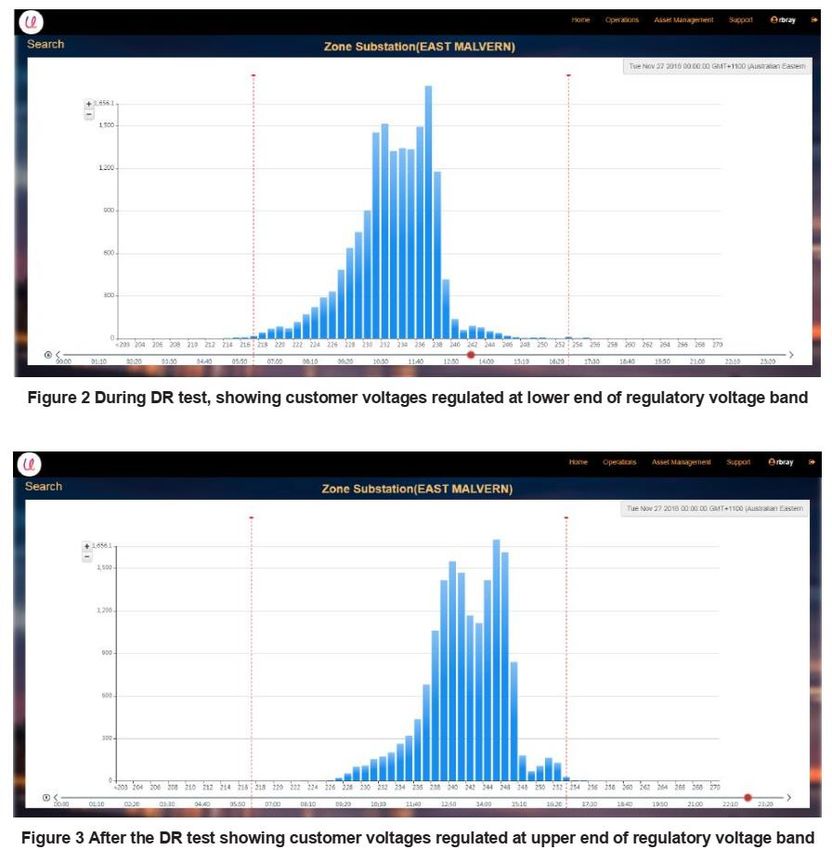
TABLE OF CONTENTS
EXECUTIVE SUMMARY ....................................................................................................................... 4
1.      INTRODUCTION .......................................................................................................................... 10
2.      PUBLIC LIGHTING ...................................................................................................................... 11
     2.1 DNSP Proposals – Key sector wide issues ............................................................................... 11
        2.1.1 Replacement of Failed Lights with LEDs ............................................................................ 11
        2.1.2 Smart Lighting ..................................................................................................................... 11
        2.1.3 Changes to the Victorian Public Lighting Code .................................................................. 12
     2.2 Detailed Public Lighting Cost Model Inputs ............................................................................... 14
        2.2.1 Inputs - All Lamps................................................................................................................ 15
        2.2.2 Pole Inspection Rate ........................................................................................................... 16
        2.2.3 Hours Per Day ..................................................................................................................... 17
        2.2.4 Repairs and Replacements ................................................................................................. 17
        2.2.5 LED Luminaire Prices.......................................................................................................... 18
        2.2.6 Include Jemena lighting within urban region ....................................................................... 20
        2.2.7 LED Fault Rates .................................................................................................................. 20
        2.2.8 AusNet Funded LED Replacement Program ...................................................................... 22
        2.2.9 Abolishing of Charges ......................................................................................................... 23
        2.2.10 Language in the Public Lighting Models ........................................................................... 23
3.      DEMAND MANAGEMENT ........................................................................................................... 24
     3.1 Broad base demand management expenditure ........................................................................ 24
     3.2 Demand management incentive scheme allowance expenditure ............................................. 25
     3.3 Voltage management ................................................................................................................. 26
4.      DISTRIBUTED ENERGY RESOURCE (DER) INTEGRATION .................................................. 30
     4.1 DER ‘enablement’ expenditure .................................................................................................. 30
     4.2 Support for improving visibility and coordination ....................................................................... 31
     4.3 Pricing DER integration and equity issues................................................................................. 31
     4.4 Benchmarking DER ‘value’ and expenditure ............................................................................. 32
     4.5 Electric vehicle uptake in forecasts............................................................................................ 32
5.      REGIONAL SUPPLY AND MICROGRIDS .................................................................................. 34
6.      VEGETATION MANAGEMENT ................................................................................................... 35
7.      CLIMATE RESILIENCE ............................................................................................................... 39
8.      STAKEHOLDER ENGAGEMENT ................................................................................................ 41
9.      GLOSSARY .................................................................................................................................. 43

                                                                                                                                                    3
EXECUTIVE SUMMARY

On behalf of their council members, the Victorian Greenhouse Alliances are pleased to make
this submission to the Australian Energy Regulator (AER) to the 2021-2026 Victorian Electricity
Distribution Price Review (EDPR).

This submission provides supporting evidence and rationale for a number of key
recommendations in the areas of public lighting, demand management, Distributed Energy
Resources (DER), regional supply, vegetation management, climate resilience and stakeholder
engagement.

Public lighting

Key issues influencing the efficient operations of the overall street lighting industry are:

•       Replacement of failed lights – LEDs are more efficient and require less maintenance than
        traditional lights, and should be standard assets built into all relevant cost models

•       Smart lighting – Smart photo-electric (PE) cells combined with a Smart Lighting Control
        Management System (CMS) can significantly reduce costs and energy consumption.
        DNSPs should fund the CMS and install smart PE cells when replacing failed Category V
        street lights

•       Victorian Public Lighting Code (the Code) – The Code is clearly out of date due to
        technology changes, which impacts operation and management of street lighting. Updating
        the Code is important, as it remains a key method by which the DNSPs and the AER test the
        assumptions within the DNSPs’ cost models.

Detailed analysis of the Distribution Network Service Providers’ (DNSP) cost models indicates
many other areas where best practice should be implemented. These recommended changes
have the potential to save customers more than $20m over the period.

    Recommendations:

    Replacement of failed lights with LEDs (See Section 2.2.1)

    •    All DNSPs should replace current streetlights with LEDs when assets fail. This should
         be built into all relevant cost models for this coming period

    •    Customers should determine the approach to bulk replacements to LEDs

    •    All old lights should be fully recycled

                                                                                                   4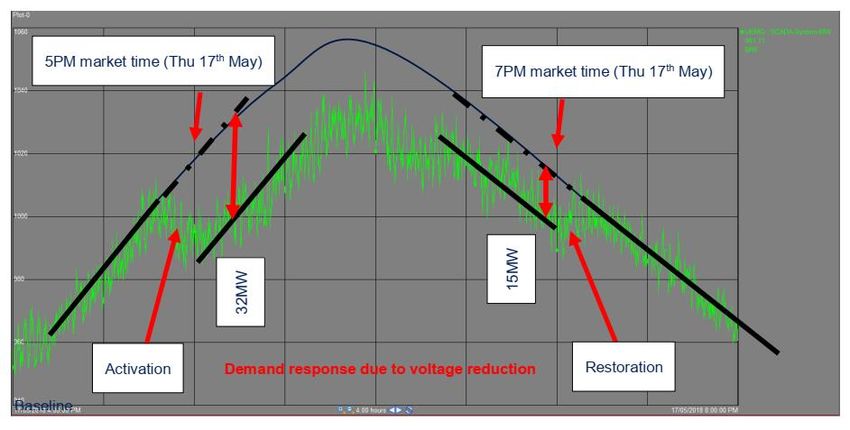
•   The proposed by AusNet to fund the replacement of 29,000 LEDs should be rejected,
     and that AusNet works closely with customers collectively to deliver a DNSP wide
     program that is defined and scoped by customers
 Smart Lighting (Section 2.1.2)

 •   DNSPs should be required to include the installation of smart photo-electric (PE) cells
     in their replacement programs for Category V street lighting

 •   DNSPs should be required to invest in a smart lighting Control Management System
     (CMS) to enable customers to effectively manage any smart lighting assets they install
 Changes to the Victorian Public Lighting Code (Section 2.1.3)

 •   The AER should request that a review of the Victorian Public Lighting Code be
     implemented by the Victorian Essential Services Commission (ESC) in time to influence
     (where relevant) the next Victorian EDPR
 Best practice cost model inputs (Section 2.2)

 •   Ensure all costs models utilise efficient pricing and assumptions. This covers items
     such as labour rates, elevated platform vehicles and patrol vehicles, pole inspection
     rates, repairs, replacement, hours per day, and LED luminaire failure rates and material
     pricing

Demand Management
Demand management is a flexible and relatively low-cost network solution compared to
traditional asset replacement or augmentation, delivering co-benefits including greenhouse gas
emissions reductions. However, just 0.46% of total network expenditure is allocated to reducing
demand.

With the exception of AusNet Services and United Energy, there is disappointing lack of
transparency around the total expenditure proposed by the businesses on broad based demand
management activities (i.e. business as usual opex, capex or augex). These two DNPSs have
also provided clear documentation for how they intend to use their Demand Management
Incentive Scheme (DMIS) allowance in the next period.

The current regulatory framework creates significant barriers to demand management and
facilitates a clear capex bias by the DNSPs. Government intervention is required to support or
stimulate innovation; specifically, authorisation of incentive allowances should be contingent on
DNSPs committing to a clear transition to a business-as-usual approach (i.e. funded through
OPEX/CAPEX/AUGEX), with transparent evidence-based funding proposals for councils, which
include co-benefits such as emissions reductions.

                                                                                                  5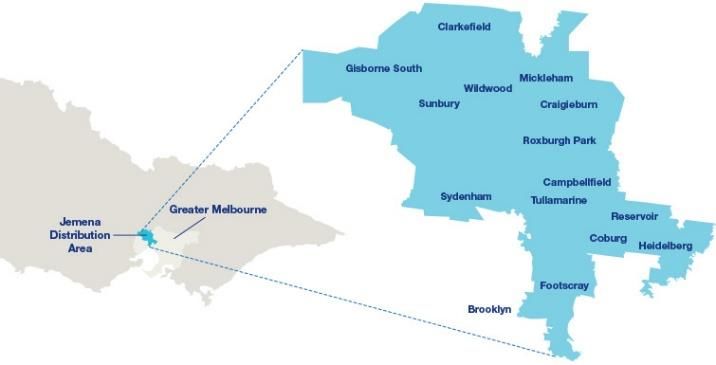
Recommendations:

 Broad base demand management expenditure (Section 3.1)

 •   That demand management activities and associated expenditure be afforded the same
     level of transparency as other forms of expenditure in all regulatory proposals in future

 •   Forecasted expenditure (OPEX/CAPEX/AUGEX) on broad based demand
     management initiatives and a description of each activity are included in the revised
     proposals for Jenema, CitiPower and PowerCor

 Demand management incentive scheme allowance (Section 3.2)

 •   The AER provides clear and strong incentives for the network business to undertake
     pilot and trial projects to fully assess the costs and benefits of new innovations (where a
     clear development pathway to ‘business as usual’ can be demonstrated)

 •   United Energy and AusNet Services be granted their full requested allowance under the
     DMIS scheme

 •   Jemena, CitiPower and PowerCor provide additional documentation in their revised
     proposals outlining the types of projects requiring funding through the DMIS

 Voltage management (Section 3.3)

 •   The AER require that all Victorian DNSPs commit to replicating the United Energy
     Dynamic Voltage Management System (DVMS) capability throughout the entire
     network

 •   Within the 2021-26 period (and as early as possible) the AER require the operation of
     the DVMS as a minimum operational requirement of the Victorian DNSPs aimed at
     reducing overall system real power, within the constraints of relevant Australian
     Standards

 •   That the costs to implement these recommendations be incorporated into the 2021-26
     pricing period

Distributed Energy Resources
In the absence of the finalised ‘Framework for Assessing DER Expenditure’, we acknowledge
that the DNSPs plan to enhance hosting capacity and enable exports of zero marginal cost DER
generation. This is urgently needed as DER penetration increases, due in large part to
government programs and plans for rapid transition to 100% renewable energy and zero net
emissions.

The DNSPs’ forecast pricing models take this increase into account, but other measures are
also necessary:
                                                                                                   6
• Pricing models should factor in the uncertainty of broader forecasts of DER uptake
• Enhancing smart metering capabilities would improve understanding of network constraints.
A separate process like a RIT-D may be required, as investments in IT infrastructure are
costly and should be transparent.
• Grid augmentation to support 100% solar export at all times is not economically efficient,
requiring unnecessary ‘gold-plating’. The DNSPs address this issue by only upgrading the
network where export benefits exceed augmentation costs, or when capital investment
removes ‘most’ rather than all constraints (based on percentage of time solar is constrained
at the substation). Whilst this is more mature than managing export limits on a 'first come,
first served' basis, equity issues for consumers remain.
• The diversity of the DNSPs’ assessment approaches reinforces the need for a common set
of benchmarks and metrics, developed in consultation with consumers.
• The proposals differ in how they address changes expected from uptake of electric vehicles
(EVs). United Energy’s (UE) submission is most realistic and thorough in how it assumes
EVs will impact the network and also in how it approaches augmentation. Recent studies
show that EV uptake will be significant over the 2021-2026 period and planning should be
underway now.
Recommendations:
• AER should accept the proposed DER enablement expenditure for all DNSPs
• Expenditure on IT infrastructure should be approved, where DNSPs have provided
transparency on the intended initiatives and the visibility and coordination benefits
• Support should be provided for DNSPs to invest in dynamic export and load
management technologies that can address emerging equity issues from increased
DER uptake
• Establish clear and consistent methodologies for assessing DER expenditure, using
metrics and benchmarks that are meaningful to consumers
• Accept United Energy’s forecast for future EV uptake and require other DNSPs to
revise their EV uptake models in line with United Energy in their revised proposals
Regional Supply and Microgrids
In Victoria’s regional towns, non-network options can provide cost-effective, efficient and
sustainable alternatives to grid expansion. Each DNSP is proposing different levels of
innovation with regard to upgrading supply and investigation of microgrids. A range of regulatory
changes have been proposed to enable distributors to supply customers with Standalone Power
Systems (SAPS) where it is cheaper than maintaining grid connection. However, all DNSPs
should be able to identify how they plan to identify and pursue microgrid opportunities over the
7coming pricing period. This should include transparency on how particular initiatives have been
prioritised over others, and how pilot programs may expand into other regions.
Recommendations:
• Require all DNSPs to provide more detail on how they will identify and pursue
microgrid/SAPS opportunities over the period
• Request Powercor to explain the process it undertook to identify the dairy farming
region in South West Victoria as a priority for network upgrades
Vegetation Management
There are clear challenges for councils and DNSPs to work more collaboratively on vegetation
management, mainly related to:
• Urban street trees are critical infrastructure and most councils are increasing plantings.
However, planning and maintenance regimes are not cheap ($300-800 per tree for a two-
year plan). DNSPs and councils need to work together to maximise the full benefits of
street trees, particularly to maintain mature trees in close proximity to power lines.
• DNSP pruning and inspection timeframes are relatively infrequent and often result in
excessive pruning and related problems. More frequent pruning regimes could protect the
broader value of the trees. Delineation could occur between areas of different voltages and
bushfire risks, and there could be more frequent annual pruning for significant mature
trees.
DNSPs are required to submit Vegetation Management Plans to Energy Safe Victoria, so some
of the issues in this section of our submission relate to the ESV processes. However, it is
important that the AER is aware of the issues and how vegetation management is assessed in
DNSP’s proposals.
Recommendations:
• DNSPs should be required to implement more frequent pruning cycles, with annual
cycles for urban / township areas and two-year pruning regime cycles for most other
scenarios (See Section 6)
• Recognition that greater collaboration should be sought between councils and network
DNSPs on vegetation management. This is particularly relevant where councils have
ambitious urban forest plans and canopy cover targets
• More frequent audits of contracted cutting crews to improve pruning to Australian
standards and to raise any issues as they arise
• Work with councils to aerial bundle cable on spans with identified high value trees
8Climate Resilience
Victoria is projected to experience hotter and drier conditions and more extreme weather
events, such as storms, flooding and bushfire, due to climate change. These trends will continue
to undermine the security and reliability of energy supply. DNSP pricing proposals are weak
when it comes to consideration of climate change impacts on operations and the need for
greater infrastructure resilience. The proposals should be assessed for how well they consider
climate change impacts and risks, both mitigation and adaptation, and whether the DNSPs are
actively seeking to reduce climate vulnerability through solutions such as microgrids and
undergrounding and bundling of cables in high bushfire risk areas.
Recommendations:
• Encourage DNSPs to consider how climate change will impact operations during this
period recognising that decisions made in this period extend into multiple decades (See
Section 7)
• Seek to build in infrastructure climate risk vulnerability assessments across a range of
network investment decisions
Stakeholder Engagement
Approaches to stakeholder engagement have matured significantly since the previous pricing
period. Councils have welcomed the more proactive steps taken by distributors to engage with
consumers on a range of key issues and initiatives, including, but not limited to:
• AusNet’s Customer Forum
• CitiPower, Powercor and United Energy’s Future Networks Forum
• United Energy’s Summer Savers program
• AusNet public lighting consultation
Recommendations:
• Replicate the Customer Forum process in future EDPRs, with careful consideration of
the skills and experience of nominated representatives and the scope of the negotiation
• The AER should support DNPSs to further develop their stakeholder engagement
capabilities, and report on and communicate best practice examples where appropriate
91. INTRODUCTION
On behalf of their council members, the Victorian Greenhouse Alliances are pleased to make
this submission to the Australian Energy Regulator (AER) to the 2021-2025 Victorian Electricity
Distribution Price Review (EDPR).
The Alliances are formal partnerships of councils driving climate change action across 78 of the
State’s 79 municipalities. The Alliances work across their networks, communities and partners
to deliver regional carbon mitigation and climate change adaptation programs. This work
includes the implementation of joint initiatives that provide economies of scale and enable
projects typically beyond the reach of individual councils. Our project work is complemented by
targeted advocacy, capacity building activities and regional partnerships. Read more here.
Critically, the existing governance structures and capabilities within the Alliance networks
facilitate a coordinated dialogue between local government and both state and federal
governments on key issues relevant to the energy sector. This was demonstrated in the
previous two pricing reset periods, where the Alliances coordinated a submission dealing with a
range of issues including costs relating to the operation, maintenance and replacement (OMR)
of public lighting. The outcomes of the past two submissions and determination processes were
successful in generating over $45m in savings for the local government sector over the previous
10 years.
102. PUBLIC LIGHTING
2.1 DNSP Proposals – Key sector wide issues
This section discusses some key issues that are influencing the efficient operations of the
overall street lighting industry. These items are:
• Replacement of failed lights with LEDs
• Smart Lighting
• Updates to the Victorian Public Lighting Code
2.1.1 Replacement of Failed Lights with LEDs
LEDs are more energy efficient lighting assets and require less maintenance than traditional
lights. The entire industry is now moving towards installing LEDs as the standard asset. In
the United Energy (UE) Regulatory Proposal 2021- 2026 (page 196), UE outline their
approach to LED replacements:
“For 2021- 2026, we propose to replace all failing SHPs with category V LEDs to help
our customers reach their efficiency goals sooner. To minimise costs to all customers,
we only replace those lights if they fail or if the replacement is necessary. Our customers
will make the decision if they wish to replace the remaining inefficient lights in bulk.
In addition, UE indicate that their approach to bulk replacements is for customers to decide
on this replacement approach.
Recommendation
• All DNSPs should replace current streetlights with LEDs when assets fail. This should
be built into all relevant cost models for this coming period
• Customers are to determine the approach to bulk replacements to LEDs
• All old lights should be fully recycled
2.1.2 Smart Lighting
Powercor, UE and CitiPower have included smart PE cells within the cost models for any
Category V replacement. This cost impact on maintenance prices is not insignificant,
compared to standard PE Cells (estimated at 5% of total costs) over the 5-year period.
However, detailed analysis carried out by councils indicates that these smart PE cells,
combined with a Smart Lighting Control Management System (CMS), has the potential to
reduce overall costs and energy consumption from street lighting by as much as 40%. The
11CMS enables the smart control functionality to be enabled within each light remotely and
has a critical role in delivering these savings.
A series of sector-wide workshops and surveys were conducted to enable councils to
consider the pros and cons of the proposed investment by DNSPs. In total, there were 47
responses representing councils across all DNSP regions.
TABLE 1: Local Government survey results
Question: “Do you agree with the recommendation that the distributors should fund a CMS system and
install smart PE cells and when there are failures of Category V street lights?”
Response # responses Percent
Yes, distributors should fund CMS system and install smart PE cells
43 91%
and when there are failures of Category V street lights
No, distributors should not fund CMS system and install smart PE
1 2%
cells and when there are failures of Category V street lights
Unsure 3 6%
Total 47 100%
The survey results show that most Victorian councils agreed with the recommendation that
DNSPs should fund the CMS systems and install smart PE cells when replacing failed
Category V streetlights (91%). Only one council (2%) was opposed to this approach, and
three councils were unsure (6%).
Recommendations
• DNSPs should be required to include the installation of smart photo-electric (PE) cells
in their replacement programs for Category V street lighting
• DNSPs should be required to invest in a smart lighting CMS to enable customers to
effectively manage any smart lighting assets they install
• Ensure smart lighting investments are best value for customers and implemented
efficiently across the state, by considering the learnings form the Victorian Advanced
Metering Infrastructure System
2.1.3 Changes to the Victorian Public Lighting Code
The (Victorian) Public Lighting Code (the “Code”) was released by the Victorian Essential
Services Commission in April 2005 and aims to:
“… regulate the provision of public lighting or the arrangements for such provision by
specifying minimum standards and certain obligations of distributors and public
lighting customers (bolding from original document). The objective of such regulation is
to provide a safe visual environment for pedestrian and vehicular movement during
times of inadequate natural light.”
12Minor updates relating to “ESC’s Review of the Guaranteed Service Level payment” were
released in December 2015.
Since 2005 significant technology changes have occurred in the street lighting and electricity
network sectors which has large impacts on the operation and management of street
lighting. As such, the Code is now out of date with both customers and DNSPs regularly
ignoring irrelevant clauses. Despite this, the Code remains a key method by which the
DNSPs and the AER test the assumptions within the cost models put forward by DNSPs.
Changes in technology have resulted in the Code not reflecting appropriate minimum
standards. Table 2 provides several examples to demonstrate areas where the Code
requires updating to provide effective minimum standards for public lighting. They are not
designed to be comprehensive but simply to confirm the need for change.
TABLE 2: Examples of current Code clauses that require change
Clause within Code Requirement for updating
N/A (i.e. not relevant to a specific Clause currently) Clarify the governance, maintenance and service
relationship between DNSPs and customers where
smart technology is installed on street lighting assets.
N/A Formal processes for engagement and negotiation
between DNSPs and customers with regard to public
lighting issues are now common place. This should be
reflected within the Code.
N/A Increase recycling requirements for public lighting. Old
lamps contained 80-90% glass, whilst new LEDs are
less than 15%. Ensure the requirements of the Code
cover appropriate recycling of LED products.
2.1c) develop and implement plans for the Additional focus on energy efficiency and consideration
operation, maintenance, refurbishment, of life cycle costs is required.
replacement, repair and disposal of its public
lighting assets:
- in a way which minimises costs to public lighting
customers
2.3.1a) operate a 24hr call centre to receive public The advent of smart technology changes provides
and public lighting customer reports of public alternative interface platforms to the mandatory 24h call
lighting faults centre requirement for registering the reporting of
lighting faults by customers.
2.3.1c) replace non-major road lamps at least every Public lighting technology has changed with the
4 years or otherwise as required by public lighting introduction of longer life technology. These new
standards technologies provide opportunities to vary the
2.3.1d) clean, inspect for damage and repair maintenance regime due to the availability of longer life
luminaires during any re-lamping; components and more robust luminaires, however
these changes are not reflected in the current code
2.3.1d) replace photo-electric cells at least every 8 requirements for minimum service levels.
years or otherwise as required by public lighting
standards
2.3.1e) routinely patrol major roads at night to The advent of smart technology provides the ability to
inspect, replace or repair luminaires at least 3 times remotely understand maintenance and performance
per year requirements for public lighting.
13During the workshop series, councils were surveyed on whether the Code should be
updated.
TABLE 3: Local Government survey results
Question: “Do you agree with the recommendation that the Public Lighting Code should be updated?”
Response # responses Percent
Yes, I agree with the recommendation that the Public Lighting
46 94%
Code should be updated
No, I don’t agree with the recommendation that the Public
1 2%
Lighting Code should be updated
Unsure 3 4%
Total 49 100%
Nearly all (94%) of the 49 councils that participated in the survey believe that the Victorian
Public Lighting Code needs to be updated. Only one council (2%) did not agree, based on
concerns that the update may generate additional cost for councils. A small number of
councils (4%) are not sure if an updated Code is necessary. In the past at least one DNSP
has written a letter requesting that the Code be updated.
Recommendation
• The AER should request a review of the Victorian Public Lighting Code be
implemented by the Victorian Essential Services Commission in time to influence
(where relevant) the next Victorian Energy Distribution Price Review.
2.2 Detailed Public Lighting Cost Model Inputs
Detailed analysis of the public lighting cost models submitted by each DNSP indicates there are
many areas where best practice should be implemented across DNSPs. For some inputs the
recommended changes are modest, in others there are clear errors or significant over
statements which – once rectified – should result in obvious and large savings for customers.
Overall, the recommendations within this section are to bring each of the inputs in line with best
practice. These changes have the potential to save customers over $20m over the period.
The relevant inputs include:
• Inputs – all lamps
• Pole Inspection Rates
• Hours Per Day
• Repairs and Replacements
14• LED luminaire prices
• Jemena urbanization
• LED Fault Rates
• AusNet Funded LED Replacement Program
• Abolishing charges
• Language within the model
2.2.1 Inputs - All Lamps
Some inputs for all lamps are unusually varied. Each of the inputs summarised in Table 2
are discussed further below.
TABLE 4: Comparison of inputs for all lamps (2021/22 data utilised)
Inputs - all lamps Powercor UE CitiPower Jemena AusNet
Labour rate (per hour) $117.03 $105.61 $117.03 $121.52 $111.36
Labour rate for night patrols
$140.18 $140.18 $140.18 $171.75 $143.48
(per hour)
Elevated platform vehicle (per
$50.18 $44.69 $44.69 $45.64 $72.59
hour) - urban MV, urban T5
Elevated platform vehicle (per
$63.64 $44.69 $63.64 $58.69 $103.72
hour) - rural MV, rural T5, S-HP
Patrol vehicle (per hour) $34.37 $11.06 $28.20 $14.04 $39.54
TABLE 5: Comparison of inputs for all lamps – variance to UE Pricing
Variance to UE Price Powercor CitiPower Jemena AusNet
Labour rate (per hour) 11% 11% 15% 5%
Labour rate for night patrols (per hour) 0% 0% 23% 2%
Elevated platform vehicle (per hour) - urban
12% 0% 2% 62%
MV,urban T5
Elevated platform vehicle (per hour) - rural MV,
42% 42% 31% 132%
rural T5, S-HP
Patrol vehicle (per hour) 211% 155% 27% 258%
Labour rate (per hour)
The labour rates for Powercor, CitiPower and Jemena are 11-15% higher than UE. It is
unreasonable that these rates are so different. We propose either the lowest costs be
applied across all DNSPs or the average of UE and AusNet to be used in the Jemena,
CitiPower and Powercor determination.
15Labour rate for night patrols (per hour)
Similar to the labour rates above, the labour rates for night patrols vary widely. The prices
for Jemena are more than 20% higher than all other DNSPs. It is unreasonable for this
range to be so wide. We consider it reasonable that Jemena prices utilise the lowest cost
of any Victorian DNSP or the average of the other four DNSPs.
Elevated platform vehicle (per hour) – urban or rural, MV and T5 and Patrol vehicle (per
hour)
The range of costs for these items (EPV costs in urban and rural areas and patrol vehicles)
is large. Without specific reason for this it appears that some rates are uncompetitive. Given
that each of the DNSPs meet both Energy Safe Victoria (ESV) and Victorian Electricity
Supply Industry (VESI) guidelines, it is unreasonable for some prices to be as much as
double those of other DNSPs. Such variance in the tender prices suggests that the
procurement processes to reduce costs has been ineffective.
We propose for urban areas that the average of United Energy, CitiPower and Jemena be
utilised and for rural areas that the lowest DNSP price be used.
Patrol Vehicle (per hour)
The Patrol Vehicle rates (per hour) vary widely. Several are more than triple the lowest
cost. It is unreasonable for this range to be so wide. We consider it reasonable that the
average of Jemena and UE be utilised by the remaining three DNSPs.
Recommendations
• The lowest cost labour rate (per hour) should be applied across all DNSPs (United
Energy) or the average of United Energy (UE) and AusNet should be used in the
Jemena, CitiPower and Powercor determination
• The lowest cost labour rate for night patrols (per hour); Jemena prices utilise the lowest
cost of any Victorian DNSP or the average of the other 4 DNSPs
• The average rate for Elevated Platform Vehicle (EPV, per hour) in United Energy,
CitiPower and Jemena should be utilized in urban areas, and the lowest DNSP price
should be used for rural areas
2.2.2 Pole Inspection Rate
Jemena have proposed a pole inspection rate of 37, this is half that of the other DNSPs
which are typically around 75. Without further information from Jemena we assume this
figure is in error. In any case this should be benchmarked and the rate of inspections of
other DNSPs utilised.
16Recommendation
• Jemena’s pole inspection rate should be reset to 75 poles per day
2.2.3 Hours Per Day
The hours per day within each model should reflect previous AER determinations, which
clarify that the appropriate hours per day for Alternate Control Services are 7.5 hours per
day (see Table 6).
TABLE 6: Available hours1
Days or
Item Comment
Hours
Public Holidays 10 Victorian Government Gazette
Personal/ Carers leave 12 Electrical Power Industry Award 2010
Annual Leave 20 Fair Work- National Employment Standards
Working days per annum 219
Some DNSPs have 9 day fortnights with 8.33 hours per
Hours per day 7.5
day, which gives the same net result
Available hours per annum 1642.5
Recommendation
• Confirm with all DNSPs that the number of hours per day are 7.5, as per previous AER
determinations
2.2.4 Repairs and Replacements
The volume of repairs and replacement vary widely across DNSPs. The impact of these
variances for customers where DNSPs are not using best practice rates, is more than $10m
over the 5 years. This variance between best and worst practice demonstrates a concerning
level of over-charging.
1 AER Review of rates in proposed ACS Charges (25 May 2010)
17TABLE outlines a sample of repair and replacement rates for all Victorian DNSPs.
Variances of up to 100% were found, with significant inefficiencies demonstrated for all
AusNet rates.
TABLE 7: Sample proposed repair and replacement rates for Victorian DNSPs
% Variance below
Jemena UE AusNet Powercor CitiPower UE/CitiPower/Powercor
Jemena AusNet
Urban 85 86 66 86 86 1% 31%
Number of bulk
lamp changes in 1 Rural 70 72 54 72 3% 33%
day
Remote 37 60 62%
Urban 15 29 18 29 29 93% 60%
Number of repairs
Rural 12 24 14 24 100% 71%
in 1 day MV 80
Remote 10 19 92%
Urban 15 19 15 19 19 27% 28%
Number of repairs
in 1 day SHP 150 Rural 12 15 11 15 25% 40%
and V LEDs
Remote 9 12 28%
Urban 77 74 66 74 74 -4% 12%
Number of bulk PE
Cell changes in 1 Rural 64 61 54 61 -5% 14%
day P LED
Remote 37 49 32%
Urban 15 25 18 25 25 66% 39%
Number of repairs
Rural 12 20 14 20 67% 44%
in 1 day P LED
Remote 10 16 63%
Recommendation
• All submitted replacement and repair rates should be benchmarked and the best practice
within each category should be utilised to allocate a standard rate across all DNSPs
2.2.5 LED Luminaire Prices
By comparing the LED material pricing submitted by each DNSP it becomes clear that a
reasonable cost has been allocated by three DNSPs. However, for Category P LEDs,
Jemena and AusNet have significantly inflated market pricing at 50% and 85% above their
counterparts (see TABLE ). Note that councils can directly access pricing in line with or
better than the lowest pricing in TABLE .
TABLE 8: Proposed LED luminaire prices
18Type Jemena UE AusNet CitiPower Powercor
P LED $ 307.04 $ 205.00 $ 379.79 $ 205.00 $ 205.00
V LED $ 565.00 $ 886.88 $ 565.00 $ 565.00
In terms of V Category LED, AusNet pricing is again significantly higher than the other
DNSPs submitted pricing ($888 compared to $565). Alternatively, if the DNSPs are in fact
seeing these costs from manufacturers (noting that overheads are already charged
elsewhere in the models) then the tendering processes they employ are clearly not effective
in driving competitive pricing for street lighting.
In the 2016-2020 determination the AER, when discussing public lighting luminaire pricing,
indicated:
“The least cost purchase price is not necessarily the most effective or efficient for
distributors, as distributors need to take into account the reliability of the supplier, the
quality of the products that they supply and the total costs for distributors over the life
of the materials. Distributors may also want to source materials from more than one
supplier, in order to ensure competitive tension in the market for public lighting inputs.
To source from only one supplier runs the risk of supplier monopoly pricing and service
quality issues.”
Councils agree that the above issues need to be managed effectively by DNSPs. However,
when assessing the approved products, it is clear that for LEDs there is no justification for
radically different material pricing amongst Victorian DNSPs. TABLE provides a summary of
the approved products for each Victorian DNSP. There is considerable overlap between the
approvals and only a small number of LEDs approved by Jemena and Powercor and
CitiPower that are not approved by all DNSPs. Despite these additional approvals (only 5 of
18 total approved standard lights), UE have the same material prices as Powercor and
CitiPower for all LEDs within the pricing models.
TABLE 9: Approved Standard LED products Victorian DNSPs April 2020
Type Powercor CitiPower UE AusNet Jemena
Aldridge, PLED II, 17W
Aldridge, PLED II, 20W
Sylvania-Schreder, StreetLED MKIII, 17W
Category P
Sylvania-Schreder, StreetLED MKII, 17W
Sylvania-Schreder, StreetLED MKII, 22W
Sylvania-Schreder, StreetLED MKII, 33W
LSS, GE Evolve P4/P5 Gen 3, 17W
LSS, GE Evolve P4/P5 Gen 2, 20W
Aldridge Aero V-LED, 198W
Categor
yV
Aldridge Aero V-LED II, 75W
Aldridge Aero V-LED II, 175W
19Aldridge Aero V-LED II, 265W
Sylvania-Schreder, RoadLED, 155W
Sylvania-Schreder, RoadLED, 275W
Sylvania-Schreder, RoadLED Midi, 70W
Sylvania-Schreder, RoadLED Midi, 150W
LSS, GE 157W
LSS, GE 275W
Recommendation
• The average pricing of UE, CitiPower and Powercor should be used to determine LED
luminaire pricing within the public lighting models
2.2.6 Include Jemena lighting within urban region
Jemena indicates that 5% of their area is rural. As indicated within many images on the
Jemena website, Jemena is 100% within the boundaries of Greater Melbourne. It may be
that this determination of the Jemena region was made some time ago before Gisborne,
Sunbury and Clarkefield became incorporated into Melbourne’s growth areas.
Recommendation
• Adjust all inputs so that Jemena is considered 100% within the urban region of
Melbourne
2.2.7 LED Fault Rates
The Public Lighting Models for PLED (Category P LEDs) include a “Proportion of luminaires
that fail between bulk change”. Within the model, the only failure rate attributed to the LED is
that of the PE cells. Councils experience common LED failure rates of below 1% for most
20DNSPs. In addition, AusNet have provided detailed failure rate statistics within their
modelling. Based on the numbers provided by the DNSPs we are assuming that they are
providing 20 year failure rates for the LEDs.
However, we request that the AER confirm these assumptions and identify a common failure
rate statistic for the 20 year period for all DNSPs.
In terms of the actual failure rate itself, AusNet indicate that they have”
“Reduced (repairs for luminaires) from 15% to 0 because major repairs (luminaire
replacements) are capitalised in our accounting methodology.”
In addition, in the Alternative Control Service: Connection and ancillary network services
Addendum provide revised failure rates based on 2016-2018 actual data. Based on this
AusNet conclude:
“Our revised light failure analysis shows the average fault rate (from 2016 to 2018,
inserted by author) for LED lights is 1.09%, comprising of 0.49% luminaire
replacements, 0.46% PE cell replacements, and 0.14% other repairs.”
Note that the 0.49% for luminaire replacements is capitalised so cannot be double counted
within the failure rate in the model.
Within the public lighting model, the failure rate for LEDs utilises old data from the previous
model for T5s (8.9%) and needs to be replaced with this updated information. The AusNet
LED failure data is detailed in Table 10.
TABLE 10: AusNet Services Record of LED Failures 2016 to 2018 per luminaire
% of overall failure
AusNet Service LED failure % failure % of overall Extrapolated 8
(exc. luminaire
rates p.a. failures year failure rate*
replacements)
% of repairs - PE cells 0.46% 42% 77% 3.7%
% of repairs – luminaires 0.49% 45% 3.9%
% of repairs – other 0.14% 13% 23% 1.1%
Total 1.09% 8.7%
Total (exc. Luminaires) 0.60% 4.8%
*Note in reality this may be a 20 year failure rate. The calculations in the model need to be assessed by the
AER before confirming.
Note that in the AusNet model the stated LED failure rate for all Category P LEDs (18W and
14W) is inputted at 8.9%, which based on their own data is in error. If extrapolated, this data
appears to be similar to the majority of other DNSPs at 12% failure rates over 20 years.
21Recommendation
• Confirm assumptions around the time period that the LED failure rates apply to and
identifying a common failure rate statistic for the 20-year period for all DNSPs
• Ensure that a common approach to capitalisation and failure rate statistics be applied
and, if failure rate data is not available from other DNSPs, utilising the AusNet supplied
data over 20 years for the coming 5-year period
2.2.8 AusNet Funded LED Replacement Program
AusNet are proposing to replace 29,000 street lights to LEDs within the 5 year period. The
cost of this program is approximately $18m (or 28% of total revenue for AusNet) and will add
a further $5m to the Regulatory Asset Base (RAB). The overall impact on the maintenance
pricing for all councils over 5 years is to add approximately 25% to the energy efficient
lighting charges in 2025.
In April 2020, a dedicated workshop was held with 18 councils in the AusNet region to
discuss this bulk replacement proposal. All councils were invited to provide views, queries
and comments during the workshop and a follow up survey was completed to understand
council views on the AusNet proposal. Error! Reference source not found. provides a s
ummary of the council responses to the following recommendation:
• Reject AusNet’s proposal to fund the replacement of 29,000 LEDs.
• Invite AusNet to work with customers collectively to scope a DNSP wide project where
the scope and costs are transparent and defined by customers.
The majority of councils rejected AusNets replacement program and, in addition supported
working closely with AusNet to scope a DNSP wide program that is scoped and defined by
the customers.
Table 11: Local Government survey results
Question: “Do you support the above recommendation to respond to AusNet's proposed LED bulk replacement
programme?”
Response # responses Percent
Yes, I support the recommendation 16 89%
No, I do not support the recommendation 1 6%
Unsure 1 6%
Total 18 100%
There are many issues with AusNet’s proposed approach. Importantly, the proposed project
costs are not scoped appropriately to deliver the replacement program to the majority of
lights, of which more than 20,000 are non-standard assets. Furthermore, councils which
22have already replaced all inefficient lights will be required to fund the proposed program for
the next 20 years. Whilst councils applaud AusNet for initiating a proactive energy efficient
replacement program, ultimately such a program needs to be agreed by customers – which
is not the case here, given that 89% of councils rejected AusNet’s proposal.
Recommendation
• The proposed funding program by AusNet for 29,000 LEDs should be rejected
• AusNet should work closely with customers collectively to deliver a DNSP wide program
that is defined and scoped by customers
2.2.9 Abolishing of Charges
UE have indicated they have abolished or will continue to deliver free certain charges, due
to how simple they are to deliver now that smart meters are present across the network. The
UE charges that have been abolished for the 2021-25 period include:
• Abolishment of under 100 amps (non-complex)
• Desktop and site assessments for No Go Zones
• Service truck visits
• Remote energisations/de-energisations
We call upon the AER to encourage the practice of abolishing charges across all DNSPs
that can now be abolished because of system improvements.
Recommendation
• The AER should assess the practice of abolishing charges, because of system
improvements, including whether these are being applied evenly across all DNSPs
2.2.10 Language in the Public Lighting Models
Please change in these models “Number of men in crew” to “Number of workers in crew” or
similar (i.e. non-gender specific).
233. DEMAND MANAGEMENT
Demand management is a flexible and relatively low-cost network solution compared to
traditional asset replacement or augmentation. Its value is enhanced by its ability to deliver
additional societal co-benefits, such as the associated reduction in greenhouse gas emissions.
TABLE 12: Summary of proposed demand management expenditure
Real ($m Real 2020) UNITED JEMENA CITIPOWER POWERCOR AUSNET
Broad based demand management
$8.6 No data $5.5 $4.7 $7.5
(business as usual OPEX/CAPEX)
Demand management incentive
$2.40 $2.04 $2.00 $3.50 $3.46
scheme (DMIS) allowance
Total demand management spend $11.0 No Data $7.50 $8.20 $10.96
Total proposed network expenditure $1,219 $1,285 $852 $2,140 $3,186
Portion of total expenditure on DM 0.90% No data 0.88% 0.38% 0.34%
3.1 Broad base demand management expenditure
There is a concerning lack of priority given to demand management in the proposals put forward
by Victorian DNSPs (See Table 12). This highlights the fact that the current regulatory
framework creates significant barriers to the uptake of demand management and provides a
clear capex bias towards the way in which network businesses operate.
With the exception of AusNet Services and United Energy, there is disappointing lack of
transparency around the total expenditure proposed by the businesses on broad based demand
management activities (i.e. business as usual opex, capex or augex). Table 12 demonstrates
that there is no expenditure data available for Jemena, with the amounts for CitiPower and
PowerCor assumed on secondary references within the each proposal. Where data is available
(e.g. United Energy) it is clear that broad based demand management is still not core business
for the DNSPs, with just 0.46% of total network expenditure allocated to reducing demand.
Recommendations:
• Demand management activities and associated expenditure should be afforded the same
level of transparency as other forms of expenditure in all regulatory proposals in future
• Forecasted expenditure (OPEX/CAPEX/AUGEX) on broad based demand management
initiatives and a description of each activity should be included in the revised proposals for
Jenema, CitiPower and PowerCor
243.2 Demand management incentive scheme allowance expenditure
Government intervention to support or stimulate innovation is required in areas where the
benefits of such innovation cannot be fully captured by the businesses that initially invest in
research, development and commercialisation. The authorisation of incentive allowances should
be contingent on distribution businesses committing to a clear development pathway that
demonstrates the transition to a business as usual approach (i.e. funded through
OPEX/CAPEX/AUGEX). There are some excellent examples of this occurring already, including
United Energy’s Summer Savers program and the Hasting to Rosebud Community Grid.
Table 12 demonstrates that the combined DMIS allowance requests for all five business
equates to $13.4m. This represents just 0.15% of the total network investment proposed across
the period. This amount is clearly insignificant when compared with other industrialised
businesses where expenditure on research and development is often higher by several orders
of magnitude.2
It should be noted that two of the five businesses (United Energy and AusNet Services) have
provided clear documentation for how they intend to use their DMIS allowance in the next
period. In contrast, Jemena, CitiPower and PowerCor provide no justification for their continued
request for DMIS funding (totaling $7.54m).
We consider it is unreasonable for the AER to approve DMIS expenditure where there is no
transparency around the types of activities that it will be ‘incentivised’. Should the three DNSPs
provide appropriate evidence in their revised proposals later this year, councils will reconsider
their support for their requests for funding under the incentive scheme.
In the case of United Energy and AusNet Services, we believe their DMIS allowance proposals
are reasonable given the types of activities proposed by the businesses are clearly defined and
deliver other co-benefits aligned with the objectives of Local Governments, particularly around
emission reductions. Many such initiatives are proposed to be delivered in partnership with
councils, including examples such as AusNet Services’ Good Grid program.
Recommendations:
• The AER should provide clear and strong incentives for the network business to undertake
pilots and trial projects to fully assess the costs and benefits of new innovations (where a
clear development pathway to ‘business as usual’ can be demonstrated).
• United Energy and AusNet Services should be granted their full requested allowance under
the DMIS scheme.
2 2010 EU Industrial R&D Investment Scoreboard (link)
25• Jemena, CitiPower and PowerCor should provide additional documentation in their revised
proposals outlining the types of projects requiring funding through the DMIS.
3.3 Voltage management
In 2017, ARENA provided $5.76m funding for a $6.61m United Energy project to reduce voltage
across the electricity network.3 The project utilised the comprehensive information being
provided by customer smart meters to adjust voltage levels coming out of the zone substations
across the UE network (47 substations).
This work was focused on demand management for a small number of days in summer with
peak energy consumption in order to access the impact on income for reducing demand at peak
times. The customer funded Advanced Metering Infrastructure (AMI) would require some
enhancements and was expected to result in reduced real power load across the network.
The project found the following:
• Results of voltage reduction tests demonstrated a 0.8% real power reduction on average for
every 1.0% voltage reduction4
• Multiple tests over a 14 month period demonstrated real power reductions within the
network ranging between 1.29% and 3.26%, with an average of 1.98% (See Figure 1)
• Significant improvements in compliance with Australian Standards (Australian Standard
61000.3.100-2011) for voltage range (See Figure 2)
Figure 1: Demand response curve for May 2018 test (UE Demand Response Project
Performance Report - Milestone 3).
3 https://arena.gov.au/projects/united-energy-distribution-demand-response/
4
UE Demand Response Project Performance Report - Milestone 1, Page 4.
26Figure 2: Ability of DNSP to change voltage levels on the network and maintain
compliance to Australian Standards (UE Demand Response Project Performance Report -
Milestone 5).
Although this project demonstrated considerable real power savings, its’ applicability within the
confines of the demand management program run by AEMO were ultimately determined to be
limited. This was because determining a relevant reference day for each claim by UE became
difficult given such a short history of data and increasingly hot days to find comparative
information on. The reason for raising this within this submission is not to discuss how to reduce
peak demand, but in fact to advocate for this, now well tested technology, to be deployed across
all of Victoria, all of the time.
United Energy identified there was limited potential once the load on the network dropped. This
is true if the aim is to reduce peak demand. However, if the aim is to reduce real power across
the network and deliver the subsequent reduction in overall cost to the community for the
electricity system, then the potential real power savings are as high as in peak times.
Across the network voltage levels are typically higher when load is low and drops when load is
high (Figure 3). This indicates that if the purpose of voltage control was to reduce energy and
27costs for consumers then there are greater opportunities outside of these very narrow and
limited peak electricity demand periods.
Figure 3: Victorian daily voltage profile (January (LHS) and June (RHS))
The program itself largely focused on reducing peak demand5, in order reduce future electricity
distribution system investment and to access funding through demand management programs.
However, there are very large potential benefits to the Victorian Community in implementing this
program at all possible times.
Modelling completed for this submission, based on the UE data, indicates that the potential for a
state-wide roll out of this technology, that is then deployed continuously, has the following
potential benefits:
• Reducing real power demand across the state by as much as 2%
• Reducing greenhouse gas emissions by around 1 million tonnes (Mt) of carbon dioxide
equivalent (CO2-e)
• Reducing costs to the Victorian community by an estimated $100-300m p.a.
• Lower voltage levels can allow for greater distributed generation assets (such as solar) on
networks.
It is the responsibility of the AER (most likely in conjunction with the AEMC) to ensure the
learnings from this project are enshrined within the minimum requirements of all Victorian
DNSPs in order to reduce overall costs of the electricity system to the community.
There is much complexity in making this happen, however, there are a number of initial steps
the AER can implement within this pricing determination to ensure this is implemented in the
5
From page 16 of United Energy Demand Response Project Performance Report - Milestone 5: “The main driver for DVMS is to be
able to dynamically move the voltage profile of each zone substation on the UE distribution network toward the lower limit of 216V
(V1%) that is defined in Australian Standard 61000.3.100-2011 in order to deliver demand response service to minimise any
customers outside of the stipulated regulatory limits”.
28short term. There is no doubt that leaving this until 2026 would be a considerable disservice to
the Victorian community.
Recommendations:
• The AER require that all Victorian DNSPs commit to replicating the United Energy Dynamic
Voltage Management System (DVMS) capability throughout the entire network
• Within the 2021-26 period (and as early as possible) the AER require the operation of the
DVMS as a minimum operational requirement of the Victorian DNSPs aimed at reducing
overall system real power, within the constraints of relevant Australian Standards
• That the costs to implement these recommendations be incorporated into the 2021-26
pricing period
• That the AER investigate the applicability of rolling DVMS nationally.
29You can also read