Extending the Reach of Adult Education Using the Who's Online Where (WOW) Index
←
→
Page content transcription
If your browser does not render page correctly, please read the page content below
Extending the Reach of Adult Education
Using the Who’s Online Where (WOW)
Index

Draft for Discussion, May 2014

                                         1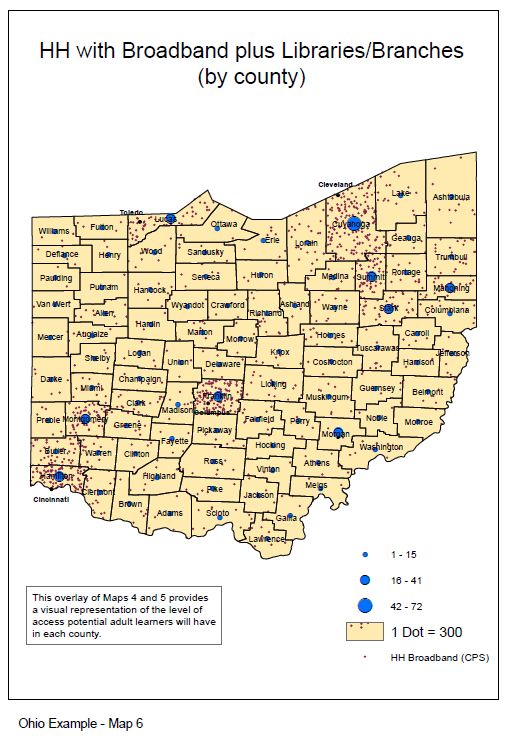
Table of Contents

Executive Summary....................................................................................................................................... 3
Overview and Need....................................................................................................................................... 4
Online Learning – What We Know ................................................................................................................ 4
Costs: Face-to-Face and Online .................................................................................................................... 6
The Question of Access – Who’s Online? ..................................................................................................... 6
Alternatives for Access.................................................................................................................................. 8
   Public Libraries .......................................................................................................................................... 8
   Community Anchor Institutions ................................................................................................................ 8
   Initiatives for Home Internet Expansion ................................................................................................... 9
The WOW (Who’s Online Where) Index ..................................................................................................... 10
   WOW Index Elements ............................................................................................................................. 11
   Methodology........................................................................................................................................... 12
   Example – Ohio ....................................................................................................................................... 13
Thoughts, Conclusions and Recommendations .......................................................................................... 13
Appendix A: WOW Index Elements (100 pts total) and Intervention Recommendations......................... 15
Appendix B: Examples of Current Technology-Enabled and Online Projects ............................................. 16
   Ohio’s Distance Education Hub – Centralizing Services for Wider Reach .............................................. 16
       Corresponding Maps ........................................................................................................................... 17
       Corresponding Table of WOW Index Preliminary Calculations – Ohio ............................................... 25
   New York State Office for New Americans – ESOL Model ...................................................................... 31
   Arizona’s Flipped Classroom Project....................................................................................................... 32
   Learner Web – Technology-Based Learning Plans .................................................................................. 33
       A Learner Web Example: Minnesota ................................................................................................. 34
Appendix C: Summary Checklist................................................................................................................. 35
References .................................................................................................................................................. 36
Acknowledgements..................................................................................................................................... 38

                                                                                                                                                              2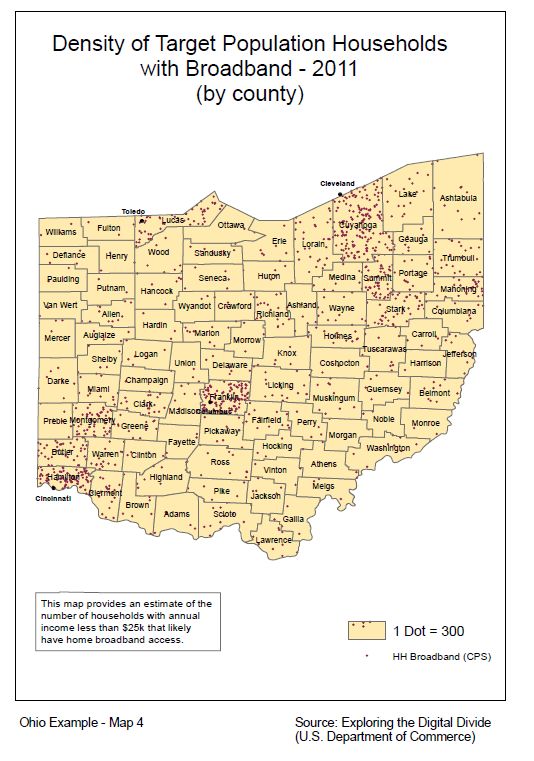
Executive Summary
        No previous technology for literacy has been adopted by so many, in so many
        different places, in such a short period, and with such profound consequences.
        The sudden appearance of a new technology for literacy as powerful as the
        Internet has required us to look at the issue of new literacy with fresh lenses
        (Lesgold and Welch-Ross 2012, 163).
The Internet has changed the way we do business, as well as the way we deliver education. This report
and the WOW Index package (report, appendices, and fillable worksheets) take a closer look at how the
Internet can impact our national need to reach more learners who need adult education programs. The
Index itself is designed to be a resource for state directors and other administrators. It takes into
consideration several factors related to population demographics and broadband Internet access
predictors, ultimately providing leaders with county level information about where the eligible adult
population lives and how likely they are to be able to conveniently access the Internet. The goal of the
WOW Index is to give state directors and other leaders a way to determine where they should offer
face-to-face, hybrid or fully online adult education programs. The Index is a work in progress and is
expected to be adjusted based on usage.
There are several sections to the report. It begins with an overview of the need for extending adult
education programming to the many eligible adults currently not being served, and using it to
supplement programming for those already in classes. A discussion about online learning and what we
know about Internet access for this population follows. The WOW Index and its elements are
introduced later in the paper. Appendices provide: examples of how four states are using technology in
their programming, a checklist for program designers, references, and resources. Accompanying the
report and appendices is a fillable worksheet file.
Included in the total WOW Index package is a case study for the sample state of Ohio which consists of a
worksheet and a series of maps that give a visual representation of the data gathered for making
decisions about delivery-mode options.

                                                                                                         3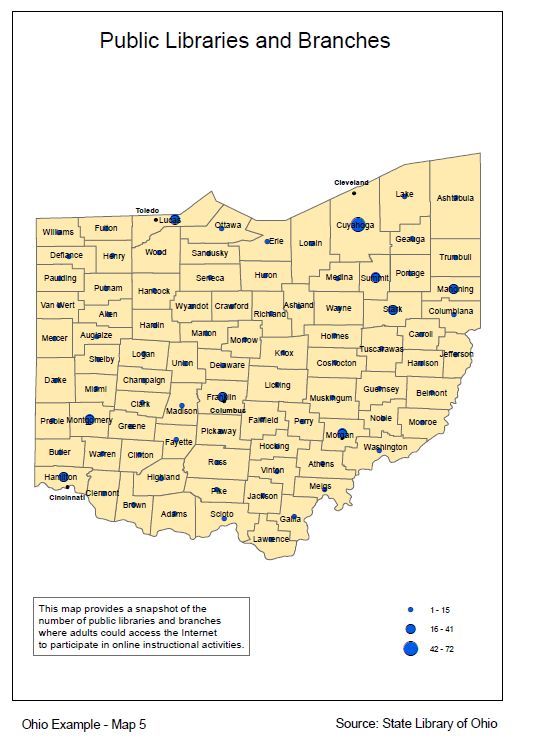
Overview and Need
The number of adults who are at or below basic levels of literacy and numeracy presents providers of
adult education programs with a significant set of challenges. According to the recent Program for the
International Assessment of Adult Competencies (PIAAC) Survey of Adult Skills conducted by the
Organization for Economic Co-operation and Development (OECD Skills 2013), and the related report,
Time for the U.S. to Reskill?: What the Survey of Adult Skills Says (OECD Time 2013), about 36 million
adults are considered “low skilled” (having below Level 2 literacy and numeracy skills on the PIAAC
Survey) and would be eligible for Adult Basic Education (ABE), Adult Secondary Education (ASE) and/or
English as a Second Language (ESL) programs. In addition, the report estimates that approximately 3
million adults with low skills would like to participate in programs, but are not able to do so due to
various barriers. The first challenge is that in reporting year 2012-2013, only 1.7 million youth and
adults were enrolled in federally-funded, state-administered adult education programs (OCTAE, National
Reporting System).
In addition to the need to expand the reach of these programs, there is a second challenge of adults not
being able to commit the amount of time necessary to make significant gains once they enroll. This
challenge and the implications for programming are well-documented in a recent study by the National
Research Council (Lesgold and Welch-Ross 2012). The report found that adults engaged in ABE, ASE
and/or ESL attend, on average, approximately 100 hours of instruction during a program year, and only
about one-third make significant gains during that time. Learning to read, however, is a complex skill
that may take thousands of hours of practice to master, as does learning math or other content. Work
schedules, financial needs, family responsibilities, poor health, transportation barriers, and other life
situations will continue to present barriers to these adults’ participation in face-to-face classes.
The WOW project was designed to assist with two of the challenges facing adult education programs: 1)
how to significantly expand the reach of programs to serve more learners, and 2) how to increase the
amount of instruction through online learning such that learners’ progress can be accelerated. The
highlight of the project is an index designed to help adult education state directors determine best
locations to invest resources for delivery of online instructional materials.

Online Learning – What We Know
One way to address both the scaling and time commitment challenges described above is to provide
online learning options. For the purposes of this paper, online learning is defined as “activities for which
Web-based content and Internet connection and interactivity are integral to the experience for at least a
portion of the engaged time” (National Institute for Literacy 2008, 20). The delivery of online content
today is not limited to a dedicated desktop computer; online content can also be accessed via public
access computers, laptops, tablets, smartphones and other mobile devices. The ultimate goal for online
content is to be accessible via multiple devices and networks.
While not a complete solution, developing programs that include online instruction will allow for an
extended reach of the programs, and will provide a convenience factor that allows learners to more
effectively manage their education with other responsibilities. Online content can also provide

                                                                                                          4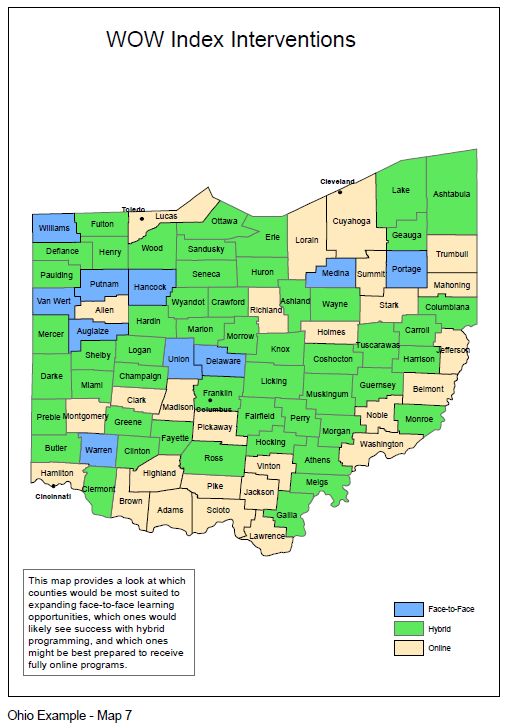
opportunities for meaningful supplemental practice and enrichment of developing skills, while
simultaneously boosting adults’ digital literacy skills.
The convenience factor is non-trivial. The 24/7 access to instructional content means that adult learners
can make the programs work with their schedules instead of the other way around. More convenience
may lead to more engagement.
A popular alternative to fully online courses and programs is a blended, or hybrid approach that includes
both face-to-face and online learning strategies. There are several models currently being practiced in
higher education, teacher professional development, and K-12 education. The amount of face-to-face
time for critical dialogue may be reduced; but, it is re-conceptualized to be used for critical dialogue,
review or expansion of the content, assessments that must be proctored, and/or pre-teaching of the
next lesson. For example, Arizona has piloted a “flipped classroom” approach in which students are
expected to work independently online for approximately 10 hours per week, and then meet once a
week for two hours face-to-face with peers and an instructor. This model allows instructors to help
students build their independent learning skills and address any misconceptions or issues during the
face-to-face experience. The pilot has shown positive results, and Arizona is now starting to roll the
program out statewide (see Appendix B for more information about this and other examples). Research
has shown that a blended approach with postsecondary and continuing education students leads to
more successful outcomes than face-to-face only, or online only instruction (U.S. Department of
Education 2010, ix).
The report, Investigating the Language and Literacy Skills Required for Independent Online Learning
(National Institute for Literacy 2008), reviewed evidence for adding online learning strategies to adult
literacy and adult ESL programs. The report found that there are no distinct levels or thresholds for
when a learner is ready for online learning, and that well-designed blended courses and programs that
can provide quality online learning environments along with supports help these learners succeed. The
report concludes “that it is the interaction among learners’ skills, the online environments they
encounter, and the supports available that determines those thresholds; and, that even [adult] learners
with very low literacy or language proficiency have been successful with some online learning
environments” (p. 34). Furthermore, the report found that online learning in and of itself fosters
independent and self-directed learning, and boosts digital literacy skills.
In addition to providing scaling and convenience options, there are other reasons to expand the use of
online instruction in adult education programs, including labor market, consumer, public service, and
assessment trends. Former Federal Communications Commission chairman, Julius Genachowski, said
recently that “over 80% of Fortune 500 companies post job openings exclusively online.” Over half of
today’s jobs require technology skills, and nearly 80% of jobs in the next decade are projected to require
digital skills” (Levere 2013). The Institute of Museum and Library Services’ Building Digital Communities
National Initiative (2012) reports that consumers with broadband access to the Internet at home can
save over $7000 a year using online coupons and discounts. Government services from federal and state
programs are increasingly relying on digital communication, online access, and automated deposits.
Most high-stakes testing, including high school equivalency assessments and assessments for industry-
recognized credentials, have computer-based or online components. Everyday skills such as checking

                                                                                                         5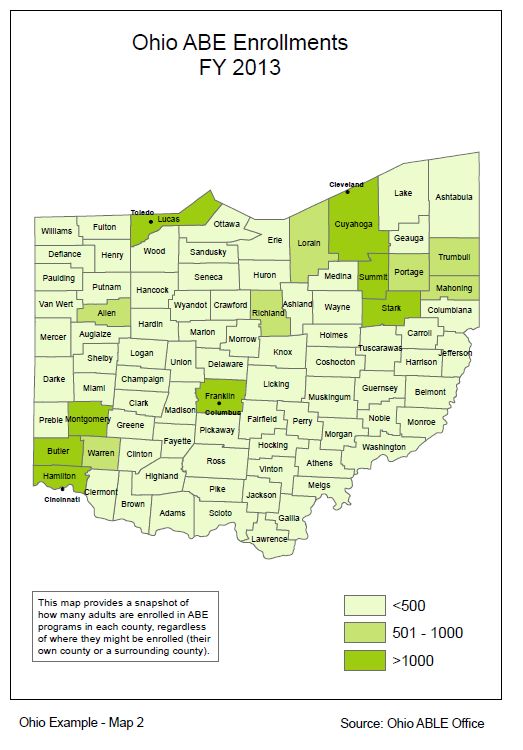
email, surfing the Web, searching for information, and checking credibility of claims will help prepare
adults for further education, training, employment, and citizenship.

Costs: Face-to-Face and Online
As online programming is introduced into adult education programs, administrators will want to know if
offering online options might cost more or less than face-to-face instruction. It is, therefore, helpful to
decouple the costs calculated for development and delivery in the two modes.
Often many of the costs associated with face-to-face development are overlooked. For example, how
does one accurately capture the costs of number of hours it took to develop the curriculum, build the
lesson plans and design the lecture notes, presentation slides, etc., or the value of the numerous
instructor or faculty meetings and approvals required before a course can be taught the first time?
When scaling programs, face-to-face instruction will significantly increase personnel and physical costs.
When considering online programs, content must either be developed or acquired, each having its own
advantages and disadvantages. Developing content most often has a higher up-front cost, such as those
associated with hiring instructional designers, reviewers, programmers and other web developers, and
over time may or may not prove to be less expensive to maintain. Acquiring or licensing online content
will likely include a cost per seat, annual licensing costs, maintenance, updates and upgrades. The Total
Cost of Ownership (TCO) is laid out in a toolkit produced by the Consortium for School Networking
(http://www.cosn.org/tco). Personnel costs for delivering online and hybrid courses can be minimized if
courses are developed in a way that maximizes the online portion of the course and minimizes the need
for live instructor interaction. For these reasons it’s often difficult to calculate any significant difference
in development costs between face-to-face and online instruction.
However, cost studies (Jung 2003; Robinson 2009) have reported that, when comparing the cost of face-
to-face instruction to online delivery, the costs of delivery of the instruction over time decreases
significantly with online instruction. Robinson (2009) looked at seven universities and compared the
delivery of face-to-face instruction on those campuses with online delivery by a separate institutional
unit. Keeping instructor costs the same (same number of instructors/faculty), the study concluded that
the online unit required significantly less funding – slightly less than half – to deliver the same amount of
instruction. The development and delivery of online content is often referred to as “develop once,
deliver many.”
Finally, in addition to saving money for the institution, online instruction can save money for the adult
learners. Attending face-to-face classes includes a range of student costs, such as transportation and
parking fees, lost wages, child-care costs, and so on. For many adults, these costs can prevent them
from enrolling or persisting in classes. Being able to access courses online from home, work, the local
library, or from one of the hundreds of American Job Centers (aka One Stops) can add to the
convenience appeal.

The Question of Access – Who’s Online?
There continues to be legitimate concern about the digital divide and how adult learners access the
Internet. But, current research tells us that the divide is narrowing, and that many more adults have

                                                                                                              6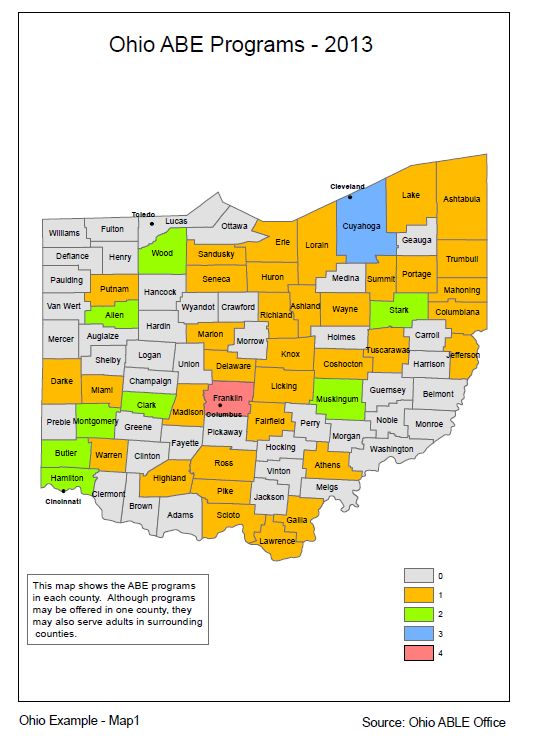
access than even five years ago, largely due to availability and broader usage of mobile devices (Brenner
and Rainie 2013). This section of the Index presents several data sets and trends that inform our
understanding of the changing capacity of communities and households to support online learning. The
section begins with the U.S. Census Bureau’s July 2011 Current Population Survey (CPS) Computer and
Internet Use Supplement to identify national household trends. Following that is a review of data
collected and reported by the Pew Research Center’s Internet and American Life Project, which tracks
the issue closely in smaller fast response surveys, looking especially at trends and subgroup behaviors.
According to the CPS 2011, 75.6% of households nationally reported having a computer in the home and
71.1% of households had high speed Internet access in the home (File2013). This is a significant increase
since the Bureau began asking about Internet access in 1997 (only 18% reported having high speed
access that year). In 2011, Hispanic and Black minorities reported that 58.3% and 56.9%, respectively,
had high speed Internet access in the home. While still a significant increase over time, these minorities
continue to represent the lowest race/ethnicity groups with home access. It is not surprising to note
that households with highly educated residents report higher rates of Internet use than those with
residents whose educational attainment is less than high school completion. The CPS reports that only
37% of adults without a high school diploma use the Internet. In addition, 56.7% of individuals living in
households earning less than $25,000 annually report having a computer in the home, and only 49.8%
report having Internet access in the home. The CPS also developed a “connectivity continuum” ranging
from no Internet use anywhere to Internet use both inside the home and elsewhere on multiple devices.
In the “no connectivity” end of the continuum were 35.6% of households making less than $25,000
annually and 44.9% of individuals without a high school diploma. Only 3.0% of the total population
access the Internet outside the home only and do not have a computer at home, and 15.9% do not
access the Internet anywhere and do not have a computer at home.
When it comes to Internet use in general (either at home or some other location), Pew reports that the
percentage of adults who are “online” has grown steadily from 14% in 1995 to 85% in 2013 (Zickuhr
2013). However, roughly four out of every ten Blacks, and almost half of the Hispanics or Latinos,
reported they did not use the Internet in 2011. In Digital Differences, Pew reports almost 80% of adults
are now online, with 70% of adults (18+) having a high-speed connection at home (Zickuhr and Smith
2012). However, some populations continue to lag in adoption, including minorities and adults in
households with lower incomes. Although 62% of adults in households earning less than $30,000 a year
are now online (up from 28% in 2000), only 43% of adults without a high school diploma are online (up
from 16% in 2000). Those two population characteristics (low income and low educational attainment),
combined with age (being 65 or older), are the strongest predictors for low Internet use.
Why are these adults not online? Cost is certainly part of the reason, and 19% of those surveyed for the
Pew Who’s Not Online and Why? report (Zickuhr 2013) indicated that price (of computers, upkeep, and
Internet service) was part of the barrier; however, this was no longer the primary reason as it had been
in Pew’s 2000 edition of the survey. In the 2013 survey, 34% cited lack of relevant content, 32% cited
reasons related to the perception that the Internet is not easy to use or maintain securely, and only 7%
cited lack of access or availability. The report concludes that 15% of American adults do not use the
Internet at all. Yet at the same time, as of a May 2013 Pew survey, approximately 91% of American

                                                                                                        7
adults have a cell phone, 56% have a smartphone, and 34% have a tablet computer. Unfortunately,
even with the increase in smartphone ownership, only 40% of those with less than a high school diploma
are accessing the Internet in any way (such as a home computer, outside computer, or mobile device).
Alternatives for Access
With a significant percentage of the adult education eligible population still unable to either access high-
speed Internet from the home or via a mobile device, where can they go to participate in online or
hybrid learning programs? This section presents existing and potential alternatives state and program
directors can consider as possible partners in bridging the access gap.
Public Libraries
Today there are over 16,500 public libraries in the U.S., including branch locations, and they play a
significant role in America’s Internet connectivity as well as in serving as sites of literacy and English
instruction. According to a comprehensive 2010 survey, (Becker, Crandall, Fisher, Kinney, Landry, and
Rocha 2010), over 77 million people, or nearly one-third of the U.S. population, ages 14 and older, used
a public library computer or wireless network to connect to the Internet in 2009. Of the millions of
library patrons, 44% of patrons who live in households living below the poverty line ($22,000 per year
for a family of four) visit a public library with the purpose of accessing the Internet. The report also cites
that 42% (estimated 32.5 million) of library computer users indicate that education is the reason they
are online, and 24% of those users reported taking online courses or working on online assignments.
Library Services in the Digital Age (Zickuhr, Rainie, and Purcell 2013) echoes the library study above,
stating that 77% of Americans ages 16 and older say that “free access to computers and the Internet is a
‘very important’ service of libraries.” The report estimates that 91% of this same population indicates
that the public libraries are important to their communities, and 76% feel the same way about the
importance of libraries to their families. However, even with this level of importance, only 22% of
Americans ages 16 and older say they know about the services the libraries provide, 46% say they know
a little, and 31% say they know very little or nothing at all.
However, looking at the capacity of libraries to meet the demands, the American Library Association’s
2012 report demonstrates that while public computer and Wi-Fi use increased at more than 60% of
public libraries, over 65% of those libraries report an insufficient number of public computers and 41.4%
report not having enough bandwidth. These are sobering numbers, especially when 62% report that
they provide the only free Internet access in their community. Furthermore, 70% of those libraries
providing the only free access in the community are in rural areas.
Community Anchor Institutions
Depending on location, Community Anchor Institutions (CAI), may provide members of the community
alternative access points. The National Telecommunications and Information Administration (NTIA), part
of the U.S. Department of Commerce, defines CAI’s as the schools, libraries, medical and healthcare
providers, public safety entities, community colleges and other institutions of higher education, and
other community support organizations and entities that have high-speed broadband access in a state
and/or county. Some CAIs allow public access to the Internet, while others do not. NTIA’s “National
8Broadband Map” (available at http://broadbandmap.gov/) allows users to “search, analyze and map”
broadband availability, and identify the 25 closest CAI’s based upon a specific address. According to
NTIA’s Exploring the Digital Nation (2013), over 90% of Americans live in areas where high-speed
Internet is available, [but] only seven in ten households used broadband at home by July 2011” ( ii).
American Job Centers, formerly known as One-Stop Career Centers, are funded by the U.S. Department
of Labor, and are an example of a CAI. They are operated by community colleges, employment service
offices, community-based organizations, and government agencies. The Centers provide free Internet
access to adults in communities across the nation for services ranging from employment and re-
employment assistance to educational opportunities. There are currently 2700 Centers in the United
States, including full service offices and satellite branches. Full service centers include resource rooms
that house computers and provide free access to the Internet. Many but not all satellite branch Centers
also include a resource room, although hours of operation may vary.
Initiatives for Home Internet Expansion
In addition to these physical locations, there are multiple national, state and local initiatives focused on
getting Americans online. One in particular, Everyone On (www.everyoneon.org), a partnership
between Connect to Compete and the Ad Council, is designed to “help motivate the millions of
Americans who do not have the digital literacy skills they need to succeed become connected and take
advantage of free digital literacy training in their communities.” Connect to Compete is a national non-
profit that aims to eliminate the digital divide by making high-speed, low-cost Internet, computers and
tablets, and free digital literacy training accessible to all unconnected Americans. Everyone On is a
three-year, multimedia, bilingual campaign that targets individuals who live in low socio-economic
households who have not been able to afford a computer or Internet access in the past.
OCTAE has entered a resource-sharing agreement with Everyone On to provide pre-qualified status for
the lowest cost deal in their locality to enrolled students, teachers, and programs through a unique hub
located at www.EveryoneOn.org/adulted. This bulk adoption of Everyone On services allows programs
and states to use common messaging to help students take full advantage of the opportunity to get
Internet access in their homes while also assisting programs to create hot spots of wireless connectivity
in classrooms on a flexible and portable basis. Teachers are encouraged to take advantage of the
opportunity as well, thus increasing their confidence with technology. Concurrently, programs that
teach digital literacy skills are strongly encouraged to update their contact information in America’s
Literacy Directory (https://www.literacydirectory.org/), which supplies contacts to the Everyone On
Locator Tool that assists Americans locate free digital training in their communities.
Another national initiative working on this challenge is Connected Nation (www.connectednation.org)
which provides extensive broadband planning services for communities and states, and ConnectED an
initiative which the Obama Administration hopes will “connect 99% of America’s students to the
Internet through high-speed broadband and high-speed wireless within 5 years.” Across the country,
states and municipalities have various broadband initiatives, all designed to bring the Internet to
schools, hospitals and other community organizations, as well as residents.
9The WOW (Who’s Online Where) Index
Increasing the amount of online instructional activity is one of the more efficient ways to reach more
adults with educational programming and of increasing adults’ engagement with learning, offering
unlimited opportunities for practice. However, there are many factors to consider before blanketing an
entire state with online or hybrid programs, or choosing to deliver only face-to-face instruction. The
WOW (Who’s Online Where) Index is designed to help state directors and others look at a number of
factors related to a need for adult education programs combined with the level of available Internet
access by county. The Index takes into account that directors are unable to assume that just because
broadband access is available in a county, that the households in that county are all online. (It should be
emphasized at this point that while the WOW Index takes many variables into account, it is still very
much a first iteration. The Office of Career, Technical, and Adult Education (OCTAE) fully expects that
the Index will be updated and refined over time, as the office receives feedback and suggestions from
users.)
Unfortunately, there aren’t any surveys or measurement tools available to determine exactly how many
households have broadband access to the Internet in a county, making this the most challenging factor
in the Index. Surveys like the U.S. Census Bureau’s Current Population Survey (CPS) and those
distributed by the Pew Internet & Family Life Project are not large enough to provide county level
individual data. For example, the Current Population Survey is administered monthly to approximately
54,000 households and has included an Internet and computer usage section (sponsored by NTIA) since
1997.
Staff at the Pew Research Center and NTIA agree, however, that it is possible to generate a reasonable
estimate of the number of households with broadband access by county by looking at two indicators: 1)
household income level and 2) adult educational attainment (Brenner and Lee 2013), both of which are
collected by the Census Bureau every ten years at the county level. According to the CPS, those
households with an income of $25,000 to $50,000 are most likely to have broadband access, and those
households earning $25,000 or less are most likely not to have broadband access. In addition,
households where the educational attainment of the adults (18 and over) is below a high school diploma
are also less likely to have broadband access at home.
The WOW Index considers these two indicators, along with several other elements (see below), and
produces a WOW Index Score that will help predict the level of accessibility to the Internet for adults in
a given county. The Score correlates with three possible intervention recommendations: Face-to-Face
(F), Hybrid (H), or Online (O). These recommendations are described further in the Methodology
section.
Another factor to consider when generating an estimate of how deep household broadband Internet
penetration is in a county is whether or not the county is identified as rural or urban. Estimates from
Pew and the CPS estimates range from 50%-62% of rural households had broadband access at home
compared to 70%-74% of households in urban communities. The WOW Index uses the percentages
provided by the CPS and adjusts for urbanicity by lowering the rural estimates by the percent difference
in urban and rural broadband use at the national level. The rural estimate was lowered by 12% and the
10urban estimate remained constant since the national level difference is 12%. The Office of Rural Health
Policy (ftp://ftp.hrsa.gov/ruralhealth/eligibility2005.pdf) has compiled a list of counties by state
designated as rural.
WOW Index Elements
The WOW Index elements are broken into two categories: Target Audience and Access. These elements
are each given a WOW Index value and then calculated for a WOW Index Score. All Index elements
must be converted to percentages and inserted into the WOW Index Worksheet. The final WOW Index
Score corresponds with the Intervention Recommendations to help state directors and others
determine where to implement and/or expand online or hybrid instructional programming.
Adult Education Eligible Population
A. Percentage of adults without a high school diploma by county currently not being served. The
most accurate place to extract estimates of eligible adults by county is from the 2007-2011
American Community Survey 5-Year Estimates through the U.S. Census Bureau American Fact
Finder. The number of adults currently enrolled is subtracted from the total to identify the gap
in service.
B. Percentage of households earning less than $25,000 annually by county. The most accurate
place to extract these estimates by county is from the 2007-2011 American Community Survey
5-Year Estimates through the U.S. Census Bureau American Fact Finder.
Usage and Access
C. Home Internet Usage. This percentage is closely tied to computer ownership in the home.
Compared to national figures, the adult education eligible population is roughly 30% less likely
to access the Internet from home. However, this figure can be higher or lower when adjusting
for urbanicity on individual counties (as done in the Ohio example).
D. Household Broadband Connectivity. Although no surveys collect broadband access data at the
county level for each state, by taking the total number of households (by county) and
multiplying by the percentage of broadband adoption, a good estimate can be generated.
Adjusting for urbanicity strengthens the estimate.
E. Public Libraries and Branches. In counties where household Internet access is limited, knowing
the number of public libraries (including branches) in the county is important. These libraries,
even those with limited hours, can provide adults with access to participate in online
instructional activities. In addition, many libraries house digital literacy and other adult
education modules on their computers. Library locations (by county) can be found on each
state’s public library website.
F. Community Anchor Institutions (CAIs) and American Job Centers. The National Broadband Map
(NBM) identifies the 25 CAIs closest to the county seat
(http://www.broadbandmap.gov/community-anchor-institutions). Full-Service locations have a
resource room where individuals can use the Internet and access educational programs at no
charge. Some satellite locations also provide this resource; however, for the WOW Index, only
Full-Service locations were identified and considered.
11Methodology
The methodology behind the WOW Index is the result of research and conversations related to the adult
education population, and the need to extend the reach of adult education programs across the country
through the use of technology. Most adult education state directors are familiar with their state’s
demographics and are aware of the need for more capacity to reach adults not yet enrolled. However,
with limited budgets, they need to know how many of these adults are online and where so they can
decide where to support more face-to-face instruction and where they should consider online and/or
hybrid instruction. The more specific the data, the more likely the decisions will be accurate. In order to
deliver a result that is as granular as possible, the WOW Index requires county-level data.
The target audience for the methodology was identified as adults (18+) who have not earned a high
school diploma, and adults who live in households where the annual income is less than $25,000. These
two data elements not only capture the primary characteristics of the adults who enroll in adult
education programs, but combined with age, they are the best predictors of whether or not there is
broadband Internet access in the home (another element of the Index). Fortunately, both of these
elements are included in the American Community Survey 3-year and 5-year estimates so they are
relatively easy to find.
The more challenging piece of the methodology is determining the overall level and type of access this
population has to the Internet. To do that, the Index includes four data elements:
1. Eligible adults’ Internet usage
2. Eligible households with broadband access
3. Number of public libraries and branches
4. Alternative access options
In addition, the adult education eligible adults’ Internet usage and eligible households with broadband
access are adjusted for urbanicity, since households in urban communities are more likely to have
broadband access than households in rural communities. (Note: The urbanicity was not calculated for
the households with annual income below $25,000, because applying the calculation to both elements
would be duplicative, since not having a high school diploma already correlates with households earning
less than $25,000.)
Each element in the WOW Index was given a value ranging from 5 to 25 points for a maximum total of
100 points (the WOW Index Score). Element values were weighted based on level of need for adult
education programming and the likelihood of the target audience to have convenient Internet access.
Within each element, categories were also weighted based on importance to the overall element. The
final WOW Index Score is the total points (out of 100) that correlate to three general intervention
recommendations: 1) increase the number of face-to-face programming options, 2) develop or increase
the availability of hybrid, or blended programming options, and 3) develop or increase fully online
programming options. The recommendations are not meant to be set in stone. Instead, they are
suggested to help state directors make data-driven strategic decisions about the best ways to extend
and supplement their programs. The Index should be considered one more tool in the planners’ tool
12box to operate their programs. As more state directors and others use the Index, percentages and
weights may need to be adjusted.
The full list of WOW Index elements, values, points and intervention recommendations can be found in
Appendix A. One of the challenges in developing the decision making WOW Index was that there is little
empirical data on how to most effectively make investment decisions in adult education relative to the
use of limited public dollars for face to face, hybrid, and fully online learning solutions. In addition,
there has not been any discussion in the policy or education research literature as to which public data
sets might contain the appropriate and relative data. To address these issues, a series of assumptions
guides the tool about the type of data that would be most useful, as well as how those data could be
used to inform decisions. These assumptions were based on expert opinions and data referenced in
relevant trade journals, blogs, and policy papers.
The sample WOW Index Worksheet for Ohio is included with this package, as well as a WOW Index
Worksheet (with formulas) that can be used by other states.
Example – Ohio
To demonstrate the usefulness of the WOW Index, one state (Ohio) was selected, and data was
collected and applied to the Index. OVAE appreciates that Jeffrey Gove, state director, and his staff
provided a wealth of information and data that allowed this example to be prepared. Ohio has already
made significant progress toward expanding its distance learning through additional online
opportunities. However, like any other state with limited resources, there has not been an in-depth
review of who is online and where across the state, making it difficult to determine where best to
increase technology-based programs. The spreadsheets and maps accompanying this document provide
an example of how a state could use the Index, and how it can visually represent the state’s Internet
access status with regard to current and future adult education programs. For Ohio, the WOW Index
will help the state director’s office make data-driven decisions regarding resources for future
programming to reach the 1,000,000+ adults still to be served across the state.
Thoughts, Conclusions and Recommendations
This document and the WOW Index are designed to serve as catalysts for further exploration of ways to
reach more adult learners and provide them with convenient programming. The increased use of online
instruction, whether fully online or hybrid, will allow programs to extend their reach significantly and
offer meaningful supplemental practice and digital literacy skills. Online courses and programs provide
convenience for adults, but they are only convenient if the adults can access them from home or from a
nearby location. The WOW Index provides a way to use data points for deciding how and where to add
online programming. As stated earlier, there is no current way to determine an exact number of
households that will have broadband access from the home. However, by using the indicators described
in the Index, administrators can get a fairly accurate estimate of who is online and where.
The WOW Index is not intended to be the only factor when considering an online approach. Program
planners should be familiar with current best practice in digital literacy instruction and incorporate the
findings into the development of their online programming. Adult learners will need a range of
supports, well-designed user interfaces, and content at the appropriate levels. In addition, planners
13must become familiar with what is considered to be quality in online and hybrid learning environments.
With this population in particular, interaction, engagement, and tech support will be critical to a
successful learning experience. Quality standards such as those described by the Sloan Consortium, the
Southern Regional Education Board, and Quality Matters™ can provide guidance in this area (see
Reference list).
In addition to using the WOW Index, program planners should consider where they currently fund
programs and where they have seen waiting lists. This information may help to reinforce the WOW
Index recommended intervention. For example, if a county appears to be ready to engage in online
programming, the fact that the county has a waiting list gives leadership a clearer indication of latent
interest. In addition, each state should look at longitudinal information that shows the proportion of
people served in the state over a given period of time. Are there areas where there is less access to
technology? Are there programs with instructors who are champions of online learning? Every state will
be different, and in some cases, every county will be different. To help program planners consider
possible options for delivering hybrid or online programming, four examples are provided in Appendix B.
In addition, Appendix C provides a summary chart listing the possible steps a state director would take
(including using the WOW Index) to determine where best to invest valuable financial and personnel
resources.
14Appendix A: WOW Index Elements (100 pts total) and Intervention
Recommendations
The weights and points below were designed as an example and may be adjusted over time or by states
and other users in order to get an accurate picture of the counties in their states.
ADULT EDUCATION ELIGIBLE POPULATION
A. Percentage of adults without high school diploma not currently enrolled (25 pts max)
o 20% - High: 25
B. Percentage of households with income below $25K (15 pts max)
o 25% - High: 15
USAGE AND ACCESS
C. Percentage of target adults Internet usage (based on HS and R/U) (20 pts max)
a. 35%+ - High: 20
D. Percentage of target households with broadband connectivity (based on HS and R/U) (25 pts
max)
a. 12% - High: 25
E. Number of Public Libraries and Branches as access options (10 pts max)
a. 12 – High: 10
F. Number of other access options (CAIs and American Job Centers) (5 pts max)
a. 20 – High: 5
INTERVENTION RECOMMENDATIONSAppendix B: Examples of Current Technology-Enabled and Online
Projects
Ohio’s Distance Education Hub – Centralizing Services for Wider Reach
The Ohio Board of Regents’ State Adult Basic Literacy Education (ABEL) program is now contracting with
the Kent State University’s Ohio Literacy Resource Center to function as the new statewide Distance
Education Hub. This is intended to help build all programs’ capacity to provide distance learning
opportunities for students, thus increasing their chances to successfully transition through ABLE to
postsecondary education/training and employment. In FY 2014, all ABLE programs are required to offer
a component of distance education (an exception may need to be made for the corrections facility
because of Internet access limitations). The Hub will provide distance education instruction to students
referred from local ABLE programs. In addition to increasing options for distance education students the
Hub has five primary goals in FY 2014:
1. Increase distance education teacher contact with students.
2. Increase distance education teacher contact with classroom teachers.
3. Improve accountability by increasing data collection and data entered into ABLELink.
4. Improve security and eliminate paper documentation by making student referrals process
through ohioable.org
5. Improve outcomes for students, including level completion and GED completion.
The Referring Partner and Distance Education Hub are partners in the referral and teaching/learning
process. Each has responsibilities for instruction, data management, and communication. In order to
understand the process of distance education, it is highly recommended that at least the program
administrator of each Referring Partner (RP) take Distance Education Basics, a self-directed Moodle
course available through the professional development system.
The Referring Partner (RP) will:
1. Intake the student and maintain all records, including all required ABLE and local forms.
2. Conduct ABLE Orientation, including initial assessment and goal-setting.
3. Enter the student into ABLELink.
4. Provide initial classroom instruction, if not immediately referring the student for distance
instruction.
5. Complete the Student Referral Form to refer the student for distance instruction.
6. Provide supplemental in-class instruction as needed and record all in-class instruction (only) into
ABLELink [the Hub will enter all distance hours on behalf of the Referral Partner].
7. Conduct all progress assessments.
8. Keep Distance Education Teacher apprised of any changes, including student achievement, exit,
or other areas that may impact the student’s instructional plan.
The Hub will:
1. Assign a primary Distance Education Teacher to work with students from each RP.
162. Ensure that the Distance Education Teacher is trained in the use of the approved software and
other instructional methods to be used with the RP’s students.
3. Receive the Student Referral form and notify the RP’s assigned Distance Education Teacher.
4. Communicate with Classroom Teacher, including initial contact and education progress.
5. Provide an orientation to distance education for the student.
6. Regularly communicate with and provide feedback to the student.
7. Provide all distance instruction through approved instructional methods.
8. Keep Classroom Teacher apprised of any changes, including student achievement, exit, or other
areas that may impact the student’s instructional plan.
9. Recommend progress assessments.
10. Recommend supplemental in-class instruction.
11. Enter all distance education hours into ABLELink weekly on behalf of the RP and provide RP with
a report of attendance hours entered.
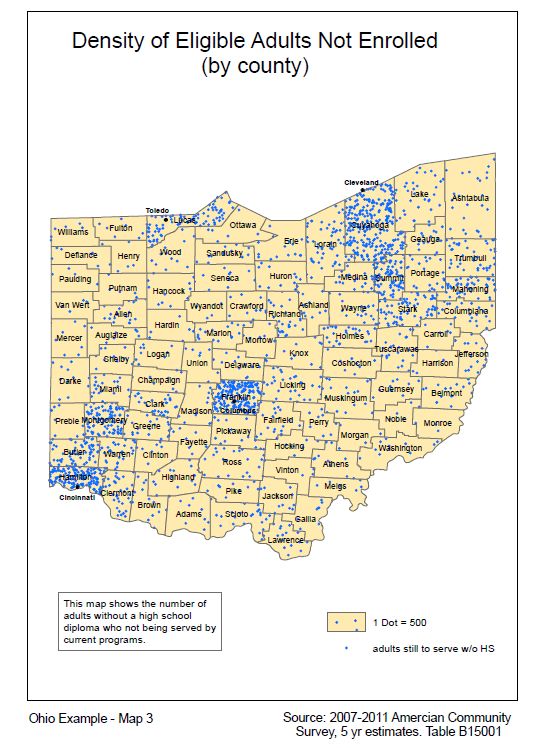
Corresponding Maps
The Ohio example includes a series of maps and the underlying data in a worksheet that provide visual
representations of several of the WOW Index Elements, as well as other interesting data points. The
final map represents the WOW Index Scores for each county.
1. Ohio Adult Education Programs. This is the number and location of current adult education
programs by county. The National Reporting System (NRS) provides the number of programs
offered by each state. The number and location of programs can be slightly misleading because
a program may serve the residents of multiple counties.
2. Ohio Adult Education Enrollments. This is the number of adults currently enrolled by county.
Knowing the residency of adults enrolled in programs provides a snapshot of how many adults
are being served in that county, regardless of where they might be accessing a program (their
own county or a surrounding county).
3. Density of Eligible Adults Not Enrolled (by county). This number is the difference between the
total number of adults without a high school diploma minus the number of adults being served
by current programs. Educational attainment estimates can be found on the American Fact
Finder website.
4. Density of Eligible Households with Broadband (by county). This is an estimate of the number of
households earning less than $25,000 annually that are likely to have home broadband access.
5. Public Libraries and Branches (by county). Libraries – even those with limited hours – can
provide adults with access they need to participate in online learning activities.
6. Density of Broadband and Libraries. This overlay of Maps 4 and 5 provides a visual
representation of the level of access potential adult learners will have in each county.
7. WOW Index Score Results. This map provides a look at which counties would be most suited to
expanding face-to-face learning opportunities, which ones would likely see success with hybrid
programming, and which ones might be best prepared to receive fully online programs.
1718
19
20
21
22
23
24
Corresponding Table of WOW Index Preliminary Calculations – Ohio
                                                                                                                                                                     CAIs and
                                                                Adults 18+  Adults 18+    Adults 18+ w/o    Adults 18+ w/o                                             Full-
                                   Total Adult    Total Adult     w/o HS      w/o HS      HS Households     HS Households        HH     Household                     Service
                          Adult     Pop (18+)      Pop (18+)     Internet    Internet     with Broadband    with Broadband     income     Income         Public      American
               Total       Pop       w/o HS         w/o HS        Usage       Usage        Connectivity       Connectivity
CAIs and
Adults 18+ Adults 18+ Adults 18+ w/o Adults 18+ w/o Full-
Total Adult Total Adult w/o HS w/o HS HS Households HS Households HH Household Service
Adult Pop (18+) Pop (18+) Internet Internet with Broadband with Broadband income Income Public American
Total Pop w/o HS w/o HS Usage Usage Connectivity ConnectivityCAIs and
Adults 18+ Adults 18+ Adults 18+ w/o Adults 18+ w/o Full-
Total Adult Total Adult w/o HS w/o HS HS Households HS Households HH Household Service
Adult Pop (18+) Pop (18+) Internet Internet with Broadband with Broadband income Income Public American
Total Pop w/o HS w/o HS Usage Usage Connectivity ConnectivityTable of WOW Index Preliminary Calculations – Ohio, How to Read this Chart
How to Read this Worksheet
Several assumptions were made in order to develop appropriate formulas for this Index. Future users
may need to make adjustments to percentages based on their own state demographics. Some of the
values may not need to be calculated here before using them in the actual WOW Index. The purpose of
including all of them here is to help the reader understand where the final calculations originated.
Total Households: Total number of households in each county. Data can be found on the U.S. Census
American FactFinder site (http://factfinder2.census.gov/
Adult Population (18+): Total number of adults over 18 in each county. Data can be found on the U.S.
Census American FactFinder site.
Total adult pop w/o HS (number): Total number of adults in each county who do not have a high school
diploma. Data can be found on the U.S. Census American FactFinder site.
Total adult pop w/o HS (percentage): Adult population w/o a high school diploma divided by the total
adult population. This is a necessary calculation because the WOW Index requires percentages.
Adults w/o HS - Internet Usage (numbers): Estimated number of adults without a high school diploma
who use the Internet. The estimate is calculated as the number of adults without a diploma multiplied
by 37% (the national percentage of adults without a diploma who use the Internet), which is then
adjusted for urbanicity by multiplying it by 12% (the estimated difference between rural and urban
households with that use the Internet).
Adults w/o HS - Internet Usage (percentage): Estimated percentage of adults without a high school
diploma who use the Internet. It is calculated by dividing the number of adults without a high school
diploma who use the Internet by the total adult population without a high school diploma. This is a
necessary calculation because the WOW Index requires percentages.
Adults w/o HS Households with Broadband Connectivity (numbers): Estimated number of adults
without a high school diploma in households with broadband connectivity. The estimate is calculated as
the number of adults without a diploma multiplied by 35% (the national percentage of adults without
diploma who have broadband connectivity at home), which is then adjusted for urbanicity by
multiplying it by 14% (the estimated difference between rural and urban households with broadband
service).
Adults w/o HS Households with Broadband Connectivity (percentage): Estimated percentage of adults
without a high school diploma in households with broadband connectivity. It is calculated by dividing
the number of adults without a high school diploma who have broadband connectivity into the total
number of households. This is a necessary calculation because the WOW Index requires percentages.
29Household Income
New York State Office for New Americans – ESOL Model
The New York State Office for New Americans (ONA) has created an infrastructure to help newcomers
meet the requirements being discussed as part of the anticipated federal comprehensive immigration
reform legislation. This support will help meet critical needs and assist newcomers to fully embrace the
opportunities provided as they pursue U.S. citizenship and maximize their full potential.
The cornerstone of this integration effort is a network of 27 neighborhood-based ONA Opportunity
Centers located throughout New York within existing culturally competent, language-accessible
community-based organizations. The $6 million ONA Opportunity Center project helps New Americans
learn English, prepares them for the U.S. citizenship exam, helps them start and grow businesses and
helps eligible young people apply for Deferred Action for Childhood Arrivals (DACA). Each ONA
Opportunity Center combines trained professionals, community volunteers and technology to help
newcomers. Neighbors volunteer their time to help their new neighbors become part of the community.
The ONA model for English for Speakers of Other Languages (ESOL) training blends the use of trained
teachers, community volunteers, and in-class use of a computer or tablet device for access to the free
ESOL learning software, USA Learns (www.usalearns.org). Volunteers not only help clients navigate the
USA Learns site, they also engage clients in conversations related to the content of each USA Learns
lesson. This conversation/practice portion of each lesson can be conducted one-on-one, or in small
groups. A staff supervisor or certified teacher may be in the classroom to observe or provide guidance
to the tutor/client during these sessions. It is believed that a cumulative 200 hours of USA Learns and
conversation practice should produce demonstrable advancement. Each of the 27 ONA Opportunity
Centers provides at least 200 hours of ESOL instruction to more than 200 Limited English Proficiency
clients per year, thereby dramatically expanding new Americans’ access to English language instruction
in New York.
Student assessments and post-testing should be accomplished with the acceptable standard assessment
instruments. These are: the Test of Adult Basic Education (TABE), version 9-10; the BEST Plus (computer
or print-based); and/or the BEST Literacy. Using the teacher + USA Learns + volunteer model, the
student will complete an additional USA Learns intake exam to assess where in the program the student
will begin. At the end of each cycle, the students are given a post-test using the acceptable standard
assessment instruments.

                                                                                                      31
Arizona’s Flipped Classroom Project
In 2011, the Arizona Department of Education, Adult Education Services (ADE/AES) launched a new
program that would give selected adult education providers “an opportunity to transform, on a small
scale, how adult education is delivered to learners.” Called the Transforming Education through
Technology Pilot, three counties were selected to pilot a “flipped classroom” model over the next two
years. The program’s goals are to 1) build capacity, 2) accelerate learning, and 3) foster independent
learning. There were several anticipated outcomes, including capture of effective strategies for large-
scale replication.
The pilot program included the use of PLATO learning software for instruction. Students were expected
to work online with PLATO approximately 10 hours per week, and meet once a week face-to-face where
teachers supported the skill development learned on PLATO. Teachers did not lecture, but instead
focused on helping students fine-tune their skills and follow up on any issues the students were having.
For this pilot, the state gave each program $50,000, most of which was used to purchase laptops and
tablets that were loaned to the students (note that out of 120 computers almost all were returned). The
biggest challenge was the shift in culture for the teachers. They have a saying for this program: “You’re
not the tour guide. You’re the travel agent.”
Arizona currently has 19,000 students in their ABE/ASE/ESL programs. As a result of the pilot project,
they are starting to roll out the program across the state this fall. Their goal is to add 8,000 more
students this year.
32You can also read