Woking Town Centre Housing Market Analysis - Appendix 5
←
→
Page content transcription
If your browser does not render page correctly, please read the page content below
Appendix 5

Woking Town Centre
Housing Market Analysis
Woking Borough Council

November 2019

Prepared by

GL Hearn
65 Gresham Street
London EC2V 7NQ

T +44 (0)20 7851 4900
glhearn.com

Confidential
Quality Standards Control

The signatories below verify that this document has been prepared in accordance with our quality control
requirements. These procedures do not affect the content and views expressed by the originator.

This document must only be treated as a draft unless it is has been signed by the Originators and approved
by a Business or Associate Director.

DATE                      ORIGINATORS                                    APPROVED
28th   October 2019       Ivan Tennant                                   Paul McColgan

                          Associate Planning Director                    Planning Director

Limitations
This document has been prepared for the stated objective and should not be used for any other purpose
without the prior written authority of GL Hearn; we accept no responsibility or liability for the consequences of
this document being used for a purpose other than for which it was commissioned.
Woking Town Centre Housing Market Analysis, November 2019
Woking Borough Council
Contents
Section Page
1. EXECUTIVE SUMMARY 5
2. METHODOLOGY 12
3. MARKET STRENGTH 14
4. MARKET SIGNALS 29
5. THE ABSORPTION RATE 39
6. WHAT TRAJECTORY IS ACHIEVABLE? 51
List of Figures
FIGURE 1: WOKING TOWN CENTRE DATA GEOGRAPHY 12
FIGURE 2: CHANGE IN HOUSEHOLD NUMBERS, 2014–39, WOKING BOROUGH 22
FIGURE 3: AVERAGE HOUSEHOLD SIZE, WOKING BOROUGH 2014-39 22
FIGURE 4: AGE STRUCTURE, WOKING BOROUGH, 2001 23
FIGURE 5: AGE STRUCTURE, WOKING BOROUGH, 2011 23
FIGURE 6: SIZES OF HOME BASED ON CHANGE IN HOUSEHOLD TYPE, WOKING
BOROUGH 26
FIGURE 7: MEDIAN RENTS 31
FIGURE 8: LOWER QUARTILE RENTS 32
FIGURE 9: RENTS AND INFLATION (CONSUMER PRICE INDEX) EXPRESSED
AS A INDEX (BASE DATE SEPTEMBER 2011) 33
FIGURE 10: RATIO OF MEDIAN HOUSE PRICES TO GROSS ANNUAL
WORKPLACE-BASED EARNINGS (MEDIAN) 1997-2018 34
FIGURE 11: RATIO OF MEDIAN HOUSE PRICES TO GROSS ANNUAL
RESIDENCE-BASED EARNINGS (MEDIAN) 2002-2018 ERROR! BOOKMARK NOT
DEFINED.
FIGURE 12: MAP OF COMMUTING FLOWS 35
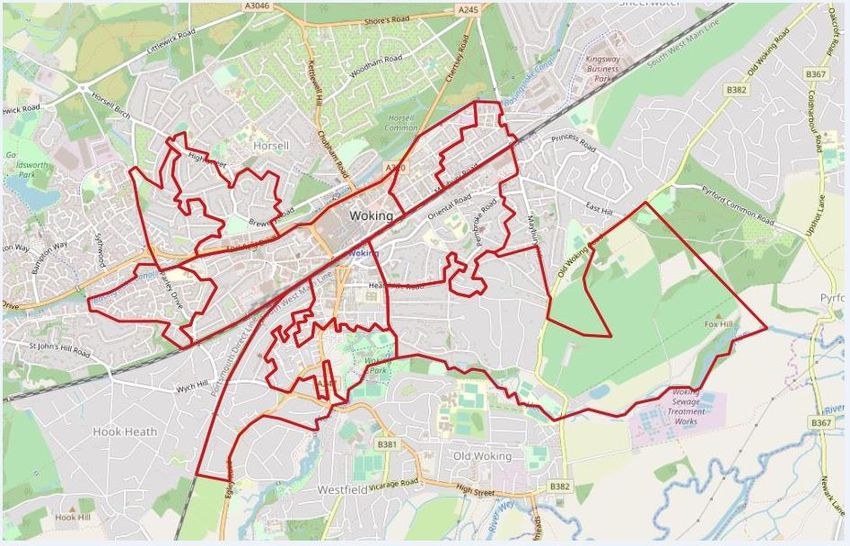
FIGURE 13: AVERAGE ANNUAL BUILD RATE BY SITE SIZE 41
FIGURE 14: PREVIOUS LAND USE BY SIZE AND AVERAGE ANNUAL BUILD OUT RATE 42
GL Hearn Page 3 of 61
J:\Planning\Job Files\J041392 - Woking BC - Housing Market Analysis\Reports\Woking Market Analysis_Final_Version.docx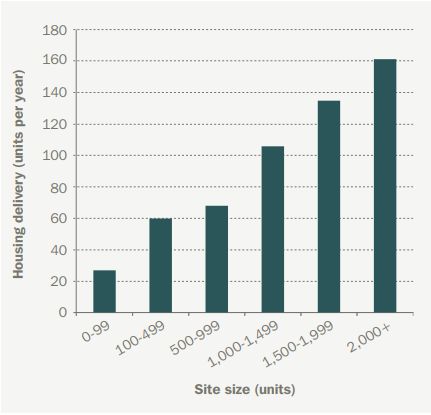
Woking Town Centre Housing Market Analysis, November 2019
Woking Borough Council

FIGURE 15:               CUMULATIVE BUILD OUT RATES BASED ON THE WOKING TOWN
                         CENTRE SITE DEVELOPMENT SCHEDULE                                                                 51

List of Tables

TABLE 1:                 TYPES OF DWELLINGS DELIVERED BETWEEN 2001 AND 2011                                               15

TABLE 2:                 SIZES OF DWELLINGS DELIVERED BETWEEN 2001 AND 2011                                               17

TABLE 3:                 SUPPLY OF DWELLINGS IN WOKING BOROUGH 2011/12 – 2018/19                                          18

TABLE 4:                 SUPPLY OF DWELLINGS IN WOKING BY LOCATION 2012/13– 2016/17                                       19

TABLE 5:                 CHANGE IN TENURE OF DWELLINGS 2001-11                                                            20

TABLE 6:                 NEW HOMES IN THE BOROUGH OF WOKING, TENURE SPLIT                                                 21

TABLE 7:                 FORECAST CHANGE TO POPULATION AGE STRUCTURE, WOKING BOROUGH24

TABLE 8:                 HOUSEHOLD COMPOSITION, WOKING BOROUGH, WOKING TOWN CENTRE AND
ENGLAND                  25

TABLE 9:                 CHANGE IN HOUSEHOLD COMPOSITION, WOKING BOROUGH 2014-39                                          26

TABLE 10:                CHANGE IN HOUSE PRICES, 1998-2018                                                                30

TABLE 11:                KEY COMMUTING RELATIONSHIPS                                                                      36

TABLE 12:                LEAD-IN TIMES AND BUILD OUT RATES                                                                40

TABLE 13:                OPTIMAL AVERAGE SALES RATES: BROWNFIELD                                                          43

TABLE 14:                10 YEAR DELIVERY SCHEDULE                                                                        52

TABLE 15:                15 YEAR DELIVERY SCHEDULE                                                                        52

TABLE 16:                COMPARABLE TOWN CENTRE AREAS                                                                     53

TABLE 17:                TENURE SPLIT WITHIN COMPARABLE TOWN CENTRE AREAS                                                 55

TABLE 18:                TRAJECTORY FOR MARKET AND AFFORDABLE SALE DWELLINGS]                                             58

TABLE 19:                TRAJECTORY FOR MARKET RENT AND AFFORDABLE RENT DWELLINGS                                         60

GL Hearn                                                                                                                Page 4 of 61
J:\Planning\Job Files\J041392 - Woking BC - Housing Market Analysis\Reports\Woking Market Analysis_Final_Version.docx
Woking Town Centre Housing Market Analysis, November 2019
Woking Borough Council
1. EXECUTIVE SUMMARY
Purpose
1.1 The purpose of the report is to assess the likely demand for dwellings in Woking Town Centre (WTC).
This is in order to form a view on whether the proposed trajectory and build out rates (BORs), as set
out in Woking Town Centre Site Development Schedule (WTCSDS) is achievable.
1.2 In market dwellings (for-sale or build-to-rent), BORs are determined by Absorption Rates (ARs), which
in turn will be determined by developers' commercial view. Specifically their view on the rate at which
new units of housing may be fed into the local market in alignment to their business model.
1.3 In the preparation of this report, GL Hearn has assembled and reviewed the following data sources:
• Demographic data (Census, sub-national household projections);
• Reports and studies (relevant reports commissioned on behalf of Woking Borough Council or
developers operating in WTC);
• Interviews with market sale and letting agents operating in WTC;
• Case studies from other major town centre development projects (Croydon, Stratford and
Wembley); and
• Reference to authoritative studies into BORs and ARs.
Key Messages
1.4 In order to arrive at an understanding of potential ARs within a mixed tenure town centre development
of the scale and complexity of WTC, it is necessary to disaggregate the proposed supply into different
tenures: market sale, market rent and affordable housing.
1.5 We do not feel that the current completions trajectory of the market sale component i.e. to finish by
Q1 2025/6 (as set out in the WTDSDS) is realistic, particularly in current market conditions. These
conditions are likely to persist for the foreseeable future given the uncertainty generated by Brexit.
As a result we believe expected completion should be pushed back to Q4 of 2030.
1.6 The average quarterly AR for market sale dwellings is 15. We believe this could increase but is subject
to a cap of 45 dwellings per quarter as developers reduce BORs to avoid excess supply placing
downward pressure on sales prices i.e. flooding the market.
GL Hearn Page 5 of 61
J:\Planning\Job Files\J041392 - Woking BC - Housing Market Analysis\Reports\Woking Market Analysis_Final_Version.docxWoking Town Centre Housing Market Analysis, November 2019
Woking Borough Council
1.7 The trajectory for the Market Rent and Affordable Rent component is more achievable. We see no
market reason why this aspect of the WTC development should not be deliverable within the time-
frame set out in the WTCSDS.
1.8 For this reason we have adopted the blended average of 28 dwellings per month for market rent
development. This is drawn from Knight Frank’s study for the Victoria Square development in WTC.
Summary of Evidence
1.9 In forming a judgement as to the likely AR, an understanding of the different tenures envisaged is
critical. For this reason we have broken the projected AR into the three tenure types of
• Market Sale;
• Market Rent (Private Rented Sector, PRS); and
• Affordable Housing
Market Sale
Baseline Absorption Rate
1.10 Based on the evidence gathered herein it is reasonable to assume a baseline figure of between 50
and 70 dwellings per annum (dpa) to be achieved on each of the market sale developments on the
WTC sites.
Adjusted Absorption Rate
1.11 The task in this section is to consider whether particular circumstances exist that support an
adjustment to the baseline AR. This considers three factors:
i. Demographic and market signals evidence
1.12 WTC has become an established centre of growth in the Borough (and wider HMA) since 2001, and
has seen delivery of smaller homes, suited to newly forming households and people wishing to down-
size. It has also yielded a large share of the Affordable Housing delivery in the Borough.
1.13 Given the Council has not been able to achieve its policy targets for Affordable Housing at the
Borough level, this reinforces the case for additional development within the town centre which will
help support further affordable housing delivery.
1.14 The data from the 2014-based household projections supports the case for maintaining a strong
supply of new homes in coming years. This reflects both the overall growth within the projections and
the declining household growth.
GL Hearn Page 6 of 61
J:\Planning\Job Files\J041392 - Woking BC - Housing Market Analysis\Reports\Woking Market Analysis_Final_Version.docxWoking Town Centre Housing Market Analysis, November 2019
Woking Borough Council
1.15 Given that smaller, one person and single couple households are forecast to account for a large
proportion of overall household growth, it is not unreasonable for a substantial proportion of
development to focus on smaller dwellings suited to their needs. WTC represents one of the most
suitable and sustainable areas in the Borough to do so.
1.16 Market signals collectively make a strong argument for substantially more development in WTC in
future years. Both increasing rents as well as worsening affordability are particularly telling.
1.17 Woking is well integrated with London, and displays the hallmarks of a dynamic local economy
providing the resident workforce access to a wide range of jobs across a diversified economic base.
1.18 However, according to the Woking Economic Development Strategy 2017-2022 (WEDS) one brake
on local economic development is the shortage of affordable market and social housing in the
Borough.
ii. Commentary from local agents
1.19 In order to understand current market conditions, GL Hearn approached sales agents in WTC and
surrounds. Two agents were able to respond, Agent 1 and Agent 2. A summary of their responses
are set out below.
1.20 The feedback from the estate agents is downbeat; the consensus is that there is an over-supply of
dwellings and this has exerted a downward pressure on house prices since 2016. This is partly
explained by weak demand for buy-to-let dwellings from small investors due to the withdrawal of tax
relief on mortgage payments.
1.21 The commentary from Agent 1 is helpful in terms of sales rates. The agent signalled a decline since
the top of the market in 2013 where Barratt’s New Central scheme achieved up-to 4 units per week.
By comparison, the current market has a rate of 1-2 dwellings per week or around 70 dpa.
iii. Competitor behaviour
1.22 Developers pay close attention to the activities of other developers bringing forward sites in close
proximity to their own. The presence therefore of a number of developers releasing product into the
market at the same time will have a dampening effect on the overall AR.
Market Rent
1.23 In arriving at an AR for Market Rent (Private Rented Sector) dwellings, three factors have been taken
into consideration:
GL Hearn Page 7 of 61
J:\Planning\Job Files\J041392 - Woking BC - Housing Market Analysis\Reports\Woking Market Analysis_Final_Version.docxWoking Town Centre Housing Market Analysis, November 2019
Woking Borough Council
iv. Demographic and market signals evidence
1.24 We have seen that rents in WTC have increased over time; it has been noted that increasing the
stock of dwellings has a more direct impact on rent levels than on the price of market sale dwellings.
This is because the latter is affected by borrowing rates and investor sentiment.
1.25 Indeed, rent increases across the UK over the last twenty years have been very modest in comparison
to house price. Increases to the housing stock over the same period has been identified as a reason
for this.1 This creates a strong argument for delivery of additional high-quality PRS homes so as to
rein-in recent rent increases.
1.26 Given the sentiment reported by local estate agents of small investor towards buy-to-let the right
profile of PRS would be specialist build-to-rent developers backed by institutional finance.
1.27 In addition, the importance of PRS in housing people on average incomes who are unable to buy (or
choose not to) is clear from the substantial local and national increase in the number of PRS dwellings
between 2001 and 2011.
v. Commentary from local agents
1.28 GL Hearn carried out semi-structured interviews with two local letting agents. In addition, we draw on
a letter by Seymours to Woking Borough Council, dated 8th January 2019.
1.29 There is a consensus as to the strength of the lettings market. In the context of the views expressed
by the sales agents, this illustrates the counter-cyclical nature of the market sale and PRS markets.
1.30 It is to be expected and encouraged that institutional investors will take an active interest in the PRS
market in WTC. This should provide developers seeking to bring forward, fully or in part, Build-to-
Rent development over the next decade with confidence that there will be a market for their products.
1.31 The prospect for increasing rents in the market is very modest, with agents factoring in the level of
supply envisaged for WTC, which they foresee as having a stabilising effect on rents.
1.32 Importantly, they do not foresee a fall in rents; this will reassure developers that their viability
modelling is unlikely to be compromised by the envisaged pipeline of supply. Indeed, given the
importance of housing in the continued growth of the local economy, developers may have taken the
view that new development will, in part, generate its own demand.
1Mulheirn, I, UK Collaborative Centre for Housing Evidence, Tackling the UK Housing crisis: is supply the
answer, August 2019, page 18
GL Hearn Page 8 of 61
J:\Planning\Job Files\J041392 - Woking BC - Housing Market Analysis\Reports\Woking Market Analysis_Final_Version.docxWoking Town Centre Housing Market Analysis, November 2019
Woking Borough Council
vi. Victoria Square
1.33 In determining an AR for PRS specifically, it is worth noting Knight Frank's report 2 into the Victoria
Square development published in March 2016; this foresees:
"Tower 1 (216) units being handed over at the end of July 2020...with a prospective pre-
let of 35-50 units in the period May to July 2020...We would anticipate May through to
October to have the highest take-up rates, with around 25-30 properties each month.
An expectation of 15-25 properties per month reflects the slightly quieter period
between February and April, and around 15-20 per month during the quietest period of
the year between November and January. This provides a blended average of
approximately 28 move-ins per month over the initial let-up period. (our emphasis)
We expect that the initial letting-up period to be between 17-18 months for both blocks
including the pre-let periods and phased release.”
1.34 This “blended average” has been used as the basis for the AR for Market Rent dwellings in this report.
Affordable Housing
1.35 Given the affordability issues across the Borough, including the Town Centre, there is likely to be a
high demand for affordable Housing.
1.36 As we have noted, WTC has seen a substantial number of affordable units coming forward over the
period 2001-18. WTC’s suitability as a location for households on lower incomes stems from its
proximity to public transport (with the resulting reduced need to own or run a car) and lower energy
bills associated with living in terraced and flatted developments rather than detached and semi-
detached properties.
1.37 In addition, WTC has a natural acceptance to the provision of dwellings for people on modest incomes.
This serves to highlight the importance of bringing forward development in this part of the Borough.
Case studies
1.38 As part of preparing this study, GL Hearn has also reviewed recent development activity in the
comparable high growth areas of Croydon, Stratford (Olympic Park) and Wembley. These areas have
been selected on the basis of the rapid scale of growth and their connectivity to Central London.
1.39 These locations are frequently cited as part of London's evolution into a polycentric spatial plan, with
these sites (in particular Croydon and Stratford) as key growth nodes. This is not dissimilar from
Woking’s economic development vision3.
2 Knight Frank, Victoria Square, Woking, March 2016, page 12, 14
3 Woking Economic Development Strategy, 2017-2022, page 3
GL Hearn Page 9 of 61
J:\Planning\Job Files\J041392 - Woking BC - Housing Market Analysis\Reports\Woking Market Analysis_Final_Version.docxWoking Town Centre Housing Market Analysis, November 2019
Woking Borough Council
1.40 Like Woking, they have high workplace-based Median Affordability Ratios (MAR), varying from 11.13
to 16.3, suggesting they have similar affordability pressures. Each of them has seen delivery of a
substantial number of dwellings in recent years.
1.41 This provides evidence that, given the right balance of size and tenure of homes, as well as the timely
provision of supporting infrastructure, a high AR is achievable in WTC.
1.42 The case studies therefore offer substantial evidence that tenure diversity, in particular the presence
of a substantial element of PRS housing, contributes to higher ARs on the basis that different tenures
appeal to different market segments.
What trajectory is envisaged and achievable?
Market Sale
1.43 Based on the evidence gathered, it is reasonable to assume a baseline figure of between 50 and 70
dpa to be achieved on each of the market sale developments on the 13 WTC sites. This level of
absorption would have the combined capacity of 650 to 910 dpa.
1.44 The findings from the market signals analysis are supportive of on-going development; However, they
are not sufficiently strong to warrant applying an uplift (i.e. increasing the AR above the 50-70 dpa
range). This is because similar conditions applied in earlier years during which housing delivery in
WTC was substantially lower than is envisaged in the WTCSDS.
1.45 However, the suitability of WTC to satisfy the demand for affordable market homes and the role of
increasing supply in dampening rental growth justifies continued development. It is reasonable to
assume WTC can achieve an AR comparable to similar areas within London.
1.46 The comment from Agent 1 provides helpful supporting evidence that over a ten-year time frame 70
units per year (2 sales per week) would be achievable. This corroborates other evidence cited in this
report.
1.47 Taking this into consideration, but adopting a cautious approach given current market uncertainty, a
“mid-point” AR of 60dpa has been selected.
1.48 However, to allow for competitor activity a cap of 45 new homes being released in to the market at
any one quarter (a maximum of three developments producing units across any one quarter) has
been assumed. This envisages circumstances in which developers are aware of competitors active
in the market, and reduce their BOR accordingly to avoid over-supply.
GL Hearn Page 10 of 61
J:\Planning\Job Files\J041392 - Woking BC - Housing Market Analysis\Reports\Woking Market Analysis_Final_Version.docxWoking Town Centre Housing Market Analysis, November 2019
Woking Borough Council
1.49 We have calculated ARs for both Market Sale and Affordable Sale dwellings based on a quarterly
BOR of 15, or 60dpa. The Affordable Sale component of the WTC development envisages Shared
Ownership (SO).
1.50 We recognise this tenure has been criticised on affordability grounds. In addition, while SO has seen
growth in Woking during the 2001-11 period, it is still a relatively new (and unproven) tenure. For
these reasons, we therefore feel it is reasonable to accord it the same AR as full Market Sale.
1.51 Our trajectory (see concluding chapter) indicates that, in our view, the BORs envisaged for Market
Sale homes in the WTCSDS, which anticipates completion of this component in the first quarter of
the 2025/26 financial year (around June 2025) is not likely to be achievable.
1.52 In contrast, we anticipate a more plausible time horizon for completion is the fourth quarter of the
2027/28 financial year (around March 2028). This is almost three years longer than first anticipated.
1.53 This calculation also includes a cap of 45 dwellings per year by way of assuming the “excess”
dwellings built during the 2021/22 and 2022/23 financial years will be absorbed by the market when
delivery falls below the 45 dpa.
Market Rent
1.54 The strong, on-going demand from households for PRS supports delivery of this tenure of housing at
pace. This will also have the effect of keeping rents stable, allowing household income to catch up,
thus restoring affordability at the median income level.
1.55 Our assumptions for PRS reflect the trajectory set out in the WTCSDS. No cap has been applied as
we feel the market for PRS is sufficiently strong in WTC to support multiple schemes generating units
at the same time.
1.56 The trajectory envisaged for Affordable Rent dwellings is driven more by factors relating to
construction timetables and the BOR of market homes, rather than the strength of demand for such
products, given that demand is likely to exceed supply for this tenure of home.
GL Hearn Page 11 of 61
J:\Planning\Job Files\J041392 - Woking BC - Housing Market Analysis\Reports\Woking Market Analysis_Final_Version.docxWoking Town Centre Housing Market Analysis, November 2019
Woking Borough Council
2. METHODOLOGY
2.1 As a first step, we analyse demographic trends and the current housing stock to assess whether there
exists any evidence of a mis-alignment between supply and demand. This provides a baseline
position regarding the likely need for additional dwellings in WTC.
2.2 The next step assesses, with reference to market signals, whether any trends justify an uplift to the
initial baseline. Bringing the first two steps together enables an assessment of the current strength of
the market for dwellings in WTC.
2.3 The third part of the study presents findings from a literature review, interviews with property agents
and relevant case studies to set a reasonable benchmark for an Absorption Rate for development in
WTC. This is broken down by the different tenures: market sale, market rent and affordable homes.
2.4 The evidence assembled in the three stages of work allows us to arrive at an estimate of what
trajectory is achievable in WTC.
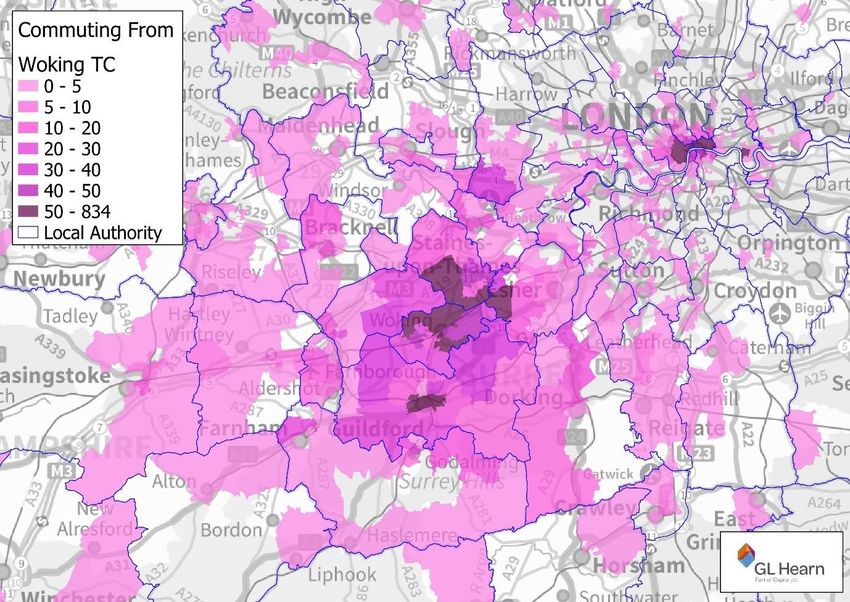
2.5 In compiling demographic evidence for this report, we have drawn on Census data for the town centre
based on a series of Lower Super Output Areas (LSOAs, see Figure below). For comparison
purposes looked at comparable data for Woking borough and England as a whole.
Figure 1: Woking Town Centre data geography
Source: Census 2011
GL Hearn Page 12 of 61
J:\Planning\Job Files\J041392 - Woking BC - Housing Market Analysis\Reports\Woking Market Analysis_Final_Version.docxWoking Town Centre Housing Market Analysis, November 2019
Woking Borough Council
2.6 To examine forecasts of demographic change, the 2014-based sub-national household projections
have been used. This aligns the work with the standard method for assessing housing need.
2.7 To arrive at an understanding of the demand for dwellings, it is important to note WTC exists within a
wider Housing Market Area (HMA) 4. This study has therefore taken into consideration this HMA as
well as the commuting relationships with locations where WTC residents’ work-places cluster as of
2011.
4The 2015 SHMA identifies a “core West Surrey Housing Market Area (HMA)…which comprises the local
authorities of Guildford, Waverley and Woking, page 32
GL Hearn Page 13 of 61
J:\Planning\Job Files\J041392 - Woking BC - Housing Market Analysis\Reports\Woking Market Analysis_Final_Version.docxWoking Town Centre Housing Market Analysis, November 2019
Woking Borough Council
3. MARKET STRENGTH
3.1 An appropriate place to start assessing the potential strength of demand for dwellings in WTC is to
compare the current housing stock and demographic trends. This will potentially identify any mis-
alignments between supply and demand.
Housing stock
3.2 In Table 3 below we present data relating to the housing stock in WTC showing change between
2001 and 2011 (the period between the last two Censuses); the same data is shown for Woking
Borough and England for the purposes of comparison.
3.3 This data indicates WTC accounted for the majority of flatted development in the Borough over the
period, and a substantial share of all development.
3.4 Over the period, WTC saw 1,242 new flats built in purpose-build blocks, or a 54% uplift. This
compares with the Borough as a whole of 32%, or 2,109 new flats.
GL Hearn Page 14 of 61
J:\Planning\Job Files\J041392 - Woking BC - Housing Market Analysis\Reports\Woking Market Analysis_Final_Version.docxWoking Town Centre Housing Market Analysis, November 2019
Woking Borough Council
Table 1: Types of dwellings delivered between 2001 and 2011
Woking Town
Type Woking England
Centre
2001 2,012 12,618 4786456
2011 2,025 12,709 5128552
Detached
Change 13 91 342,096
% 1% 1% 7%
2001 1,187 9,443 6713183
2011 1,268 9,872 7076395
Semi-detached
Change 81 429 363,212
% 7% 5% 5%
2001 1,315 7,708 5494033
2011 1,304 7,922 5642969
Terraced (including end-terrace)
Change -11 214 148,936
% -1% 3% 3%
2001 2,296 6,580 2967790
Purpose-built block of flats or 2011 3,538 8,689 3854451
tenement Change 1,242 2,109 886,661
% 54% 32% 30%
2001 422 1,043 968266
Flat as part of a converted or 2011 378 919 984284
shared house (including bed-sits) Change -44 -124 16,018
% -10% -12% 2%
2001 157 416 244179
2011 164 448 257218
Flat in a commercial building
Change 7 32 13,039
% 4% 8% 5%
2001 9 135 88918
Caravan or other mobile or 2011 7 132 100228
temporary structure Change -2 -3 11,310
% -22% -2% 13%
Total 1,286 2,748 1,781,272
Source: Census 2001 and 2011
3.5 In terms of net new homes, the Borough saw 2,748 new dwellings over the period, of which 47%, or
1,286 were delivered in WTC.
GL Hearn Page 15 of 61
J:\Planning\Job Files\J041392 - Woking BC - Housing Market Analysis\Reports\Woking Market Analysis_Final_Version.docxWoking Town Centre Housing Market Analysis, November 2019
Woking Borough Council
3.6 The table below presents data relating to the supply of dwellings delivered in WTC, the Borough and
England broken down to number of habitable rooms. The definition of a room in this context does
not include bathrooms, toilets, halls or landings, or rooms that can only be used for storage. All other
rooms, for example, kitchens, living rooms, bedrooms, utility rooms, studies and conservatories are
counted.5 In the section that follows, ‘dwelling sizes’ are assumed to translate as follows:
• 1 room = bedsit
• 2 rooms = flat/house with one bedroom and a reception room/kitchen
• 3 rooms = flat/house 1 or 2 bedrooms and one reception room and/or kitchen
• 4 rooms = flat/house with 2 bedrooms, one reception room and one kitchen
• 5 rooms = flat/house with 3 bedrooms, one reception room and one kitchen
• 6 rooms = house with 2 bedrooms and 2 reception rooms and a kitchen, or 3 bedrooms and one
reception room and a kitchen
• 7+ rooms = house with 3, 4 or more bedrooms
5 https://www.nomisweb.co.uk/census/2011/qs407ew
GL Hearn Page 16 of 61
J:\Planning\Job Files\J041392 - Woking BC - Housing Market Analysis\Reports\Woking Market Analysis_Final_Version.docxWoking Town Centre Housing Market Analysis, November 2019
Woking Borough Council
Table 2: Sizes of dwellings delivered between 2001 and 2011
Woking Town Woking
Rooms England
Centre Borough
2001 7,086 36,941 20,451,427
All 2011 8,308 39,467 22,063,368
Change 17% 7% 8%
2001 140 329 181,503
1 room 2011 128 230 172,008
Change -9% -30% -5%
2001 495 1,126 516,355
2 rooms 2011 689 1,315 641,307
Change 39% 17% 24%
2001 1,083 3,763 1,880,512
3 rooms 2011 1,504 4,459 2,264,602
Change 39% 18% 20%
2001 1,343 6,136 4,084,712
4 rooms 2011 1,768 6,857 4,227,236
Change 32% 12% 3%
2001 1,219 8,612 5,547,813
5 rooms 2011 1,246 8,208 5,446,830
Change 2% -5% -2%
2001 1,034 6,454 4,187,159
6 rooms 2011 1,017 6,509 4,275,834
Change -2% 1% 2%
2001 646 3,877 1,886,797
7 rooms 2011 663 4,033 2,223,733
Change 3% 4% 18%
2001 1,126 6,644 2,166,576
8 rooms + 2011 1,293 7,856 2,811,818
Change 15% 18% 30%
Source: Census 2001 and 2011
3.7 From this data we can see that there has been a fall in the number of bedsits between 2001 and 2011,
but a substantial increase in the number of smaller dwellings of 2, 3, 4 habitable rooms (dwellings of
1 and 2 bedrooms) in the town centre as well as the wider Borough.
3.8 The increase in smaller dwellings has been particularly pronounced in the town centre with 1,040 net
new dwellings of this size coming into existence over the period in WTC. This compares with 1,606
dwellings in the Borough as a whole, comprising 65% of the total.
GL Hearn Page 17 of 61
J:\Planning\Job Files\J041392 - Woking BC - Housing Market Analysis\Reports\Woking Market Analysis_Final_Version.docxWoking Town Centre Housing Market Analysis, November 2019
Woking Borough Council
3.9 This reinforces the importance of WTC as a centre of development activity in the Borough, particularly
in the delivery of smaller, more affordable, market dwellings.
3.10 It is also worth noting the growth in the number of the largest size of dwelling (+8 rooms) over the
same period. A total of 1,212 new dwellings of this size came into existence within the Borough, of
which 167 were in WTC. This likely reflects both the presence of a significant number of wealthy
households, a key group in supporting the economic growth of the area, and houses in multiple
occupation.
3.11 In addition, Woking Borough Council has supplied data showing the delivery of new housing in the
Borough by bedroom size between 2011/12 and 2018/19. This is set out in the table below. It is worth
noting that at 1,498 dwellings 1- and 2-bedroom homes also make up the majority (67%) of these
new dwellings.
Table 3: Supply of dwellings in Woking Borough 2011/12 – 2018/19
Year Total net Bedsit 1-bed 2-beds 3-beds 4+ beds
2011-12 188
supply 0 110 34 19 24
2012/13 273 0 39 210 17 6
2013/14 370 0 148 172 26 24
2014/15 66 0 13 22 18 13
2015/16 360 0 41 125 107 87
2016/17 399 0 120 92 116 71
2017/18 345 0 108 94 67 80
2018/19 231 0 66 113 19 33
Total 2,232 0 645 853 389 348
Percentage 29% 38% 17% 16%
Source: WBC
of supply
3.12 Assuming the distribution of delivery of these dwellings remains the same as during the 2001-11
period (65% in WTC) then around 974 dwellings would have been completed in WTC. This would
equate to an annual rate of 139 dwellings (rounded).
3.13 In the table below we set out data from WBC’s annual monitoring report (AMR); this document records
dwellings delivered in each financial year by location. It is important to note the fluctuations in delivery
of dwellings in WTC from year to year.
3.14 This shows that in the years 2012/13 and 2013/14 the rate of delivery of new homes in WTC was
relatively high with an average rate of 182 dwelling per annum (dpa). In subsequent years the rate
reduced dramatically to a three-year average of just 17dpa.
GL Hearn Page 18 of 61
J:\Planning\Job Files\J041392 - Woking BC - Housing Market Analysis\Reports\Woking Market Analysis_Final_Version.docxWoking Town Centre Housing Market Analysis, November 2019
Woking Borough Council
Table 4: Supply of dwellings in Woking by Location 2012/13– 2016/17
Area 12/13 13/14 14/15 15/16 16/17 Average
Woking Town Centre 123 241 5 19 27 83
Woking Borough 273 370 66 360 399 294
Local Plan target 292 292 292 292 292
Source: WBC Annual Monitoring Reports 12/13 – 16/17
3.15 Based on the average rate of completions in the 2001 – 2018 period, it is reasonable to express the
achievable AR based on historic data of between 83 and 139 dwellings per annum.
Change in Tenure
3.16 In Table 7 below we reproduce Census data relating to the change in the distribution of tenures within
WTC, the Borough as a whole and England. This data shows there has been a fall in the number of
households that own their property with a mortgage; this indicates the increasingly unaffordable
nature of properties in WTC or the lack of access to mortgage products. This trend is also observed
in the Borough as well as at the national level.
3.17 Those tenures that have seen the strongest increase over the period are Shared Ownership (albeit
starting from a low base), dwellings rented from a housing association or registered social landlord
(indicating WBC have been successful in delivering substantial numbers of Affordable Homes over
the period) and Private Rented Housing (PRS).
3.18 The number of households living in the PRS in WTC grew over the 2001-2011 period by 1,283. In
percentage terms this level of growth is the same as the Borough as a whole of 97%. It is worth noting
that the number of households occupying PRS dwellings in the Borough grew by 3,049 over the
period. Indicating that the town centre area accounted for 42% of all PRS growth in the Borough.
3.19 It is also worth noting WTC accounts for 35% of the growth in the number of households occupying
Affordable Housing units in the Borough, despite accounting for only 21% of all households. This
suggests WTC is shouldering a disproportionately large number of affordable homes.
GL Hearn Page 19 of 61
J:\Planning\Job Files\J041392 - Woking BC - Housing Market Analysis\Reports\Woking Market Analysis_Final_Version.docxWoking Town Centre Housing Market Analysis, November 2019
Woking Borough Council
Table 5: Change in tenure of dwellings 2001-11
Woking
Woking
Tenure Town England
Borough
Centre
2001 7,088 36,941 20,451,427
All households 2011 8,308 39,467 22,063,368
change 17% 7% 8%
2001 5,011 28,060 13,920,429
Owned 2011 4,892 27,829 13,975,024
% -2% -1% 0%
2001 2,096 11,092 5,969,670
Owned: Owned outright 2011 2,275 12,479 6,745,584
change 9% 13% 13%
2001 2,915 16,968 7,950,759
Owned: Owned with a
2011 2,617 15,350 7,229,440
mortgage or loan
change -10% -10% -9%
2001 30 343 133,693
Shared ownership (part
2011 82 368 173,760
owned and part rented)
change 173% 7% 30%
Social rented: Rented 2001 329 3,374 2,702,482
from council (Local 2011 337 3,308 2,079,778
Authority) change 2% -2% -23%
Rented from a housing 2001 215 1,158 1,238,246
association/registered 2011 298 1,396 1,823,772
social landlord change 39% 21% 47%
2001 1,321 3,137 1,798,864
Private rented 2011 2,604 6,186 3,715,924
change 97% 97% 107%
Source: Census 2001 and 2011
3.20 This reaffirms the suitability of the town centre as a location for additional Affordable Housing units;
this is likely to be on account of the mixed demographic, the proximity to public transport and the
scale of development envisaged.
3.21 In the table below we set out how the supply of dwellings at the Borough level splits into market and
Affordable Housing. This demonstrates that affordable housing has comprised 17% of delivery. The
Council’s current policy is to achieve 35% delivery of affordable housing on qualifying schemes.
GL Hearn Page 20 of 61
J:\Planning\Job Files\J041392 - Woking BC - Housing Market Analysis\Reports\Woking Market Analysis_Final_Version.docxWoking Town Centre Housing Market Analysis, November 2019
Woking Borough Council
Therefore, delivery has been skewed towards smaller schemes or not achieving the desired levels of
affordable housing.
Table 6: New Homes in the Borough of Woking, tenure split
Supply of dwellings Tenure split
Year Total net supply Market Affordable
2011/12 188 166 22
2012/13 273 259 14
2013/14 370 355 15
2014/15 66 61 5
2015/16 360 258 102
2016/17 399 233 166
2017/18 345 312 33
2018/19 231 199 32
Total 2232 1843 389
% 83% 17%
Source: WBC Monitoring
3.22 Given the town centre’s suitability to the provision of dwellings within reach of people on modest
incomes, this serves to highlight the importance of bringing forward development in this part of the
Borough.
Components of demand
3.23 This section of the report reviews the trends in key components that inform demand i.e. household
growth, average household size, age structure and household composition. As previously noted, the
demand for dwellings in WTC extends beyond the geography of the town centre itself; indeed, in
policy terms, the new homes built in the town centre are meant to satisfy demand at the Borough
level. For this reason, data at the Borough geography is presented in this section of the study.
Household Growth
3.24 Figure 2 below presents the forecast growth in households between 2014 and 2039. This shows a
very substantial growth from 39,778 in 2014 to 47,440 in 2039, an increase of 19% or 7,662
households.
GL Hearn Page 21 of 61
J:\Planning\Job Files\J041392 - Woking BC - Housing Market Analysis\Reports\Woking Market Analysis_Final_Version.docxWoking Town Centre Housing Market Analysis, November 2019
Woking Borough Council
Figure 2: Change in household numbers, 2014–39, Woking Borough
50000
Number of households
48000
46000
44000
42000
40000
38000
36000
34000
2014 2019 2024 2027 2030 2035 2039
Year
Source: MHCLG, 2014-based sub-national household projections
Average Household Size
3.25 The increase in household numbers is accompanied by a substantial reduction in household size
over the same period, falling from 2.48 to 2.34 persons. This will have the effect of requiring additional
dwellings to house the same number of people than in previous years as well as housing the
additional population.
Figure 3: Average Household Size, Woking Borough 2014-39
2.5
Average Household Size
2.45
(persons)
2.4
2.35
2.3
2.25
2014 2019 2024 2029 2034 2039
Year
Source: MHCLG, 2014-based sub-national household projections
3.26 The growth in households together with declining household sizes in Woking Borough reinforces the
case for maintaining a strong supply of new homes in coming years. This would include the smaller
homes suitable for higher density development in WTC.
GL Hearn Page 22 of 61
J:\Planning\Job Files\J041392 - Woking BC - Housing Market Analysis\Reports\Woking Market Analysis_Final_Version.docxWoking Town Centre Housing Market Analysis, November 2019
Woking Borough Council
Age Structure
3.27 Figures 4 and 5 present the change in the age structure in WTC together with Woking Borough and
England. The data shows that WTC possesses a higher proportion of the population that falls into the
25-44 age group than the other two geographies (exceeding the proportion this group represents in
the wider Borough by 8%).
Figure 4: Age Structure, Woking Borough, 2001
Age Structure 2001
40%
30%
20%
10%
0%
Ages 0 to Ages 16 toAges 25 toAges 45 toAges 65 to Ages 85 +
15 24 44 64 84
Woking Borough Woking Town Centre England
Source: Census 2001
3.28 In addition, between 2001 and 2011, this group grew from 35% of the town centre population to 38%
in 2011. In contrast, the wider Borough has a larger proportion of older households, in particular those
aged 65 and above.
Figure 5: Age Structure, Woking Borough, 2011
Age Structure 2011
50%
40%
30%
20%
10%
0%
Ages 0 to Ages 16 Ages 25 Ages 45 Ages 65 Ages 85 +
15 to 24 to 44 to 64 to 84
Woking Borough Woking Town Centre England
Source: Census 2011
GL Hearn Page 23 of 61
J:\Planning\Job Files\J041392 - Woking BC - Housing Market Analysis\Reports\Woking Market Analysis_Final_Version.docxWoking Town Centre Housing Market Analysis, November 2019
Woking Borough Council
3.29 The table below presents data drawn from the 2014-based household projections setting out the
forecast change in the age structure of those nominated as head of a household (Household
Representatives) in Woking Borough between 2014 and 2039.
Table 7: Forecast change to population age structure, Woking Borough
2014 2039
All HR % HR %
Under 25 717 2% 659 1%
25-34 5,427 14% 4,827 10%
35-44 8,850 22% 8,253 17%
45-54 8,189 21% 8,581 18%
55-64 6,388 16% 8,727 18%
65-74 5,005 13% 6,720 14%
75-84 3,622 9% 5,963 13%
85+ 1,580 4% 3,711 8%
Source: 2014-based household projections
3.30 The data indicates an increase in the proportion of all households headed by a person aged 65 and
above. The number of these households is forecast to increase to 16,394 over the period, or 61%
(rounded). In addition, the number of households headed by a person aged between 25 and 34 is
forecast to fall by 600 households, or 4% (rounded).
3.31 These trends reflect both the ageing population as well as the difficulty of younger age groups
establishing independent households in the context of worsening affordability. However as presented
previously WTC is well suited to supply smaller affordable market homes. Homes of this size are
likely to appeal to younger households as well as an older population seeking to down-size.
3.32 The table below presents data showing how household composition changed between 2001 to 2011.
This shows that one-person households have increased in the town centre area by 29%. In contrast,
the wider Borough has seen almost no growth. This growth has been concentrated in those below
retirement age.
GL Hearn Page 24 of 61
J:\Planning\Job Files\J041392 - Woking BC - Housing Market Analysis\Reports\Woking Market Analysis_Final_Version.docxWoking Town Centre Housing Market Analysis, November 2019
Woking Borough Council
Table 8: Household composition, Woking Borough, Woking Town Centre and England
Household
Woking Borough Woking Town Centre England
Composition
2001 2011 Change 2001 2011 Change Change
All categories:
Household 36,941 39,467 7% 6,195 8,308 34% 8%
composition
One-person household
10,449 10,499 0% 2,107 2,717 29% 8%
(OPH)
OPH: Aged +65 4,776 4,501 -6% 871 938 8% -7%
OPH: Other 5,673 5,998 6% 1,236 1,779 44% 23%
One family household
24,230 25,747 6% 3,621 4,689 29% 5%
(OFO)
OFO All aged +65 3,162 3,114 -2% 466 465 0% -2%
OFO: Couple: No
5,119 5,153 1% 781 1,038 33% 2%
children
OFO: couple:
8,033 8,430 5% 1,200 1,541 28% -6%
Dependent children
OFO: Couple: All non-
2,140 2,389 12% 286 350 22% 1%
dependent children
OFO: Cohabiting couple:
2,172 2,267 4% 469 655 40% 20%
No children
OFO: Cohabiting couple:
805 1,243 54% 88 181 106% 35%
Dependent children
OFO: Cohabiting couple:
Non-dependent 85 216 154% 6 24 300% 64%
Children
OFO: Lone parent:
1,705 1,801 6% 204 255 25% 20%
Dependent children
OFO: Lone parent: Non-
1,009 1,134 12% 121 180 49% 23%
dependent children
Other household types 2,262 3,221 42% 467 902 93% 29%
Source: Census 2001 and 2011
3.33 A mix of family households increased in WTC between 2001 and 2011. Couples without children
(married and co-habiting) are the single largest group, indicating the presence of younger age groups.
GL Hearn Page 25 of 61
J:\Planning\Job Files\J041392 - Woking BC - Housing Market Analysis\Reports\Woking Market Analysis_Final_Version.docxWoking Town Centre Housing Market Analysis, November 2019
Woking Borough Council
Future Household Growth
3.34 In the table below we identify projected change in household types in Woking Borough over the period
to 2039. This draws on the 2014-based household projections to align with the standard method for
housing need.
3.35 The table indicates that a substantial number of new households will be one person and single couple
households. In contrast, the overall proportion including a dependent child falling over the period
from 33% to 30%.
Table 9: Change in Household Composition, Woking Borough 2014-39
2014 2039
% %
One person 10,259 26% 11,586 24%
Couple and no other adult 10,402 26% 12,352 26%
Couple and one or more other adult 3,471 9% 5,531 12%
Households with dependent children 13,137 33% 14,346 30%
Other 2,510 6% 3,625 8%
Total 39,779 100% 47,440 100%
Source: MHCLG, 2014-based household projections
3.36 While household composition is a weak predictor of demand for sizes of market homes given that
households can buy dwellings of any size if they can afford to do so, it is nevertheless worth noting
that these trends point towards the provision of dwellings of certain sizes. The figure below illustrates
the broad size of home based on the change in households, indicating a broadly even split between
smaller and family dwellings, with 15% catering to other household types, such as houses in multiple
occupation.
Figure 6: Broad Sizes of home based on change in household type, Woking Borough
GL Hearn Page 26 of 61
J:\Planning\Job Files\J041392 - Woking BC - Housing Market Analysis\Reports\Woking Market Analysis_Final_Version.docxWoking Town Centre Housing Market Analysis, Conclusions
Woking Borough Council
15%
43%
43%
Smaller Family Other
Source: MHCLG, 2014-based household projections
3.37 In order to avoid overcrowding, it is sufficient for a household of 1-2 people to live in a dwelling of not
more than two bedrooms. Given the growth in one person and couple households are forecast to
account for a large proportion of overall growth over the period, it is not unreasonable for a substantial
proportion of development to focus on dwellings suited to their needs. WTC represents one of the
most sustainable areas in the Borough to do so.
Conclusions
3.38 Bringing the evidence in this section together, there a strong economic case exists for the continued
delivery of housing in WTC and an important conceptual base-line for arriving at an Absorption Rate.
Supply
• Of the 2,748 new homes that were delivered in the Borough between 2001 and 2011, 47% (1,286
dwellings), were delivered in the town centre.
• With 1,242 new flats being delivered between 2001 and 2011 WTC has been the focus
development of this type in the Borough in recent years. This reinforces the validity of focussing
additional supply in WTC.
• WTC plays a particularly important role in the supply of smaller 1- and 2-bedroom dwellings. The
area accounted for 65% of total supply of these sizes of home in the Borough.
• The number of households living in the PRS in WTC grew over the 2001-2011 period by 1,283, or
97%. This accounted for 42% of PRS growth in the Borough as a whole.
GL Hearn Page 27 of 61
J:\Planning\Job Files\J041392 - Woking BC - Housing Market Analysis\Reports\Woking Market Analysis_Final_Version.docxWoking Town Centre Housing Market Analysis, Conclusions
Woking Borough Council
• Considering the rate of delivery of new homes in WTC between 2001 and 2018, it is possible to
arrive at a practical Absorption Rate of between 83 and 139 dpa.
• While delivery in WTC in the financial years 2012/13 and 2014/15 is above trend at 182 dpa, the
three subsequent years saw a substantial fall to a three-year average of 17 dpa.
• WTC accounts for a high share of the affordable housing, indicating the suitability of the town
centre as a location for additional affordable housing units.
• Given the suitability of WTC to the provision of dwellings within reach of people on modest incomes,
the lack of new affordable units reinforces the importance of bringing forward development in WTC.
Components of demand
• The number of households in the Borough is projected to increase substantially between 2014
and 2039 by 7,662 households. This growth coupled with declining household sizes reinforces the
case for maintaining a strong supply of new homes in coming years.
• The growth in one person and couple households is forecast to account for a large proportion of
overall growth over the period. It is therefore not unreasonable for a substantial proportion of
development to focus on dwellings suited to their needs.
• This would require a growth in smaller 1- and 2- bedroom homes best suited for higher density
development. WTC represents one of the most sustainable areas in the Borough to do so.
• WTC appears to be well-suited to addressing the housing needs of growing market segments in
including older households and newly forming households. This is due to its track-record in the
practical delivery of smaller dwellings sited close to community and transport infrastructure.
GL Hearn Page 28 of 61
J:\Planning\Job Files\J041392 - Woking BC - Housing Market Analysis\Reports\Woking Market Analysis_Final_Version.docxWoking Town Centre Housing Market Analysis, Conclusions
Woking Borough Council
4. MARKET SIGNALS
4.1 In the previous section we considered the evidence of supply of dwellings and demand coming from
demographic trends. This assessed whether the economic fundamentals exist to support
development at the pace as envisaged in the Woking Town Centre Site Development Schedule
(WTCDS).
4.2 This section of the report considers a range of “market signals” that examines whether demand is or
is likely to be in excess of supply. These are:
• House prices;
• Rents;
• Affordability; and
• Jobs growth
House prices
4.3 House price change provides an indication of whether the supply of housing has been sufficient to
meet demand for market sale dwellings. Where house prices have seen a sustained increase over
time, this would suggest an imbalance between supply and demand, prompting an increase in supply.
4.4 However, it is important to note/caveat that the substantial increases in house prices in the South
East can, in part, be explained by demand from institutional or private investors for buy to let
properties. This in itself has been bolstered by historically low interest rates. For these reasons,
increasing the supply of housing may only have a weak impact on house prices.
4.5 Furthermore, in delivering additional housing it is therefore important to be aware that these
conditions may change. In the event of such a change, this may precipitate a fall in prices and a
perception of over-supply of housing.
4.6 Nevertheless, the delivery of additional homes may help constrain housing costs, both market and
rents, and also provide a means of addressing misalignments in supply, for example the need for
smaller dwelling to facilitate down-sizing.
4.7 The table below sets out house price change at 5 yearly intervals from 1995. This shows the very
substantial increase in prices across all geographies presented in the table. The cumulative increase
over 20 years of 271.4% in Woking is broadly in line with the South East, but exceeds the Surrey and
the England average (27.4% and 45.2% respectively).
GL Hearn Page 29 of 61
J:\Planning\Job Files\J041392 - Woking BC - Housing Market Analysis\Reports\Woking Market Analysis_Final_Version.docxWoking Town Centre Housing Market Analysis, Conclusions
Woking Borough Council
Table 10: Change in house prices, 1998-2018
5 years 10 years 15 years 20 years
2018 Change Annual Change Annual Change Annual Change Annual
change change change change
Woking £390,000 30.0% 5.4% 56.0% 4.5% 105.3% 4.9% 271.4% 7.4%
Surrey £430,000 28.7% 5.2% 50.9% 4.2% 100.0% 4.7% 244.0% 6.9%
South East £313,000 28.4% 5.1% 42.3% 3.6% 95.6% 4.6% 264.0% 7.2%
England £230,000 17.9% 3.4% 32.9% 2.9% 78.3% 3.9% 226.2% 6.6%
Source: Land Registry Price Paid data
4.8 The same can also be said for the more recent trend (5 and 10 year) where the house price growth
in Woking has been faster than wider comparators.
4.9 Taken at face value, this suggests a significant under-supply of dwellings across all these
geographies and may be accepted as a market signal that supports the delivery of additional homes.
Rents
4.10 Rents, as an alternative indicator to housing costs are a good indication of the cost of housing given
that the price paid is not influenced by factors such as the cost of borrowing (the need to service
mortgage debt) and the investment potential of a dwelling as an asset.
4.11 For this reason, trends in rents are arguably a better indicator of whether the supply and demand for
housing are in balance. Moreover, in bringing forward development at the pace envisaged in the
WTCDS it will require a mix of tenures, within which build-to-rent dwellings are likely to play a part.
4.12 The figure below presents trends in rents for Woking Borough, Surrey, the South East and England.
From this data, it is apparent that median rents in the Borough are closely correlated with Surrey as
a whole. However, they are also substantially above median rents for the regional and national levels,
indicating the cost of property in Woking is relatively high.
4.13 Since 2011, median rents have increased in Woking Borough from around £950 per calendar month
(pcm) to around £1,140 pcm, an increase of 20%. While this growth is modest over a 7-year period
(averaging around 2.8% each year), it has nevertheless had the effect of stretching affordability in the
Borough (this is considered in the context of the Consumer Price Index later in this report).
4.14 This topic will be considered in more detail later in this report, but based on a median full time pay for
individual workers of £30,4046, the PRS is not comfortably affordable to median income households.
6 Annual survey of hours and earnings (ASHE) 2019 data
GL Hearn Page 30 of 61
J:\Planning\Job Files\J041392 - Woking BC - Housing Market Analysis\Reports\Woking Market Analysis_Final_Version.docxWoking Town Centre Housing Market Analysis, Conclusions
Woking Borough Council
If we accept the assumption that the cost of housing should not exceed 37% of household income.7
At a rent of £1,140, the income threshold for median PRS accommodation would be around £38,000.
Figure 7: Median rents
£1,250
£1,150
£1,050
£950
£850
£750
£650
£550
£450
£350
Mar-12
Mar-13
Mar-14
Mar-15
Mar-16
Mar-17
Mar-18
Dec-11
Dec-12
Dec-13
Dec-14
Dec-15
Dec-16
Dec-17
Sep-11
Jun-12
Sep-12
Jun-13
Sep-13
Jun-14
Sep-14
Jun-15
Sep-15
Jun-16
Sep-16
Jun-17
Sep-17
Jun-18
Sep-18
Woking Surrey South East England
Source: Valuation Office Agency
4.15 The figure below sets out data for Lower Quartile PRS dwellings in Woking Borough and comparators
from 2011 to 2018. Rents for this type of home have increased in Woking more steeply over the
period than PRS priced at the median, from £750pcm to £950pcm, an increase of 27% (rounded).
4.16 This suggests there is very little PRS stock that is affordable to even half of all households (those
below the median). Applying GL Hearn’s rent affordability calculator would suggest at £950 and no
more than 35% of household income spent on housing then this would require an income of around
£32,500.
4.17 In the absence of subsidised housing, such households will face a dilemma of either living in a smaller
home or living with someone in a shared household or somewhere else, one that may be more distant
from their place of work.
7 GL Hearn has developed an assessment of income thresholds that relate to different levels of rent. The lower the rent, the lower the
percentage of income it should absorb, on the basis that households likely to occupy such housing will need to retain the lion's share of
their income to cover other essentials and leave some disposable income.
GL Hearn Page 31 of 61
J:\Planning\Job Files\J041392 - Woking BC - Housing Market Analysis\Reports\Woking Market Analysis_Final_Version.docxWoking Town Centre Housing Market Analysis, Conclusions
Woking Borough Council
Figure 8: Lower Quartile rents
£1,050
£950
£850
£750
£650
£550
£450
£350
Mar-12
Mar-13
Mar-14
Mar-15
Mar-16
Mar-17
Mar-18
Dec-11
Dec-12
Dec-13
Dec-14
Dec-15
Dec-16
Dec-17
Sep-11
Sep-14
Jun-12
Sep-12
Jun-13
Sep-13
Jun-14
Jun-15
Sep-15
Jun-16
Sep-16
Jun-17
Sep-17
Jun-18
Sep-18
Woking Surrey South East England
Source: Valuation Office Agency
4.18 In order to explore the affordability of PRS in more detail, it is worth reviewing the relative change in
the cost of housing against inflation. In the figure below we present trends in two measures of inflation,
the overall Consumer Price Index (CPI) and the CPI with all but the cost of energy extracted. These
provide an indication of the real growth in prices and the subsequent pressure on household budgets
as a result.
4.19 The Figure shows housing costs have risen more steeply than inflation. In the case of Woking
Borough, median rents have increased by around 20% from September 2011 while the overall CPI
grew by around 13%.
4.20 This suggests that housing costs will account for a larger proportion of household expenditure in
September 2018 compared with 7 years previously. It also emphasises the need to monitor housing
costs and adopt policies that support the principle that a substantial proportion of household incomes
should be reserved for non-housing costs.
GL Hearn Page 32 of 61
J:\Planning\Job Files\J041392 - Woking BC - Housing Market Analysis\Reports\Woking Market Analysis_Final_Version.docxWoking Town Centre Housing Market Analysis, Conclusions
Woking Borough Council
Figure 9: Rents and inflation (Consumer Price Index) expressed as an index (base date
September 2011)
1.35
1.30
1.25
1.20
1.15
1.10
1.05
1.00
0.95
0.90
Mar-12
Mar-13
Mar-14
Mar-15
Mar-16
Mar-17
Mar-18
Sep-11
Dec-11
Sep-12
Dec-12
Sep-13
Dec-13
Sep-14
Dec-14
Sep-15
Dec-15
Sep-16
Dec-16
Sep-17
Dec-17
Jun-18
Sep-18
Jun-12
Jun-13
Jun-14
Jun-15
Jun-16
Jun-17
Woking Surrey South East England Consumer Price Index - Overall
Source: VOA
Affordability ratios
4.21 The figure below presents data on the workplace-based Median Affordability Ratio (MAR) for Woking
Borough, the county and regional and national geographies since 1997. This provides an indication
of the affordability of market purchase dwellings based on the salaries of individual people working in
these geographies.
4.22 The relatively steep gradient of the trend line for Woking and Surrey illustrates the worsening
affordability. This overall level in Woking also demonstrates the boroughs relative unaffordability
compared to these wider areas.
4.23 Recent improvements to affordability mean that the borough is more affordable than Surrey. The
MAR reached a peak in 2015 of 13.24 in Woking Borough, before falling back to 11.78 in 2018.
Woking has historically relied to some degree on the investment and buy-to-let market; as a result of
national policy shifts, the market in Woking (and in WTC particularly) has weakened in recent years.
GL Hearn Page 33 of 61
J:\Planning\Job Files\J041392 - Woking BC - Housing Market Analysis\Reports\Woking Market Analysis_Final_Version.docxYou can also read