Public attitudes toward Zimbabwe's 2018 elections: Downbeat yet hopeful? - By Michael Bratton and Eldred V. Masunungure - Africa Portal
←
→
Page content transcription
If your browser does not render page correctly, please read the page content below
Public attitudes toward
Zimbabwe’s 2018 elections:
   Downbeat yet hopeful?
   By Michael Bratton and Eldred V. Masunungure

         Afrobarometer Policy Paper No. 47 | June 2018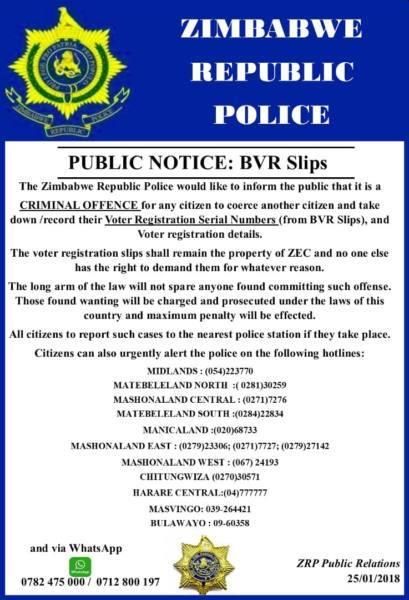
Introduction
Zimbabweans will go to the polls in presidential, parliamentary, and local government
elections on July 30, 2018. These elections are the first test of the popular will since the
dramatic military intervention of November 2017 that forced an end to the 37-year reign of
Robert Mugabe.
To assess the prevailing public mood, including voting intentions, the Institute for Justice and
Reconciliation, Afrobarometer’s core partner for Southern Africa, commissioned a baseline
                           pre-election survey. Fieldwork and public dissemination of results
                           were conducted by the Mass Public Opinion Institute,
                           Afrobarometer’s national partner in Zimbabwe. As a support unit,
                           Afrobarometer provided technical assistance.
                             The survey interviewed a nationally representative sample of 2,400
Zimbabweans between April 28 and May 12, 2018, that is, some three months before the
election.1 A shorter final pre-election survey will follow in late June/early July with results
planned for release shortly before voting day (July 30).
This policy paper selects the most salient results from the survey to address the following
questions:

     ▪   What explains the seemingly contradictory public mood among Zimbabweans, who
         express both economic pessimism and cautious political hope?

     ▪   What is the election about? What are the main issues driving different sorts of voters –
         young and old, rural and urban – to the polls?

     ▪   To what extent will large numbers of young (including first-time) voters affect the
         nature of the campaign and the outcome of the election? Or do factors other than
         age matter more?

     ▪   As of May 2018, what was the state of the presidential race between incumbent
         Emmerson Mnangagwa of ZANU-PF and main challenger Nelson Chamisa of MDC-T?

     ▪   How do perceptions about who sponsored the survey – a governmental or non-
         governmental agency – affect respondents’ willingness to report a partisan voting
         intention?

     ▪   What can we surmise about how the "reticents" (that is, those who refuse to reveal a
         partisan preference) might actually vote?

     ▪   Among other unresolved issues, to what extent do citizens worry about a lack of
         ballot secrecy, bias in the mass media, and the possible announcement of incorrect
         election results?

     ▪   In the short time remaining before the election, what can advocates of free and fair
         elections, including in the international community, do about these unresolved
         issues?

The public mood: Economic pessimism, political hope?
As elections fast approach, Zimbabweans express contradictory views. Whereas most
people are gloomy about prevailing economic conditions and worry about electoral

1
  Afrobarometer, a pan-African, non-partisan research network, conducts face-to-face interviews in the
language of the respondent’s choice with nationally representative samples. A sample of 2,400 yields country-
level results with a margin of error of +/-2% at a 95% confidence level. Previous surveys were conducted in
Zimbabwe in 1999, 2004, 2005, 2009, 2010, 2012, and 2014. For details, please visit www.afrobarometer.org.

Copyright ©Afrobarometer 2018                                                                          1
violence, they also hazard cautious political hope that the 2018 elections will set the country
on a better path. Wary anticipation seems to have displaced the euphoria that immediately
followed the military intervention in November 2017.
On one hand, the general public was in a downcast mood in May 2018 about the country’s
overall direction; at that time, a clear majority (62%) felt that Zimbabwe is “going in the
wrong direction.” Fewer than one-third (32%) saw the country “going in the right direction.”
Perhaps surprisingly, the public mood on this issue hardly changed as a result of the
November 2017 presidential transition from Mugabe to Mnangagwa; in February 2017, a
similar proportion (60%) already felt that the country was going in the wrong direction.
This pessimistic cast of mind is driven principally by economic reasoning. As shown in Figure 1
and Table 1, the country’s perceived direction is strongly correlated with popular
assessments of poor economic performance. For example, more than eight in 10 persons
(81%) who regard the present condition of the Zimbabwean economy as “very bad” also
see the country going in the wrong direction. Bleak assessments of the country’s direction are
similar among those who see present personal living standards as “very bad” and
macroeconomic conditions getting “much worse” over the previous year.

Figure 1 and Table 1: Country direction by economic conditions | Zimbabwe | 2018

                    Among all respondents                     62%                   32%

     Among those who see the country's
                                                                  81%                    13%
      economic conditions as very bad

    Among those who say their personal
                                                                  80%                    15%
      living conditions are very bad
   Among those who see economic
 conditions over past year getting much                             83%                   13%
                  worse
                                                  0%    20%       40%       60%      80%        100%

                Going in the wrong direction             Going in the right direction

                              See country going in the wrong direction
                                                           Bivariate correlation coefficients
                                                               (***significant at p
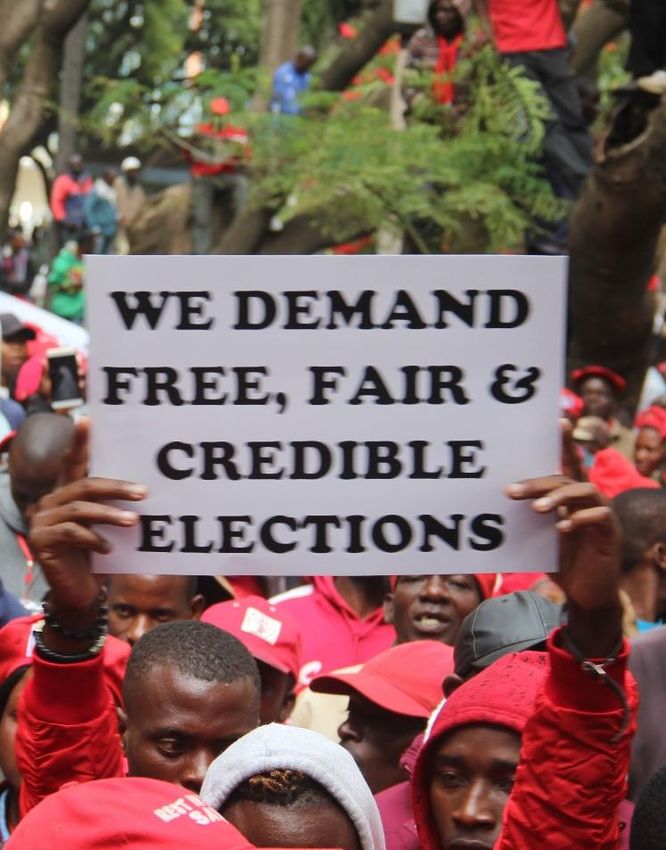
Most importantly, despite past disappointments with disputed elections, three-quarters of all
survey respondents (75%) considered that “we can use our power as voters to choose
leaders who will help us improve our lives.” Just two in 10 (20%) demurred, saying “no matter
whom we vote for, things will not get better in the future.” These opinions are distributed
evenly throughout the population, for example by age, gender, and urban-rural location.
Adding to this somewhat hopeful outlook, a clear majority (62%) expressed the expectation
that the July 2018 elections would be “free and fair.”
But only a minority (44%) thought that the contest would be “completely free and fair.”
Perhaps remembering past episodes of heavy-handed electioneering, at least half of all
adults interviewed (51%) voiced fear that they, personally, would “become a victim of
political intimidation or violence” during the current campaign. Thus, of all measures
contributing to a free and fair election, people attached most importance to “ensuring that
there is no political violence.”

Figure 2: Views on elections | Zimbabwe | 2018

   Choose leaders through regular, open,
                                                                                           83%
           and honest elections

     Elections must be conducted in 2018                                                   83%

                  Voting can improve lives                                            75%

 Expect that elections will be free and fair                                   62%

       Fear becoming a victim of political
                                                                        51%
             intimidation or violence

                                               0%         20%    40%     60%         80%     100%

The contradiction in the public mood is on full display in Figure 3. Admittedly, there is a
tendency for the people who think that “voting changes nothing” to be more inclined than
average to think the country is going in the wrong direction (70%). But, strikingly,
economically driven pessimism about the direction of the country does not deter the clear
majority from believing that “voting helps improve lives” (61%). One inference from these
results is that many people anticipate that the 2018 elections offer a rare opportunity to chart
a new course for the country by peacefully installing a government that enables meaningful
economic change.

Figure 3: Economic pessimism, political hope? | Zimbabwe | 2018

 Among those who say voting can help
                                                     34%                  61%
            improve lives

 Among those who say voting changes
                                                    25%                 70%
              nothing

                                          0%          20%       40%     60%          80%     100%

       Country is going in the right direction       Country is going in the wrong direction

Copyright ©Afrobarometer 2018                                                                    3
It is therefore relevant that the 2018 contest is the first in Zimbabwe’s history in which both
leading candidates for the presidency are campaigning on messages of economic reform.
At the same time, it remains unclear how far either candidate – Emmerson Mnangagwa of
ZANU-PF and Nelson Chamisa of MDC-T – is willing or able to go in dismantling party-state
overreach into the economy and implementing policies of inclusive economic growth. While
voters remain cautiously optimistic about post-election gains – 59% expect economic
conditions to be “better” or “much better” by mid-2019 – most also remain skeptical about
campaign promises whose sincerity and realism have yet to be tested.
What is the election about?
As suggested above, Zimbabweans hope that the election will produce a government that
will put an end to the country’s slide into economic penury. To test this proposition, the survey
applied a standard Afrobarometer question to the pre-election circumstances prevailing in
2018: “What are the most important problems facing this country that the forthcoming
election campaign should address?” Each of the survey’s 2,400 respondents could offer up
to three answers, which generated a robust total of 7,197 responses.
As Figure 4 shows, unemployment was far and away the most pressing issue of the day, cited
by almost two-thirds (64%) of respondents. It was followed by two other economic issues:
management of the economy (39%) and wages and salaries (25%). Indeed, eight out of the
top 10 issues mentioned by citizens were economic problems, ranging from the country’s
decaying infrastructure (symbolized by proliferating potholes on public roads) to “the cash
crisis” (that is, the limited amount of currency in circulation). On a brighter note, while
Zimbabweans cited official corruption as a campaign issue, twice as many respondents –
42% versus 21% – saw this problem as shrinking rather than growing since the leadership
transition in November 2017.
Figure 4: Most important problems that the election campaign should address
| Zimbabwe | 2018
Unemployment 64%
Management of the economy 39%
Wages and salaries 25%
Health 19%
Corruption 17%
Infrastructure 17%
Education 13%
Food shortage 13%
Poverty 12%
Cash crisis 11%
0% 20% 40% 60% 80% 100%
Unemployment is an especially pressing problem for young people. Figure 5 displays a
stepwise decline in concern about job creation by age. Whereas just about half (52%) of
persons aged 51 and older regard unemployment as one of their campaign priorities, almost
three-quarters (73%) of young people aged 18-25 do so. So it might be expected that, if
Copyright ©Afrobarometer 2018 4young people turn out to vote, they will do so for the candidates who have the most
compelling and convincing message about how to deliver “jobs, jobs, jobs.”
Figure 5: Top three election issues by age | Zimbabwe | 2018
100%
80% 73%
69%
61%
60% 52%
39% 39% 40% 39%
40%
23% 26% 25% 24%
20%
0%
Unemployment Management of the Wages and salaries
economy
Age 18-25 Age 26-35 Age 36-50 Age 51+
Moreover, this message will be most effective in reaching young voters – especially those in
urban areas – if disseminated via the latest information and communications technology.
The survey suggests that in 2018, almost one-third (31%) of youthful urbanites receive election
information via social media platforms such as Facebook, Twitter, and WhatsApp (see Figure
6). Both major political parties have developed a slick social-media presence precisely to
appeal to this growing segment of the political market. The diversity of competing messages
on electronic platforms – both reliable and fake – stands in stark contrast to the one-
dimensional diet of official information disseminated over government-operated radio. In this
regard, younger urban audiences may be exposed to a very different campaign than older
rural listeners.
Figure 6: Election information from social media | by age | Zimbabwe | 2018
100%
87%
80% 73% 74% 72%
66%
60%
43% 44%
40%
40% 31% 29%
25%
20% 11%
10% 9% 8%
2%
0%
Urban Rural Urban Rural Urban Rural Urban Rural
Age 18-25 Age 26-35 Age 36-50 Age 51+
A lot of information A little information No information
Copyright ©Afrobarometer 2018 5A youth wave?
Like many African countries, Zimbabwe has a youthful population. The Zimbabwe National
Statistical Agency (ZimStat) uses projections from the 2012 census to estimate that 29% of the
2018 voting-age population is aged between 18 and 25. Many of these individuals are
eligible to vote for the first time in the July 30 elections. In the past, however, young
Zimbabweans have registered to vote and turned out at the polls in far smaller numbers than
their share of the voting-age population would allow.
Starting in 2017, the government introduced a biometric voter registration (BVR) system
designed to improve the integrity of Zimbabwe’s voters’ roll. The implementation of BVR was
well received by citizens; more than 75% of all eligible voters (and more than 90% of
registered voters) praised various aspects of the process. Among other things, BVR promised
to increase the rate of youth voter registration.
The pre-election baseline survey of May 2018 asked all respondents whether they had
registered to vote. The self-reported results, which are displayed by age group in Figure 7,
demonstrate a pattern common around the world, namely that age and voter registration
are positively related. Stated differently, older cohorts register to vote in larger proportions
than younger cohorts. In Zimbabwe, 92% of persons aged 51 and above said they were
registered to vote, compared to 73% of those in the 18-25 age bracket.
Figure 7: Voter registration, self-reported | by age | Zimbabwe | 2018
100% 5% 4%
8% 4%
14% 5%
7%
80% 13%
60%
90% 92%
40% 85%
73%
20%
0%
Age 18-25 Age 26-35 Age 36-50 Age 51+
Yes, I am registered No, but I intend to register
No, I do not intend to register
But the 2018 snapshot conceals change over time. As shown in Figure 8, the rate of youth
voter registration has risen sharply over previous election periods. The question “Are you
registered?” is asked in Afrobarometer surveys only in election years. In 2005, slightly more
than half (54%) of eligible 18- to 25-year-old Zimbabweans said they were registered to vote,
a figure that barely rose (to 57%) by the time of Zimbabwe’s last general elections in 2013.
Against this background, the fact that 73% of the youngest cohort now claim to be
registered suggests that young (including first-time) voters could play an influential role in the
2018 elections.
Copyright ©Afrobarometer 2018 6Figure 8: Voter registration, self-reported | by age | Zimbabwe | 2005-2018
100% 96%
90% 92%
93%
90%
87% 85%
85%
80%
80%
73%
60%
57%
54%
40%
20%
0%
2005 2013 2018
Age 18-25 Age 26-35 Age 36-50 Age 51+
Where are these new young voters located? As Figure 9 shows, they reside in both rural
and urban areas, which implies that both the rural-based ZANU-PF and the urban-centered
MDC-T could benefit from the turnout of these voters at the polls. But the incumbent party
might benefit more than the challenger. First, about one in six members of the youngest
cohort in urban areas report that they have no intention of registering to vote, which points
to a troubling degree of alienation from politics among some youthful elements in
Zimbabwe’s cities and towns. Second, voter registration among the second-youngest age
bracket (26-35) is somewhat higher in rural than urban areas (87% vs. 82%). It is not
unreasonable to suppose that these voters, like others in rural areas, may turn out to vote in
larger numbers than their urban counterparts.
Figure 9: Youth registration | by location | Zimbabwe | 2018
100%
13% 6% 11%
17% 7%
7%
80% 15%
11%
60%
40% 87% 82%
73% 71%
20%
0%
Rural Urban Rural Urban
Age 18-25 Age 26-35
Yes, I am registered No, but I intend to register No, I do not intend to register
Copyright ©Afrobarometer 2018 7Voting intentions
How then might Zimbabweans vote on July 30? To gain a measure of insight into this all-
important issue, the May 2018 survey asked a hypothetical question: “If presidential elections
were held tomorrow, which party’s candidate would you vote for?” The question was asked
only of respondents who said they were both registered to vote and “probably” or
“definitely” going to vote. Analysis is limited here to the presidential (not parliamentary)
election since the presidency is the grand prize in Zimbabwean politics and the subject of
greatest popular interest.
The results are displayed in Figure 10. Some 42% indicated that they favoured ZANU-PF,
whose candidate is the sitting president, Emmerson Mnangagwa. By contrast, a total of 31%
opted for Nelson Chamisa, the candidate of both the MDC-T party (still named after its late
leader, Morgan Tsvangirai) and a newly formed MDC-Alliance (which includes parties led by
Tendai Biti (PDP) and Welshman Ncube (MDC-Ncube), among others). Bringing up the rear,
fewer than 2% (combined) said they intended to vote for parties led by Joice Mujuru (NPP),
Dumiso Dabengwa (ZAPU), and Thokozana Khupe (MDC-T Khupe). In short, as of May, the
presidential election of 2018 had turned into a two-horse race.
Figure 10: Voting intentions of registered likely voters in the presidential election as of
April/May 2018 | Zimbabwe
ZANU-PF 42%
MDC-T Chamisa 30%
MDC Alliance 1%
Other 1%
Don’t know 7%
Refused to answer 19%
0% 20% 40% 60% 80% 100%
(Analysis includes only registered likely voters.)
A couple of important caveats must be borne in mind about these data. First, the voting
intentions of a quarter (26%) of likely voters remain unknown: 19% refused to answer the
question, and 7% said they didn’t know whom they would vote for. Some of these voters may
be genuinely undecided, though this is rather unlikely in Zimbabwe’s historically polarized
party system. Certainly, it would be incorrect to describe this entire bloc of silent respondents
as “undecided” or “uncommitted.” More likely, most of them have well-established political
commitments that they justifiably decline to reveal in order to protect the privacy of their
vote. For this reason, it seems more appropriate to call this group of voters the “reticents.”
The second caveat is that the voting-intention results refer to early May 2018. At that time,
some voters were still learning about the two major candidates, neither of whom had run for
Copyright ©Afrobarometer 2018 8the top office before. While Mnangagwa’s history as a ZANU-PF stalwart was common public
knowledge, he has embarked on a charm offensive to remake his image as an economic
reformer. And Chamisa, a 40-year-old who was well known only within MDC-T circles, faced
the challenge of introducing himself and his idealistic message of sweeping change to a
broader electorate. Moreover, both major parties had recently suffered serious internal splits
and defections, which complicated the range of options open to voters. In such a fluid
political environment, voting intentions could easily change – perhaps even tip the balance
– by July 30. As a result, caution is warranted in handicapping the presidential horse race.
Demographic structure
How does an expected increase in voter turnout among young people affect anticipated
election outcomes? One popular narrative suggests that young people, especially urban
youth, favour the challenger and thus represent Chamisa’s best chance for an upset victory.
Figure 11 confirms that there is some merit to this case: Younger voters lean toward Chamisa,
and older voters lean toward Mnangagwa. However, the vote of the 18- to 25-year-olds
appears to be up for grabs, with each candidate securing just over one-third of the youth
vote, at least as of a hypothetical race in early May 2018.
Figure 11: Voting intentions of registered likely voters in the presidential election as of
April/May 2018 | by age | Zimbabwe
100%
80%
60%
42% 45%
37% 36% 38% 36%
40%
30%
22%
20%
0%
Age 18-25 Age 26-35 Age 36-50 Age 51+
Intend to vote for Mnangagwa Intend to vote for Chamisa
(Analysis includes only registered likely voters.)
But there is reason to question the narrative of a decisive youth wave in Zimbabwe’s 2018
election. Table 2 displays a regression analysis that weighs the influence of four key
demographic factors in explaining intended vote choices. 2 It shows that all factors – age,
gender, education, and residential location (urban or rural) – have some meaningful effect
on voting intentions. But once these factors are controlled for each other, age becomes the
least influential consideration. Instead, the best demographic predictors are the voter’s rural
2
The analysis is run twice: once for an intended vote for Mnangagwa and again for an intended vote for
Chamisa. The signs on the coefficients indicate whether the relationship between the demographic predictor
and voting intentions is positive or negative. The coefficients in each column are arithmetically comparable
with each other, with higher values indicating stronger relationships. All relationships are mutually controlled
for the other variables in the model. Statistical significance is portrayed with asterisks; the more asterisks, the
less likely the observed relationship is due to chance. In plain language, and other things being equal, the
demographic factors with the largest values and highest significance are the ones that “matter the most.”
Copyright ©Afrobarometer 2018 9residential location (for an intended vote for Mnangagwa) and his or her level of formal
education (for an intended vote for Chamisa). Indeed, the analysis reveals that the two
major parties appeal to very different political bases: ZANU-PF to a rural base and MDC-T to a
base among educated people.
Table 2: Demographic factors in vote choice, presidential election
| Zimbabwe | 2018
Intend to vote Intend to vote
for Mnangagwa for Chamisa
(.131) (.462)
(Constant)
Age .037* -.042*
Gender (male) .052** -.072***
Education -.185**** .214****
Location (rural) .240**** -.163****
Notes: OLS regressions: Cell entries are standardized coefficients (Beta). Statistical
significance: **** pIn Zimbabwe in April/May 2018, 39% of all respondents saw the survey this way. As expected,
more rural dwellers (45%) than townsfolk (29%) perceived government sponsorship.
Are these figures high or low? From a comparative African perspective, 39% might seem
high: In at least four African countries – Namibia (24%), Mauritius (22%), Nigeria (18%), and
Togo (17%) – fewer than a quarter of respondents identified a government sponsor in 2017
Afrobarometer surveys. Moreover, if almost four in 10 Zimbabweans suspect a hidden official
hand in the survey, they might offer misleading responses that could weigh more heavily on
voting intentions than even the strongest demographic factors.
On the other hand, the more relevant comparison may be with Zimbabwe’s own past. Figure
12 tracks perceived survey sponsorship over time. In the early days of public opinion research
on democratic governance in Zimbabwe, a majority thought the surveyors were sent by
government or a political party (51% in 2005 and 2012). But a notable turnaround has
occurred, perhaps as people have learned about the origins and purposes of survey
research or, more recently, as political space has opened up since November 2017. By May
2018, more people thought the present survey was sponsored by a non-governmental or
private agency (48%) than saw it as a governmental project (39%) – a 9percentage-point
gap.
Figure 12: Perceived survey sponsorship | Zimbabwe | 2004-2018
100%
80%
60%
51% 46% 48%
51% 45% 45%
45% 39%
40% 43% 39%
41% 42%
28%
28%
20% 21% 27%
14% 12% 13% 13%
11%
0%
2004 2009 2012 2013 2014 2017 2018
Government/Party/Politician NGO/Private agency
Other/Don't know
What are the implications of perceived survey sponsorship for stated voting intentions? If
citizens think the government commissioned the survey, then they are more likely to report
support for ZANU-PF (55%, vs. 19% for MDC). If, however, they think a non-governmental
agency was behind the survey, then the tables are turned; under these circumstances, more
people say that they support MDC (42%, vs. 31% for ZANU-PF) (Figure 13).
Copyright ©Afrobarometer 2018 11Figure 13: Voting intentions by perceived survey sponsorship | Zimbabwe | 2018
100%
80%
60% 55%
42%
40%
31%
24% 22%
19%
20%
5%
2%
0%
See government survey sponsor See non-government survey sponsor
ZANU-PF MDC-T/A Other party Refused/Don't know
(Analysis includes only registered likely voters.)
These figures provide a basis for estimating the likely behaviour at the polls of “reticent”
voters who refuse to declare a voting intention. As stated earlier, this group consists of 26% of
registered likely voters. Several alternative assumptions can be made about their undisclosed
partisan preferences:
▪ Assumption A: Reticents are distributed in the same proportion as declared voters
(that is, ZANU-PF:MDC = 42:31; see Figure 10). For the purpose of comparing
assumptions, this scale is standardized on a scale of 100, which yields a ratio of 58:42.
▪ Assumption B: All reticents are opposition supporters (ZANU-PF:MDC = 0:100).
▪ Assumption C: Reticents split according to voters’ perceptions of an NGO/private
survey sponsor. This perception serves as a proxy for people’s preferences absent the
fear that they are being surveilled by a government agency. The ratio of ZANU-
PF:MDC support of 31:42 (see Figure 13) is equivalent to a standardized ratio of 42:58.
Thus, according to the observed data, Assumption C perfectly reverses the assumed
distribution of reticent votes in MDC’s favour.
But which assumption best captures the real world? Assumptions A and B seem too extreme.
On the one hand, Assumption A surely underestimates the proportion of voters who fear
revealing that they do not support a powerful ruling party. On the other hand, Assumption B
is surely too enthusiastic in allocating all reticent votes to a divided opposition with an
untested leader. For these reasons, Assumption C seems to be the most realistic scenario.
Under conditions of suspected respondent self-censorship, one would expect to discover
more hidden opposition than ruling-party votes. It therefore seems reasonable to allocate
reticent votes in the 42:58 ratio that favours MDC.
A recalculation of voting intentions along these lines is reported in Table 3. It shows the status
of the presidential race if (a big IF) the election had been held in early May 2018. For the first
time, we gain insight into the probabilities of either party winning on the first round of
presidential voting. The Constitution of Zimbabwe and the electoral law require a winning
candidate to obtain a simple majority of votes (50% plus one) in order to avoid a second-
Copyright ©Afrobarometer 2018 12round runoff.4 In all three of the following scenarios, which include estimates of the
distribution of reticent votes, one or the other of the main political parties could win on the
first round.
▪ Scenario A: The ZANU-PF candidate might beat the MDC candidate by a 15-point
margin;
▪ Scenario B: The MDC candidate might beat the ZANU-PF candidate by a 13-point
margin; or
▪ Scenario C: The ZANU-PF candidate might beat the MDC candidate by an 7-point
margin.
The survey data suggest that Scenario C would have been the most likely outcome. But, to
repeat: A ZANU-PF victory is not a prediction of where the race will stand on July 30; it is
simply an estimate of where the race stood in early May 2018.
Table 3: Estimated voting intentions, including “reticents” | Zimbabwe | 2018
Estimated vote for Estimated vote for
Mnangagwa Chamisa
Assumption A
57.6% 42.4%
(ZPF:MDC = 58:42)
Assumption B
43.4% 56.6%
(ZPF:MDC = 0:100)
Assumption C
53.7% 46.3%
(ZPF:MDC = 42:58)
(Calculations include only registered likely voters. Calculations exclude intended votes for small parties
(Ballot secrecy
As shown in Figure 14, too many Zimbabweans
remain concerned about the secrecy of the
ballot. Even though people are broadly satisfied
with the BVR process and enjoy improved
confidence in the accuracy of the voters’ roll,
they also harbor doubts about possible abuse
of the new registration system. As early as May,
almost one-third (31%) of registered likely voters
reported that “someone” – usually an official
from the ruling party or a traditional leader –
had requested to inspect the serial number on
their voter-registration slip. According to a well-
publicized statement from the Zimbabwe
Republic Police (see at right), all such
transactions are unauthorized and illegal. The
Zimbabwe Electoral Commission reinforced this
message with a statement on January 31, 2018,5
saying it had “received reports that there are
individuals forcibly demanding voter registration
slips or details thereof, such as serial numbers
from registrants, which action is tantamount to
intimidation. This is contrary to the provisions of
both the Constitution and the Electoral Act.”
Yet, according to the survey, reports of such
demands are widespread, especially in rural
areas (33%) and especially in Masvingo (49%),
Bulawayo (35%), and Mashonaland East (35%)
provinces.
Figure 14: Ballot secrecy | Zimbabwe | 2018
33%
Has anyone requested to see your BVR
26%
slip? (% yes)
31%
How likely is it that powerful people will find 31%
out how you voted? (% somewhat/very 33%
likely) 31%
75%
Do voters have to show a BVR slip in order
67%
to vote? (% yes)
72%
0% 20% 40% 60% 80% 100%
Rural Urban All
(Analysis includes only registered likely voters.)
5
See http://www.thezimbabwemail.com/main/zec-condemns-voter-intimidation-polls-loom/
Copyright ©Afrobarometer 2018 14The inspection of BVR slips apparently provokes popular fear of a loss of ballot secrecy.
Almost one-third of respondents (again 31%, mostly the same people) reported that they
think it is “somewhat” or “very” likely that “powerful people will find out how you voted.”
Citizens were unsure about exactly how the authorities might make use of their computerized
personal records – including photographs and fingerprints, whose acquisition in itself
frightened some registrants – but they were worried about the potential for abuse.
Moreover, a very large majority of citizens were under the misapprehension that a BVR
registration slip is a necessary requirement for the act of voting. Some 72% of respondents
(75% in rural areas) thought that, in order to exercise the right to vote, voters must carry this
document to the polls and produce it on demand to an election official. Some political
parties have been propagating this misinformation, perhaps as a form of political
intimidation. Yet the only legal requirement is that a voter offer some form of verifiable
identification, such as a national identity card (but not a driver’s license), that can be
matched to the voter’s personal details on the voters’ roll. Taken together, unresolved
concerns about the improper use of biometric information have the unfortunate potential to
undermine new popular confidence in voter registration and reinforce deep-seated
skepticism about balloting procedures.
Media access
One key requirement of a free and fair electoral process is a level playing field on which all
political parties, alliances, and candidates can get their political messages out to the
electorate. Yet the media environment in Zimbabwe is as polarized as the parties, with
competing outlets affording selective – often strident and even deceptive – coverage to
different political audiences. As a result, the electorate is split along partisan lines about
whether their preferred candidates are covered freely and fairly by various media.
Take the state media, notably the Zimbabwe Broadcasting Corporation television and radio
services. Figure 15 shows that fewer than half (41%) of all citizens said that these outlets offer
equal treatment to all comers. And views were split along partisan lines on this issue. MDC
supporters were less than half as likely as ZANU-PF supporters (25% vs. 56%) to think that their
candidates get equal access to the state airwaves.
Figure 15: Media access | Zimbabwe | 2018
56%
Will all candidates receive equal
25%
treatment by the state media? (% yes)
41%
Will all candidates receive equal 53%
treatment by the independent media 38%
(% yes) 46%
In your opinion, how free is the news
55%
media in Zimbabwe today? (%
27%
"completely free" or "free with minor
problems") 38%
0% 20% 40% 60% 80% 100%
ZANU-PF supporters MDC supporters All
(Analysis includes all respondents.)
Copyright ©Afrobarometer 2018 15Even the independent media were given a failing grade on evenhandedness. Slightly more –
but still fewer than half (46%) – credited independent newspapers and radio stations with
providing equal access. And the partisan gap remained wide (38% for MDC acolytes vs. 53%
for ZANU-PF followers).
Lastly, popular concerns about media access led citizens to conclude that the news media
in Zimbabwe are not free. Only 38% saw this sector as “completely free” or “free with minor
problems.” The usual partisan gap applied. For this reason, the electorate entered the final
weeks of the campaign without media platforms on which different political views could be
discussed equably and dispassionately.
Announcement of results
Of all electoral procedures in Zimbabwe, the final stages of centralized counting, tabulating,
and announcing results are the most opaque. In 2008, for example, the final count in the first
round of the presidential election was moved from the electoral commission to military
barracks, and an announcement of disputed results was made only after a suspicious five-
week delay. Vivid recollections of this episode are seared in the collective public memory.
The present pre-election survey uncovered evidence of persistent public anxiety about how
the endgame of the 2018 election might play out (Figure 16). Almost one-third of
respondents (29% overall, 37% in urban areas) worried that their vote “will not actually be
counted.” Even more (44% overall, 56% urban) thought it “somewhat likely” or “very likely”
that an incorrect result would be announced. To repeat: Almost one-half (more than half in
cities and towns) already expressed doubts about the reliability of expected results. This
finding, perhaps more than any other in the survey, signals popular unease about election
quality.
Many Zimbabweans were even willing to engage in further speculation about election
outcomes. Four in 10 respondents (more than five in 10 in urban areas) anticipated that
“security agencies will not accept the result of the presidential election,” presumably in the
event that opposition forces manage to defeat the ruling party. And the announcement of
any results could trigger the sorts of post-election violence that Zimbabwe has experienced
in the aftermath of elections going back as far as the 1980s. Some 40% overall said they fear
this outcome, including majorities in the MDC-T urban strongholds of Harare (59%) and
Bulawayo (57%).
Figure 16: Popular apprehensions about election results | Zimbabwe | 2018
24%
Your vote will not actually be counted 37%
29%
36%
An incorrect result will be announced 56%
44%
Security agencies will not accept the 34%
53%
results 41%
There will be violence after the 32%
54%
announcement 40%
0% 20% 40% 60% 80% 100%
Rural Urban All
(Analysis includes all respondents.)
Copyright ©Afrobarometer 2018 16Taken together, popular apprehensions about the announcement of election results –
particularly if these results become a matter of dispute – could potentially undermine the
legitimacy of upcoming 2018 elections. The prospect that these elections could be seen as
illegitimate should worry the winning side as much as the losers. After all, in the wake of a
military intervention in November 2017, most Zimbabweans would prefer to return their
country to an era of constitutional rule.6 Only a genuinely free and fair election can fully
achieve this outcome.
Action steps
What, in the waning days of the campaign, can advocates of election quality do to help
ensure a positive outcome? In particular, how can the international community use its in-
country presence to draw attention to the most pressing remaining issues? The following
steps are recommended:
On ballot secrecy
▪ Enable civic organizations and public and private mass media to undertake a voter-
education blitz. Among other key messages, inform would-be voters that national
identity cards (rather than BVR slips) are sufficient to identify themselves at the polls.
▪ Implore President Mnangagwa to issue a high-profile statement to the nation that
“your vote is secret.” Although not every voter will fully trust a mere verbal assurance,
an official declaration to this effect may help to build confidence
On media access
▪ Capacitate the Zimbabwe Electoral Commission to fulfill its media-monitoring
mandate (assumed after the June 14 nomination day).
▪ Ensure early and regular issuance of media-monitoring reports in the final weeks of
the election campaign. Avoid the common practice of issuing such reports only after
the election, when it is too late to correct any imbalances.
▪ Alert international election-observation delegations on arrival in Zimbabwe of the
importance of the media-access issue. Urge them to flag disparities early and often.
On the announcement of results
▪ Ask Vice President Constantino Chiwenga (who is de facto Minister of Defense) to
issue a public statement to explicitly assure the public that security forces will abstain
from electioneering and respect the results of the election as determined by the
electoral commission.
▪ Encourage political parties through the Multi-party Liaison Committee and other
forums to take electoral disputes to the courts rather than into the streets.
Conclusion and disclaimers
About three months ahead of voting day, Zimbabweans were downbeat about economic
conditions but tentatively hopeful that free and fair elections on July 30 would break the
mold of past disputed contests, restore political legitimacy, and launch economic reforms.
The citizenry’s biggest unresolved concern was that government authorities will announce an
incorrect election result, thus derailing the country’s quest for a return to constitutional order.
6
Majorities of Zimbabweans reject military rule as an alternative to democracy (71%) and assert that the
armed forces “must not be involved at all in the country’s politics” (68%). Most also consider that the 2017
military action was the “wrong thing to do” (52%) even if it was “necessary.”
Copyright ©Afrobarometer 2018 17The analysis in this paper is based on a systematic survey of a random cross-section of citizens
aged 18 years and older. It is possible (but unlikely) that results based on quantitative survey
data have missed certain qualitative aspects of the public mood.
Important: The survey represents a snapshot at one moment in time. It was conducted
before the campaign was disrupted by a blast at a Bulawayo campaign rally that sullied
hopes for an election free of tension. There is also every reason to expect swings in public
opinion, including voting intentions, in the late stages of any election campaign. Last-minute
changes in the momentum of any party, alliance, or candidate will be monitored in a follow-
up survey to be conducted in late June/early July, with results to be reported before voting
day.
Do your own analysis of Afrobarometer data – on any
question, for any country and survey round. It’s easy and
free at www.afrobarometer.org/online-data-analysis.
Copyright ©Afrobarometer 2018 18Appendix
Survey question texts for figures and tables
Figure 1 and Table 1
- Let's start with your general view about the current direction of our country. Some
people might think the country is going in the wrong direction. Others may feel it is
going in the right direction. So let me ask YOU about the overall direction of the
country: Would you say that the country is going in the wrong direction or going in
the right direction?
- In general, how would you describe: The present economic condition of this country?
Your own present living conditions?
- Looking back, how do you rate economic conditions in this country compared to 12
months ago?
Figure 2
- Which of the following statements is closest to your view?
Statement 1: We should choose our leaders in this country through regular, open, and honest
elections.
Statement 2: Since elections sometimes produce bad results, we should consider other
methods for choosing this country’s leaders
- Which of the following statements is closest to your view?
Statement 1: In accordance with the Constitution, which requires elections every five years,
elections must be held in 2018.
Statement 2: Elections are not necessary in 2018 since there are other more important
matters for the country to attend to.
- Which of the following statements is closest to your view?
Statement 1: No matter whom we vote for, things will not get better in the future.
Statement 2: We can use our power as voters to choose leaders who will help us improve our
lives.
(% who “agree” or “agree very strongly” with each statement)
- How free and fair do you expect the next elections of 2018 to be? (% “completely
free and fair” or “free and fair with minor problems”)
- During election campaigns in this country, how much do you personally fear
becoming a victim of political intimidation or violence? (% “somewhat” or “a lot”)
Figure 3
- Which of the following statements is closest to your view?
Statement 1: No matter whom we vote for, things will not get better in the future.
Statement 2: We can use our power as voters to choose leaders who will help us improve our
lives.
(% who “agree” or “agree very strongly” with each statement)
Figures 4-5
- What are the most important problems facing this country that the forthcoming
election campaign should address?
Figure 6
- How much information on the 2018 elections have you received from the following
sources: Social media?
Figures 7-9
- Are you registered to vote in the upcoming 2018 elections?
Figures 10-11 and Tables 2-3
- If presidential elections were held tomorrow, which party’s candidate would you vote
for?
Copyright ©Afrobarometer 2018 19Figure 12
- Who do you think sent us to do this interview?
Figure 13
- Who do you think sent us to do this interview?
- If presidential elections were held tomorrow, which party’s candidate would you vote
for?
Figure 14
- As you may know, Zimbabwe will hold elections in 2018. I would like to ask you a few
questions about these elections: Has anyone demanded to see the serial number of
your voter registration slip?
- In your opinion, how likely will the following things happen in the 2018 elections: Even
though there is supposed to be a secret ballot in this country, powerful people will
find out how you voted?
- To your knowledge, will a citizen have to show a biometric voter registration slip in
order to vote?
Figure 15
- Let’s break down the various parts of the upcoming 2018 elections. How free and fair
do you expect these elections to be in terms of: Equal treatment of all candidates by
state media? Equal treatment of all candidates by the independent media?
- In your opinion, how much of a free and uncensored news media does Zimbabwe
have today?
- Do you feel close to any particular political party? (If yes:) Which party is that?
Figure 16
- In your view, how likely is it that:
- Even though you will cast a ballot, your vote will not actually be counted?
- Even after all ballots are counted, an incorrect result will be announced?
- Security agencies will not recognize the result of the presidential election?
- There will be violence after the announcement of election results?
(% who say “somewhat” or “very” likely)
Copyright ©Afrobarometer 2018 20Michael Bratton is senior adviser to Afrobarometer.
Eldred V. Masunungure is executive director of Mass Public Opinion Institute,
Harare, Zimbabwe.
Afrobarometer is produced collaboratively by social scientists from more than 30
African countries. Coordination is provided by the Center for Democratic
Development (CDD) in Ghana, the Institute for Justice and Reconciliation (IJR) in
South Africa, the Institute for Development Studies (IDS) at the University of Nairobi
in Kenya, and the Institute for Empirical Research in Political Economy (IREEP) in
Benin. Michigan State University (MSU) and the University of Cape Town (UCT)
provide technical support to the network.
The Delegation of the European Union to Zimbabwe provided financial support for
2018 pre-election surveys in Zimbabwe to the Institute for Justice and
Reconciliation, Afrobarometer’s core partner in Southern Africa.
Donations help the Afrobarometer Project give voice to African citizens. Please
consider making a contribution (at www.afrobarometer.org) or contact Aba Kittoe
(akittoe@afrobarometer.org)to discuss institutional funding.
For more information, please visit www.afrobarometer.org.
Follow our releases on Twitter and Facebook.
Cover photo: Adapted from photograph by Lovejoy Mutongwiza/263Chat.com, via Google.
Contact: mbratton@msu.edu, director@mpoi.org.zw
Afrobarometer Policy Paper No. 47 | June 2018You can also read