Regulating the Superficial Vacancies and OH Orientations on Polarized Hydroxyapatite Electrocatalysts - UPC
←
→
Page content transcription
If your browser does not render page correctly, please read the page content below
Research Article

                                                                                                                          www.advmatinterfaces.de

Regulating the Superficial Vacancies and OH− Orientations
on Polarized Hydroxyapatite Electrocatalysts
Jordi Sans,* Marc Arnau, Francesc Estrany, Pau Turon,* and Carlos Alemán*

                                                                                                   purposes.[1] A great deal of effort has
Smart designs of hydroxyapatite (HAp) materials with customized electrical                         been put into developing customized
properties are drawing increasing attention for their wide range of potential                      HAp-based materials with reinforced
applications. Such enhanced electrical properties directly arise from the                          properties to fulfill the requirements of
                                                                                                   specific applications.[2,3] Within this con-
number and orientation of OH− groups in the HAp lattice. Although different
                                                                                                   text, the ability to control the electrical
polarization treatments have been proposed to enhance the final conductivity                       properties of HAp is attracting increased
by generating vacancies at high temperatures and imposing specific OH−                             attention, as those properties not only
orientations through electric voltages, no direct measurement showing the                          have demonstrated to play a crucial role
evolution that OH− groups undergo has been described yet. In this article,                         in tissue engineering[4] and smart bio-
                                                                                                   engineering[5] but also to open the way
the first direct empirical observation that allows the characterization of both
                                                                                                   for other uses, such as electronics[6] and
the generation of vacancies and the polarization of OH− groups is reported.                        green catalysis.[7,8]
The mechanisms behind the electrical enhancement are elucidated allowing                              The electrical properties of HAp arise
to distinguish between charge accumulation at the crystal grains, which is                         directly from the hydroxyl (OH–) ions
due to the formed vacancies, and charge accumulation in the boundaries of                          contained in its crystal lattice, which can
particles. In addition, a linear dependence between the number of vacancies                        be treated as dipoles arranged in par-
                                                                                                   allel columns aligned with the c-axis.
and the superficial charge is observed. Therefore, it is demonstrated that the
                                                                                                   Enhanced electrical conductivities were
charge accumulation at the micrometric grain boundaries has a great impact                         successfully achieved at high tempera-
on the catalytic properties of the thermally stimulated polarized HAp. These                       tures by generating OH− vacancies
results will be used for further optimization of the catalyst properties.                          due to a dehydration process that was
                                                                                                   described as follows[9,10]

1. Introduction                                                              Ca 10 (PO4 )6 (OH)2 → Ca 10 (PO4 )6 (OH)2−2 x Ox ∆ x +x H2O      (1)

Synthetic hydroxyapatite (HAp) is the foremost versatile and                 where ∆ denotes OH− vacancies. Although the generation of
widely used ceramic for both biomedical and technological                    vacancies was measured in situ by Raman microscopy,[11] the
                                                                             posterior effect of this treatment at room temperature has
                                                                             not been reported yet. Such dehydration process, hereafter
J. Sans, M. Arnau, Dr. F. Estrany, Prof. C. Alemán                           denoted calcination treatment, is also responsible for structural
Departament d’Enginyeria Química                                             changes, affecting the crystallinity and mechanical properties
EEBE                                                                         of HAp.[12,13] Low generation of vacancies and suppression of
Universitat Politècnica de Catalunya
C/Eduard Maristany, 10-14, Ed. I2, Barcelona 08019, Spain                    carbonates present in the crystal lattice is expected to cause an
E-mail: jordi.sans.mila@upc.edu; carlos.aleman@upc.edu                       increment of the crystallinity. Conversely, fast generation of
J. Sans, M. Arnau, Dr. F. Estrany, Prof. C. Alemán                           vacancies, which can be favored by OH− abundant atmospheres
Barcelona Research Center in Multiscale Science and Engineering              at high temperatures, generates disorder or even transitions
Universitat Politècnica de Catalunya                                         to other calcium phosphate salts, such as amorphous calcium
C/Eduard Maristany, 10-14, Barcelona 08019, Spain
                                                                             phosphate or β-tricalcium phosphate (βTCP), altering the final
Dr. P. Turon
B. Braun Surgical
                                                                             properties of HAp.[12] Additionally, the higher the number of
S.A.U. Carretera de Terrassa 121, Rubí, Barcelona 08191, Spain               vacancies, the higher the mobility of OH− dipoles that are less
E-mail: pau.turon@bbraun.com                                                 affected by the electrostatic forces of nearby OH− in the same
Prof. C. Alemán                                                              column.[14]
Institute for Bioengineering of Catalonia (IBEC)                                Control of the orientation of OH− groups is highly desirable
The Barcelona Institute of Science and Technology                            to stabilize the mineral and its properties. Therefore, a treat-
Baldiri Reixac 10-12, Barcelona 08028, Spain
                                                                             ment consisting in imposing a defined global OH− orientation
      The ORCID identification number(s) for the author(s) of this article
      can be found under https://doi.org/10.1002/admi.202100163.
                                                                             has been developed by means of a polarization treatment at
                                                                             high temperature, which has been denoted thermally-stimu-
DOI: 10.1002/admi.202100163                                                  lated polarization (TSP).[15–17] In this approach, the disorder is

Adv. Mater. Interfaces 2021, 2100163                              2100163 (1 of 10)                                        © 2021 Wiley-VCH GmbH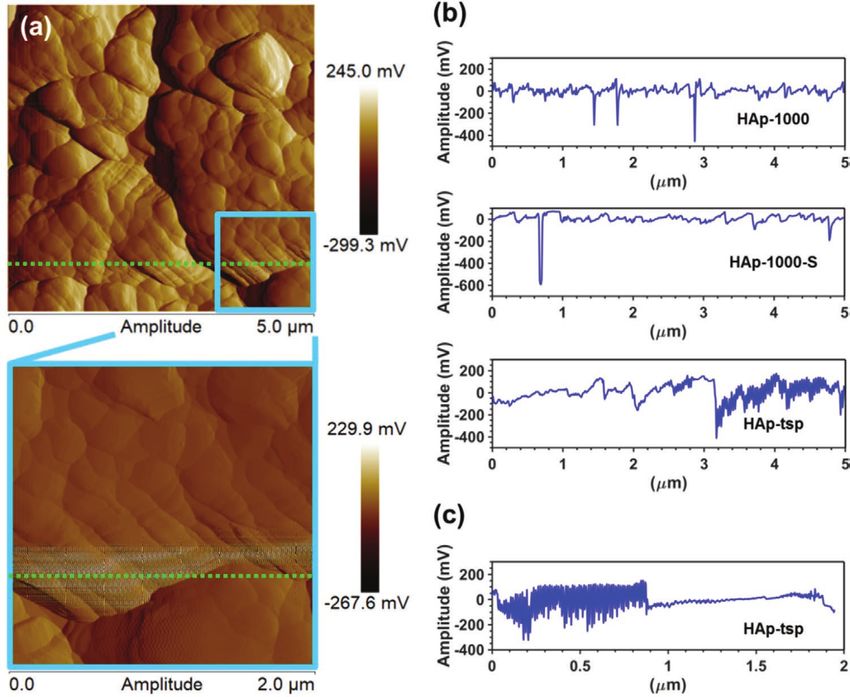
www.advancedsciencenews.com
www.advmatinterfaces.de
reduced and the OH− columns act as quantum pathways for 2. Results and Discussion
drastically increased electron transport, creating space charge
accumulation at the crystal grain boundaries.[10,18] In a recent 2.1. Effect of Time and Temperature on Vacancies Generation
study, we reported for the first time a highly stable and perm
anently polarized HAp with considerably enhanced electrical Structural characterization of calcined samples is challenging, as
properties at room temperature, proving that the conditions it involves changes in the crystallinity and lattice modifications,
of voltage and temperature applied during the TSP treatment normally measured by wide angle X-ray diffraction (WAXD) or
were crucial.[16] Although the effect of the TSP treatment neutron diffraction. However, we recently demonstrated that
on HAp has been studied in terms of bulk by analyzing the Raman microscopy is a useful technique to quantify the relative
resultant enhanced electrical properties,[10,15,16,18,19] fundamental amount of OH− groups in HAp and to measure interesting crystal
studies on the evolution of the OH− ions after both dehydration lattice parameters, such as crystallinity or phase distribution.[12]
process and TSP treatment have not been reported yet. This is Raman spectra of noncalcined HAp samples (HAp-25)
an important drawback for optimizing the TSP process para and calcined at 1000 °C (HAp-1000), which are displayed in
meters and for demonstrating experimentally those previously Figure 1a, exhibit the characteristic HAp peaks that correspond
hypothesized mechanisms about the spatial orientation of the to the PO vibrations at ν1 = 962 cm−1, ν2 = 400–480 cm−1,
OH− groups and their implications on the electrical properties. ν3 = 570–625 cm−1, and ν4 = 1020–1095 cm−1, and the stretching
Direct observation and characterization of OH− dipoles are vibration of νOH at 3574 cm−1.[21] This work focuses on
complex issues, which have only been addressed experimen- monitoring the evolution of the OH− groups and, therefore,
tally considering dielectric relaxations.[20] In this work, for the the 532 nm laser has been employed. This is because the
first time we successfully link the electrical properties of HAp 532 nm laser enhances the sensitivity of the hydroxyl vibration
with the direct experimental measurements of OH− groups. in comparison to the standard 785 nm laser (Figure S1, Sup-
Thus, optimization and discernment of critical parameters, porting Information). However, the utilization of the 532 nm
such as the generation of vacancies and the crystallinity, have laser easily promotes fluorescence and phosphorescence phe-
been studied to elucidate the mechanism behind the TSP treat- nomena, causing a lowering of the signal to noise ratio, as is
ment. Additionally, we present atomic force microscopy (AFM) illustrated in Figure S2 (Supporting Information) for HAp-25.
as a suitable technique for characterizing the nanosurface Complementary Fourier transform infraRed (FTIR) studies
after TSP treatment. Finally, the implications of the TSP treat- (Figure S3, Supporting Information) revealed the presence of
ment in the catalytic activity of permanently polarized HAp are carbonates (well-defined bands at 1330, 1420, and 1648 cm−1)
discussed. and water (wide band at 3400 cm−1),[22] which are responsible
Figure 1. a) Raman spectra of HAp-25 and HAp-1000 samples using the 532 nm laser for ν-OH enhancement. Magnification of the regions comprised
between b) 3550–3600 cm−1 (ν-OH) and c) 940–980 cm−1 (ν1). Magnified spectra were used to evaluate IOH, AOH, FWHM, and FWHMOH.
Adv. Mater. Interfaces 2021, 2100163 2100163 (2 of 10) © 2021 Wiley-VCH GmbH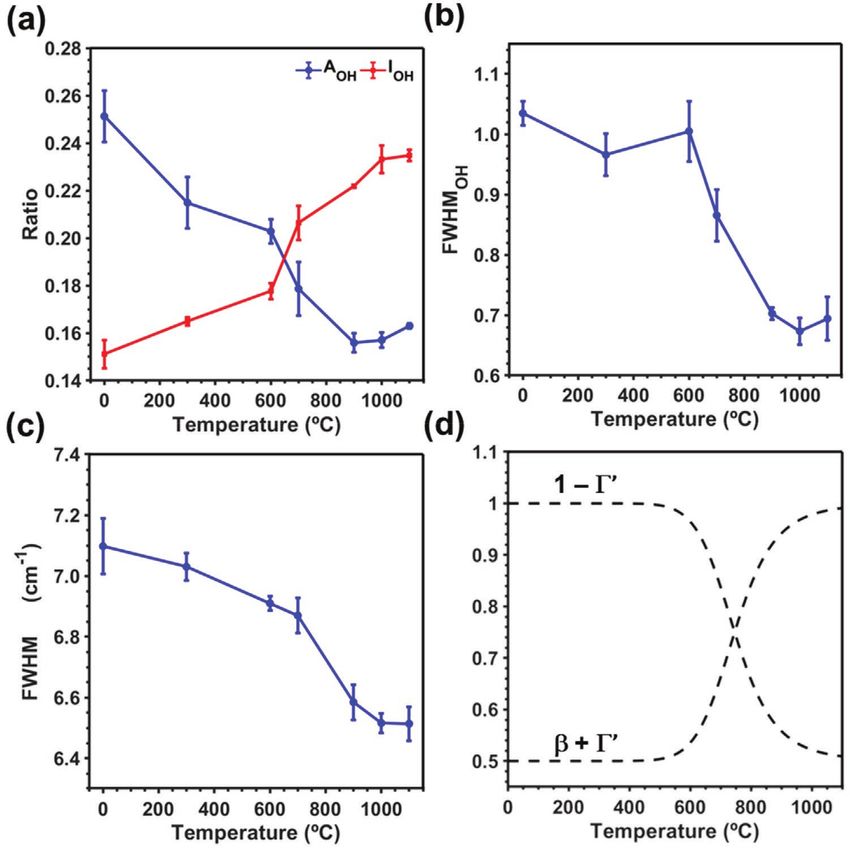
www.advancedsciencenews.com
www.advmatinterfaces.de
for the above mentioned phenomena. These species completely Consistently, the ratio between the intensity of the 3574 and
evaporate during the calcination treatment, explaining the 962 cm−1 peaks (IOH) increases from 0.16 to 0.23 due to the
optimum signal to noise ratio observed for HAp-1000. Careful total energy conservation, although the final difference between
inspection of the νOH (Figure 1b) and ν1 (Figure 1c) regions the intensities decreases as a result of the vacancy generation.
in the Raman spectra confirms the generation of OH− vacan- Finally, the presence of other calcium phosphate salts, which
cies and the increment of crystallinity due to the calcination is usual in samples prepared by chemical precipitation, is
treatment. Indeed, the hydroxyl content (AOH), which was not detected, as they appear in the form of a shifting or split-
determined as the ratio of the integrated peaks at 3574 and 962 ting of the ν1 main peak.[22,23] Accordingly, the prepared sam-
cm−1, decreased from 0.25 for HAp-25 to 0.16 for HAp-1000. ples are highly pure in HAp content. In order to generalize
The crystallinity was determined from the variation of the this effect, HAp presenting distinct degrees of crystallinity
full width at half maximum (FWHM) of the main peak ν1, has been analyzed (Figure S4 and Table S1, Supporting Infor-
which is 7.1 and 6.5 cm−1 for HAp-25 and HAp-1000, respec- mation), obtaining similar behaviors (Figure S5, Supporting
tively. A narrowing of all peaks is expected when the crystal- Information).
linity is enhanced. This is reflected for HAp-1000, in which all Figure 2a–c shows the structural characterization of calcined
the vibrational modes are well-resolved, including the OPO HAp as a function of the calcination temperature. The genera-
bending vibration ν4 at 1076 cm−1. However, the ratio between tion of vacancies (AOH) and the crystallinity (IOH, FWHMOH,
the FWHM of the 3574 and 962 cm−1 peaks (FWHMOH) is not and FWHM) increase progressively with the calcination tem-
maintained for HAp-25 and HAp-1000 samples, presenting a perature. The optimum calcination temperature is 900 and
slight decrease for HAp-1000 (i.e., 1.1 and 0.7 for HAp-25 and 1000 °C for the generation of vacancies and crystallinity, respec-
HAp-1000, respectively). This indicates that the remaining tively. Moreover, two different regimes are clearly observed
OH− groups have fewer defects than the rest of the species. as a function of calcination temperature interval, suggesting
Figure 2. Study of the vacancies generation and the crystallinity as a function of the calcination temperature: a) AOH and IOH ratio; b) FWHMOH ratio;
and c) FWHM related to the general crystallinity of the HAp crystal lattice. d) Results derived from the theoretical model proposed for the forced
OH− emission. The threshold temperature is predicted to be at ≈600 °C. The error bars correspond to the standard deviations of three independent
experiments.
Adv. Mater. Interfaces 2021, 2100163 2100163 (3 of 10) © 2021 Wiley-VCH GmbH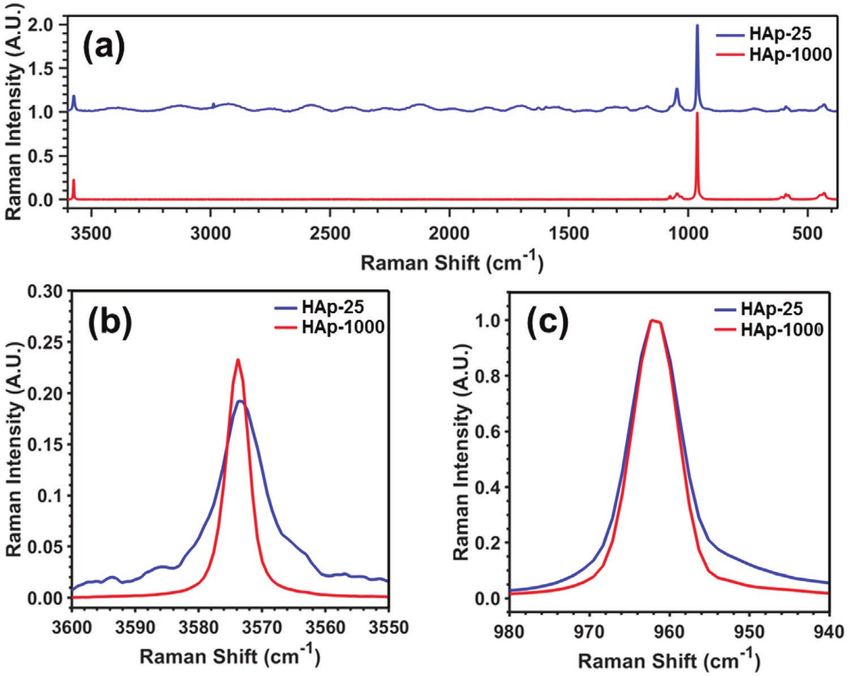
www.advancedsciencenews.com
www.advmatinterfaces.de
the existence of two different phenomena. For calcination the number of vacancies, and 4) the water vapor pressure does
temperatures up to 600–700 °C all the analyzed parameters not depend on the temperature;[11] which are in contradiction
present a linear behavior, whereas a discontinuity followed by with the results presented here and found in the literature.[9]
an exponential decreasing regime appears at higher tempera- In order to overcome this limitation, minor modifications have
tures. Vacancies in the crystal lattice act as reversal points from been made as follows
which OH− groups can reorient, minimizing their electrostatic
forces and leading to further stabilization of the HAp hexagonal Γ′ ≡ β Γ (5)
phase.[14,24] Accordingly, it is reasonable to assume that the gen-
eration of vacancies is energetically favored and increases the A OH , FWHM, FWHMOH ∝ 1 − Γ ′ (6)
crystallinity until the number of reversal points in the lattice is
high enough to compensate the steric forces. I OH ∝ β + Γ ′ (7)
The OH− groups experience small changes in their orien-
tation when the calcination temperature is ≤600 °C, as is evi- where β corresponds to the maximum fraction number of
denced in Figure 2b by slope close to zero observed for the pro- vacancies that the HAp lattice can support without losing its
file representing FWHMOH against the calcination temperature. structural integrity, which has been measured to be 50% per
Moreover, the regime obtained for calcination temperatures mol (β = 0.5).[26] The rest of parameters used, including PH2O
≤ 600 °C exhibits a poor linear fitting, which has been attributed to that has been assumed to behave as an ideal gas, can be found
the fact that only the OH− groups close to the generated reversal in the Supporting Information.
points can adopt favorable orientations. Figure 2c indicates that Results depicted in Figure 2d, which represent the variation
such small changes in the orientation of the OH− groups result of 1−Γ′ and β+Γ′ against the calcination temperature, are in
in a constant increment of the crystallinity, as is shown by the good accordance with the experimental measurements obtained
linear reduction of FWHM up to 600 °C. A higher energetic for the forced emission, reflecting similarities in regards of the
threshold, which is defined by the specie involved (i.e., OH− or threshold temperature of 600 °C. The theoretical model pre-
PO43−), is required for further lattice refinements. This depend- dicts that the contribution of the forced OH− emission before
ence on the specie is reflected by the fact that the FWHM the temperature threshold can be considered as negligible
threshold is 100 °C higher than the FWHMOH one. Hence, and, therefore, the two steps of the proposed mechanism can
we propose a two-step mechanism regarding the HAp crystal be well differentiated. In addition, the effect of the duration of
refinement in terms of generation of vacancies and crystallinity calcination treatment at 1000 °C was analyzed using different
enhancement: 1) favored OH− emission up to 600 °C, which is calcination times (i.e., 30 min, 1, 3, and 5 h). Results clearly
a fast and energetically favored process due to the abundance indicated that both crystallinity and generation of vacancies
of such species; and 2) forced OH− emission at temperatures are not related to the lapse of time under treatment (Figure S6
higher than 600 °C, which requires energy to overcome steric and Table S2, Supporting Information).
forces. The change in the trend observed for the OH− species Generation of vacancies creates an electrical imbalance of
at 1100 °C anticipates the thermal decomposition of HAp into species, which should be reflected by an enhancement of the
other calcium phosphate salts. This is no longer related to the superficial charge of the HAp crystals. The evolution of the sur-
crystal refinement process under study. face charge, as a function of the calcination temperature, was
A theoretical model for the forced emission step, which determined by means of ζ-potential measurements. Figure 3a
assumes equilibrium between the amount of generated represents the variation of the ζ-potential measured at pH = 7,
vacancies (Γ) and the water vapor pressure (PH2O) is proposed, showing the unequivocal effect of crystal refinement. Although
following the expressions early stated by Anderson et al.[25] and at 600–700 °C the ζ-potential presents the characteristic dis-
later used by Fujimori et al.[11] continuity found in the Raman spectra, the fact that the max-
imum difference in the ζ-potential (Δξ = −20 mV) is reached at
2OH− O2− ( s ) + Γ( s ) + H2O( g ) (2) 1000 °C confirms that both AOH and FWHM contribute to the
superficial charge accumulation. Nonetheless, the variation of
Thus, the equilibrium constant at a temperature T is defined the ζ-potential against the number of vacancies, expressed as
as the AOH ratio, is displayed in Figure 3b. Despite the relatively
low accuracy of ζ-potential measurements and the fact that at
O2− [Γ ] PH2O Γ 2PH2O high temperatures the crystallinity plays a significant role, an
K (T) = = (3) outstanding linear behavior is observed. On the other hand,
(2 − 2Γ )
2 2
OH
−
Figure 3c depicts the variation of ζ-potential measurements for
HAp-25, and HAp-1000 against the pH, while Figure S7 (Sup-
∆S 0 ∆H 0 porting Information) provides the results for samples calcined
K ( T ) = exp exp − (4) at 300, 600, 700, and 1100 °C. As is shown, the crystal lattice
R RT
refinement causes significant changes in the accumulation of
where ΔS0 and ΔH0 are the standard entropy and enthalpy, negative surface charge for a wide range of pH, reflecting that
respectively, and R is the gas constant. Although this model vacancies favor the dominance of negatively charged species
contemplates the existence of a threshold temperature over Ca2+ ions at the surface.
(Equation (3)), it considers that: 1) the reaction is fully reversible, As a proof of concept, the ζ-potential of the sample obtained
2) 100% of vacancies can be generated, 3) IOH is only affected by by applying the TSP process (i.e., compressing powdered
Adv. Mater. Interfaces 2021, 2100163 2100163 (4 of 10) © 2021 Wiley-VCH GmbH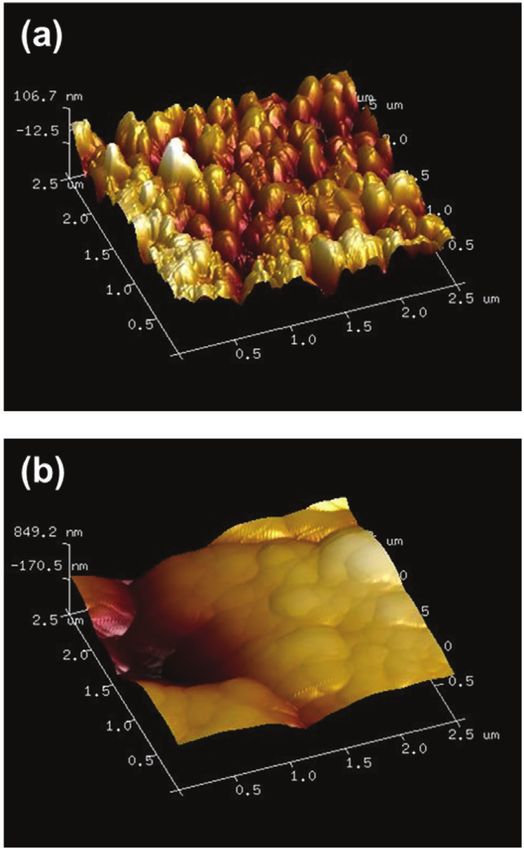
www.advancedsciencenews.com
                                                                                                                                www.advmatinterfaces.de

Figure 3. a) Evolution of the ζ-potential at pH = 7 as a function of the calcination temperature. b) Variation of the ζ-potential against the generation
of vacancies (AOH). The linear fitting is highlighted in green dotted line. c) Variation of the ζ-potential versus pH in the 4–12 interval for HAp-25, HAp-
1000, and HAp-tsp samples. The error bars correspond to the standard deviations of three independent experiments.


HAp-1000 into pellets and exposing them to a 500 V at 1000 °C                  µ = [α ] E                                                     (8)
for 1 h), hereafter denoted as HAp-tsp, were also measured.

Amazingly, the results plotted in Figure 3c do not show the                    where µ , E , and [α] represent the dipole moment of the
expected substantial enhancement of the surface charge with                    molecule, the electric vector of the incident light and the polar-
respect to the HAp-1000 sample. Indeed, the ζ-potential of                     izability tensor, respectively. This technique has allowed the
HAp-tsp is less negative than that of HAp-1000. This observa-                  use of polarized light for the successful study of the molecular
tion is apparently contradictory with the experimental results                 orientation in polymers[27] and graphene.[28] The polarizability
reported up to the date[15,16] since extra charge accumulation in              tensor must be understood as a unique volume surrounding
the crystal boundaries is not detected.[10] Therefore, in depth                and correspondingly aligned with each bond, which is going
revision of the polarization mechanisms arising from the elec-                 to weight (when expressed in the same coordinates through
trical enhanced properties by direct measurements and careful                  Euler angles) the contributions of the incident light on the
characterization is mandatory. Moreover, the fact that the                     final dipole moment. Thus, proper selection of the polarization
ζ-potential values at pH = 7 are very similar for both samples                 of the incident beam allows controlling the scattered intensity
(−20.9 and −19.6 mV for HAp-1000 and HAp-tsp, respectively)                    of each molecule. In this work, a similar approach with unpo-
indicates that no extra vacancies have been generated during                   larized light has been considered, due to equipment require-
the TSP process. This point is carefully assessed in Section 2.2.              ments, assuming that: 1) HAp-1000 presents OH− groups
                                                                               pointing to unspecific directions; 2) the weight contribution
2.2. TSP Treatment: Vibrational Studies                                        of the polarizability tensors will be maximal when the incident
                                                                               light is unpolarized; 3) for HAp-tsp samples, part of the OH−
Raman microscopy relies on the differential polarizability of                  groups are pointing toward a specific direction; and 4) the final
bonds, which is induced by the vector electric field of the inci-              induced dipole moment will be lowered because of the cor-
dent beam                                                                      responding projections of the weights of [α]. Hence, the final

Adv. Mater. Interfaces 2021, 2100163                               2100163 (5 of 10)                                              © 2021 Wiley-VCH GmbH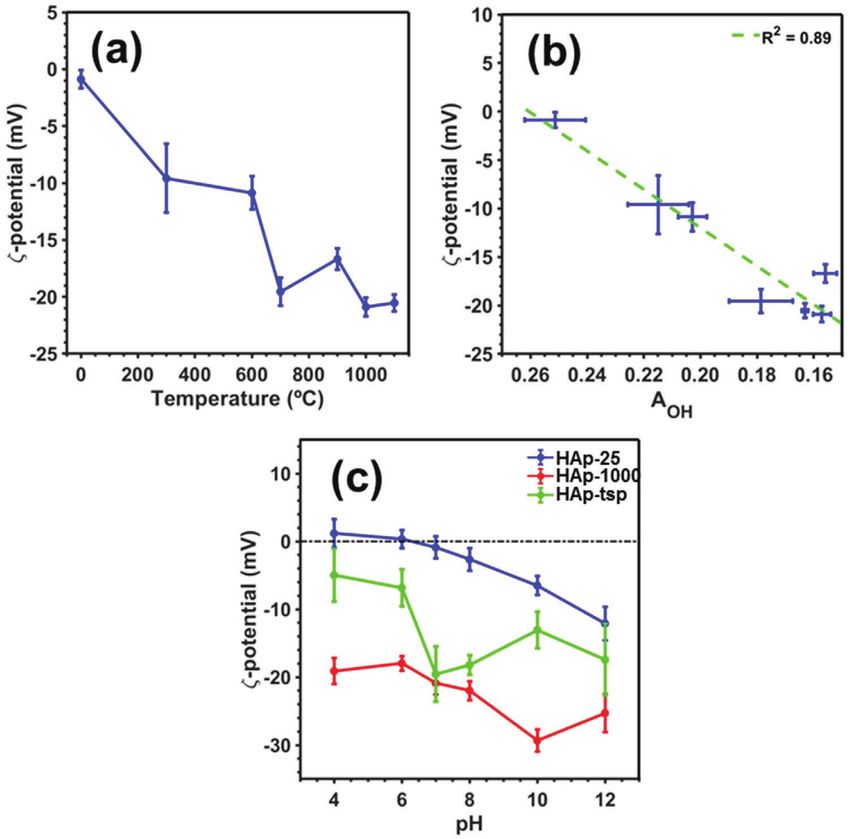
www.advancedsciencenews.com
www.advmatinterfaces.de
worth noting that the analysis of all samples was performed
using the same pellet (i.e., prepared with the same compressed
HAp-1000 powder) to ensure good comparison. Then, the pellet
was 1) trenched and compressed again (HAp-tsp-T), and 2)
sintered at 1000 °C for 2 h (HAp-tsp-TS). Comparison of the
spectroscopic results obtained for HAp-tsp, HAp-tsp-T, and
HAp-tsp-TS, which are included in Figure 4, indicates how IOH
increases from 0.15 for HAp-tsp to 0.20 and 0.21 for HAp-tsp-T
and HAp-tsp-TS respectively, without reaching the 0.22 of HAp-
1000. This was attributed to the fact that despite of conserving
the specific dipole orientation at the crystal grain level, the gen-
eral microspecific orientation was lost.
It is worth noticing how this recovery supports the fact that
the observed variations in IOH and AOH are due to the orien-
tation of the dipoles since restoration of vacancies is not pos-
Scheme 1. Approach used for the direct measurement of the reorienta- sible at 1000 °C. These results not only allow the definition of
tion of OH− groups using unpolarized light. Green clouds simulate the
an effective yield of polarization by means of a fast and low cost
Raman tensors.
technique but also, and in combination with the ζ-potential
measurements, suggest that the enhanced electrical properties
IOH is expected to decrease with increasing amount of OH− reported in the literature are due to bulky aspects rather than
groups pointing toward a specific direction (fundamentals are local crystallographic space charge accumulation. This feature
described in the Supporting Information). These assumptions opens a new perspective in regards of the mechanism proposed
have been schematically depicted in Scheme 1. by Yamashita and co-workers,[10] indicating that the polarization
Figure 4 presents the complete analysis of the Raman spectra of early formed HAp particles in the micrometric or submicro-
recorded for HAp-1000 and HAp-tsp samples. As expected, a metric range is preferred in order to enhance the effect of the
considerable difference is observed in the IOH due to the spe- polarization.
cific orientation of the OH− exerted by the TSP treatment,
presenting for the first time a direct evidence of such orienta-
tion. Accordingly, the crystallinity did not show any substan- 2.3. Electrical Characterization
tial change and the lower value of AOH was not attributed to
the generation of new vacancies (also shown by the ζ-potential Precise measurements in the micrometric/nanometric scale
results) but to the lowering of the measured intensity (i.e., time lengths are desirable to prove the conclusions reached in
of exposure at 1000 °C did not affect the crystal lattice of HAp, Sections 2.1 and 2.2. Indeed, a crucial point is to determine
as demonstrated in Figure S5, Supporting Information). It is whether charge accumulation is achieved through the TSP
treatment and at what level. Although AFM is normally used for
characterizing the sample topography, the metallic nature of the
cantilever is expected to detect variations in its tapping regime
due to electrostatic forces caused by the charge accumulation
on the surface. Initially, a topographic characterization of the
samples was performed, the 3D reconstructed surface images
of HAp-1000 and HAp-tsp pellets are depicted in Figure 5a,b.
HAp-1000 pellets are formed by grains in the size range of 100–
300 nm, which tend to agglomerate forming particles up to 1 µm.
For HAp-tsp pellets, the effect of sintering on these particles is
clearly observed, which is attributed to the fact that, during the
TSP treatment, the pellet has been exposed at 1000 °C. Thus,
the root-mean-square roughness (Rq) of HAp-tsp (Rq = 46.2 ±
9.4 nm) is considerably lower than that of the former (Rq =
367 ± 82 nm).
In order to ascertain if the results of the TSP treatment could
be reproduced without applying the electric voltage, a HAp-1000
pellet was sintered for 2 h at 1000 °C, the resulting sample being
denoted as HAp-1000-S. With the intention of characterizing the
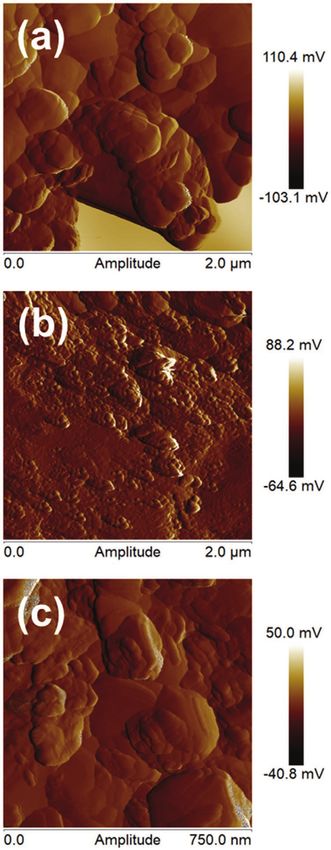
appearance of space charge accumulation, amplitude images of
the electric signal controlling the cantilever for HAp-1000, HAp-
Figure 4. Comparison of the parameters derived by Raman spectroscopy
1000-S, and HAp-tsp were compared. Figure 6a displays a repre-
(AOH, IOH, FWHMOH, and FWHM) for HAp-1000, HAp-tsp, HAp-tsp-T, sentative 5 × 5 µm2 amplitude image for HAp-tsp, while images
and HAp-tsp-TS samples. The error bars correspond to the standard for HAp-1000 and HAp-1000-S are shown in Figure S8 (Sup-
deviations of three independent experiments. porting Information). HAp-tsp exhibits pronounced electrostatic
Adv. Mater. Interfaces 2021, 2100163 2100163 (6 of 10) © 2021 Wiley-VCH GmbH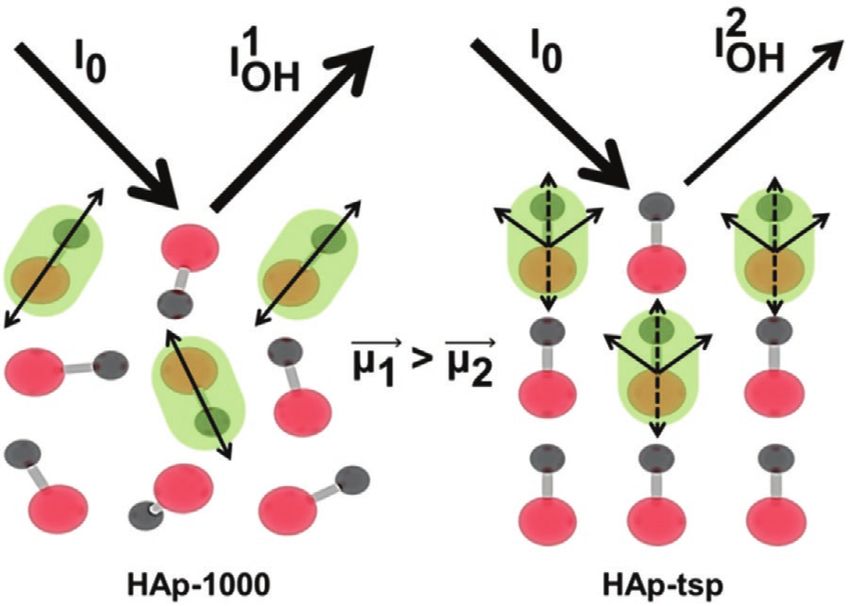
www.advancedsciencenews.com
www.advmatinterfaces.de
The sintering process restricts the charges at the crystalline
domains, disfavoring charge accumulation in the grain bounda-
ries. In order to elucidate the importance of this contribution
with respect to the ordering of the OH− groups, AFM meas-
urements were performed on HAp-1000-S and HAp-tsp-T sam-
ples considering smaller windows. Representative images dis-
played in Figure 7a,b indicate that charge accumulation is again
observed in the grain boundaries for both samples. Although
sintering seems to play a major contribution (HAp-1000-S
shows higher charge accumulation), it has to be taken into
account that the huge difference in grain sizes reduces consid-
erably the maximum number of charges available in the HAp-
tsp-T grains (Figure 7c). Overall, it can be stated that imposing
a specific orientation results in favoring the quantum electric
pathways through the different crystalline domains, while sin-
tering increases the number of available charges generated by
the presence of OH− vacancies in the crystal lattice (i.e., due
to the bigger size of the crystalline domains). In any case, the
synergy between both effects produces unequivocally a much
higher electrical enhancement for HAp-tsp pellet, which is in
full agreement with the experimental measurements presented
here.
All in all, in this work we provide direct experimental evi-
dences about the fact that the charge accumulation associ-
ated to the TSP treatment does not occur in the crystalline
domains. This observation is in opposition with previously
hypothesized mechanisms.[10,15] More specifically, our results
demonstrate that the TSP treatment allows the delocalization
of the charges generated by the induced OH− vacancies, which
move across different crystalline domain and accumulate in
the crystal boundaries. Although the generation of vacancies
Figure 5. 3D topographic AFM image (2.5 × 2.5 µm2) of a) HAp-1000 and and the increase of crystallinity affect the electrical properties
b) HAp-tsp pellets. of HAp at the crystal lattice level, the TSP is mainly associated
to the bulk of the micrometric particles. Indeed, together with
distortions, which are mainly located at the boundaries among the intrinsic sintering of the TSP treatment, we prove that the
the microscopic grains, this effect being much more attenu- polarization of samples with preformed HAp micrometric par-
ated for HAp-1000 and HAp-1000-S. Cross section data, which ticles is preferred for producing HAp with enhanced electrical
are presented in Figure 6b for the three samples, allow to dis- properties.
tinguish the characteristic distortion in form of high-frequency
vibration on the cantilever due to the charge accumulation in
HAp-tsp. The fact that this kind of vibration does not appear 2.4. Implications of the TSP in the Catalytic Activity
continuously along the cross section, together with the presence
of perpendicular ones, discards the existence of artifacts caused The utilization of HAp-based catalysts for the electro-photo
by the cantilever during the measurement. synthesis of glycine (Gly) and alanine (Ala) amino acids by
These results indicate that the TSP treatment generates sur- carbon and nitrogen fixation from CH4, CO2, and N2 under
face charge accumulation at the micrometric grain bounda- mild reaction conditions has been reported recently.[7,29] In
ries rather than in the crystal domains. Such accumulation is the present study, we show that the catalytic activation of this
spontaneously created by the generation of vacancies, as proved reaction is strongly dependent on the electrical enhancement
by ζ-potential measurements. It is important to highlight of HAp achieved by the TSP treatment. More specifically, Gly
how imposing a specific orientation in all the crystal domains and Ala were produced using a reactor with an inert reaction
allows the delocalization of the charges along the whole crystal, chamber (120 mL), in which the catalyst (≈150 mg) and water
drastically increasing its surface charge. Hence, the bigger (0.5 mL) were incorporated, and a UV lamp (253.7 nm) pro-
the microscopic grain, the higher the contribution of charges tected by a UV transparent quartz tube to irradiate the catalyst.
to the boundary. This effect can be observed in the magnified Reactions were performed at an initial pressure of 6 bar, which
image included in Figure 6a and its corresponding cross sec- was reached by introducing sequentially 2 bar of each feeding
tion (Figure 6c). These results provide understanding to the reaction gas (i.e., N2, CO2, and CH4), and at 95 °C. The reac-
ζ-potential results displayed in Figure 3c, which showed that tion time was 48 h in all cases and the reaction products were
the average value of HAp-1000 is more negative than that of analyzed by 1H NMR spectroscopy. All experimental details are
HAp-tsp one. provided in the Supporting Information.
Adv. Mater. Interfaces 2021, 2100163 2100163 (7 of 10) © 2021 Wiley-VCH GmbH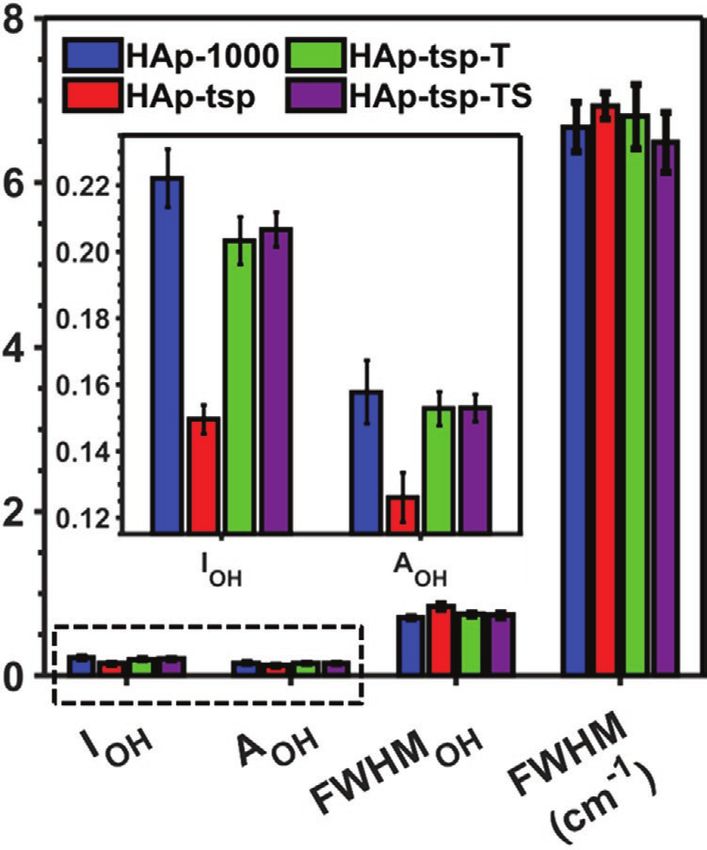
www.advancedsciencenews.com
                                                                                                                          www.advmatinterfaces.de

Figure 6. a) 2D amplitude AFM images (5 × 5 and 2 × 2 µm2) of HAp-tsp used to characterize the space charge accumulation by following the ampli-
tude of the voltage applied in the cantilever. b) Representative cross section data obtained for HAp-1000, HAp-1000-S, and HAp-tsp, which have been
taken from the 5 × 5 µm2 amplitude images Figure 6a; and Figure S8 (Supporting Information). c) Cross section data obtained for HAp-tsp using the
2 × 2 µm2 amplitude image displayed in (a).

   In this work, HAp-tsp or HAp-tsp-T, which were coated with              arise from two different and distinguishable phenomena:
zirconyl chloride and aminotris(methylenephosphonic acid)                  1) the generation of vacancies inside the HAp lattice, which is
using a previously described process (see the Supporting Infor-            responsible for creating available charges, due to the calcina-
mation),[29] were used as catalysts. The efficiency of such two            tion treatment; and 2) the specific orientation of the ions in the
catalysts, which was analyzed in terms of Gly and Ala yield, is            OH− columns (TSP treatment) that allows the delocalization of
compared in Figure 8. As it can be seen, the yield of amino                charges along all the independent crystalline domains of the
acids decreased one order of magnitude when the HAp-tsp                    HAp particles, and as a consequence, reinforcing the charge
catalyst was replaced by the HAp-tsp-T one. More specifically,             accumulation at the micrometric scale, particularly at grain
the yield of Ala and Gly was ≈85% lower for HAp-tst-T than for             boundaries. Although most of the fundamentals proposed in
HAp-tsp. This fact clearly indicates that the charge accumula-             the literature have been for the first time experimentally cor-
tion plays a crucial role in the reaction, supporting the mecha-           roborated, the discrimination between crystal lattice (calcina-
nism proposed in this work. Additionally, this result stresses             tion) and bulk effects (TSP) has been introduced. Therefore, for
the importance of controlling the micrometric geometry of the              the calcination treatment, the amount of generated vacancies
HAp-based catalysts before, rather than after, the TSP treat-              significantly increases after 600 °C, the optimal value being
ment. Hence, the utilization of powdered structures (mainly                reached at 1000 °C. Moreover, the size and ordering of grain
used for continuous reactions) is expected to diminish the yield           particles favoring the initial sintering process are important for
of the reaction (as seen for HAp-tsp-T) despite of the increase            the posterior TSP treatment. Moreover, the proposed model has
of the exposed surface.                                                    demonstrated to have a direct impact in the catalytic properties
                                                                           of HAp-tsp, corroborating that charge accumulation is mainly
                                                                           located at the boundaries among the microscopic grains. The
3. Conclusion                                                              unprecedented possibility of relating the presence and orienta-
                                                                           tion of OH− groups with the final electrical properties of HAp
Raman microscopy has been shown to be a useful and efficient               by means of Raman microscopy and AFM techniques not only
technique for the precise characterization of the OH− groups               paves the way for further optimization of polarized ceramics,
after both calcination and TSP treatments. The combination of              but also provides a powerful tool for the design and characteri-
Raman microscopy and AFM, as a novel approach, allows us                   zation of the next generation of electrically tuned calcium phos-
to state that the enhanced electrical properties of HAp crystals           phate minerals.

Adv. Mater. Interfaces 2021, 2100163                           2100163 (8 of 10)                                            © 2021 Wiley-VCH GmbH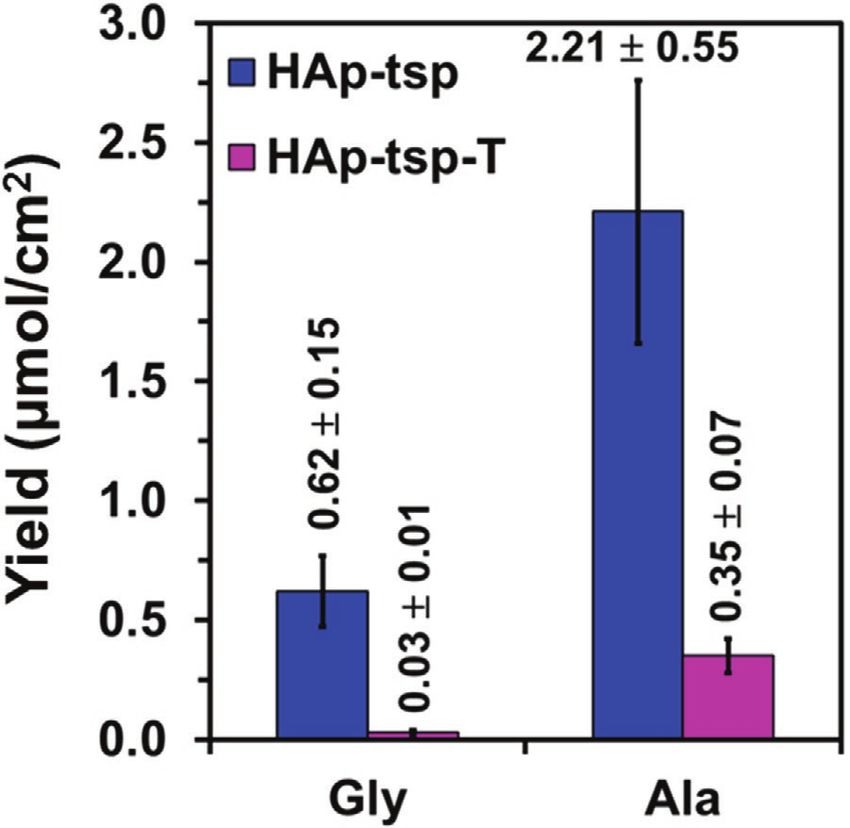
www.advancedsciencenews.com
                                                                                                                            www.advmatinterfaces.de

                                                                            Figure 8. Yield of Ala and Gly, expressed in µmol of product per area of
                                                                            the catalyst (cm2), for the reactions performed with HAp-tsp and HAp-
                                                                            tsp-T catalysts. The error bars correspond to the standard deviations of
                                                                            three independent experiments.

                                                                            Other configurations regarding trenching or resintering of the samples
                                                                            are explicitly explained. All measurements on calcined and TSP samples
                                                                            were conducted at room temperature.
                                                                               Characterization of the Samples: InVia Qontor confocal Raman
                                                                            microscope (Renishaw), equipped with a Renishaw Centrus 2957T2
                                                                            detector was used for structural characterization of HAp. A 532 nm laser
                                                                            (unless specified) was selected, measuring the average of 4 × 4 grids for
                                                                            each sample in order to ensure obtaining representative data. Zeta (ζ)-
                                                                            potential measurements were carried out in a NanoBrook 90Plus Zeta
                                                                            equipped with an AQ-1321. Finally, AFM images were acquired with a
                                                                            Molecular Imaging PicoSPM and a NanoScopIV controller, under ambient
                                                                            conditions. Specific details are provided in the Supporting Information.

                                                                            Supporting Information
                                                                            Supporting Information is available from the Wiley Online Library or
                                                                            from the author.

                                                                            Acknowledgements
Figure 7. 2D amplitude AFM images of a) HAp-1000-S (2 × 2 µm2),
b) HAp-tsp-T (2 × 2 µm2), and c) HAp-tsp-T (750 × 750 nm2) pellets.         The authors acknowledge MINECO-FEDER (No. RTI2018-098951-B-I00),
                                                                            Agència de Gestió d’Ajuts Universitaris i de Recerca (No. 2017SGR359), and
4. Experimental Section                                                     B. Braun Surgical, S.A.U., and B. Braun Melsungen GmbH for their financial
                                                                            support, particularly Dr. Meinrad Lugan and Dr. Hans-Otto Maier.
   Synthesis of HAp: Highly crystalline HAp has been obtained following
a hydrothermal synthesis route, using (NH4)2HPO4 and Ca(NO3)2 as
starting reagents. After washing, the resulting HAp was frozen and
dried by means of lyophilization for 3 days. A white HAp powder was         Conflict of Interest
obtained. Complete description of the synthetic route is described in the
                                                                            Authors declare that the preparation and application of permanently
Supporting Information.
                                                                            polarized hydroxyapatite as catalyst was patented by the Universitat
   Calcination and TSP Processes: The calcination treatment was
                                                                            Politècnica de Catalunya and B. Braun Surgical S.A. (EP16382381,
performed using a Carbolite ELF11/6B/301 furnace, where the
                                                                            EP16382524, P27990EP00, PCT/EP2017/069437, P58656 EP).
synthesized HAp powder was exposed for 2 h to the desired
temperature. The following calcination temperatures were considered in
this work: 300, 600, 700, 900, 1000, and 1100 °C. The TSP process was
achieved by compressing powdered samples calcined at 1000 °C into           Data Availability Statement
pellets and, subsequently, exposing them to a 500 V at 1000 °C for 1 h.
Samples were allowed to cool down maintaining the voltage for 30 min.       Data available on request from the authors.

Adv. Mater. Interfaces 2021, 2100163                             2100163 (9 of 10)                                            © 2021 Wiley-VCH GmbH
www.advancedsciencenews.com
www.advmatinterfaces.de
Keywords [6] S. Hu, F. Jia, C. Marinescu, F. Cimpoesu, Y. Qi, Y. Tao, A. Stroppa,
W. Ren, RSC Adv. 2017, 7, 21375.
charge delocalization, electrocatalysts, hydroxyl orientation, thermally [7] M. Rivas, L. J. del Valle, P. Turon, C. Alemán, J. Puiggalí,
stimulated polarization, vacancies Green Chem. 2018, 20, 685.
[8] G. Revilla-López, J. Sans, J. Casanovas, O. Bertran, J. Puiggalí,
Received: January 30, 2021 P. Turon, C. Alemán, Appl. Catal., A 2020, 596, 117526.
Revised: March 17, 2021 [9] K. Yamashita, K. Kitagaki, T. Umegaki, J. Am. Ceram. Soc. 1995, 78,
Published online: 1191.
[10] N. Horiuchi, M. Nakamura, A. Nagai, K. Katayama, K. Yamashita,
J. Appl. Phys. 2012, 112, 074901.
[11] H. Fujimori, H. Toya, K. Ioku, S. Goto, Chem. Phys. Lett. 2000, 325,
[1] a) H. Li, D. B. Wu, J. Wu, L. Y. Dong, Y. J. Zhu, X. L. Hu, Adv. Mater. 383.
2017, 29, 1703548; b) M. Nakayama, S. Kajiyama, A. Kumamoto, [12] J. Sans, J. Llorca, V. Sanz, J. Puiggalí, P. Turon, C. Alemán, Langmuir
T. Nishimura, Y. Ikuhara, M. Yamato, T. Kato, Nat. Commun. 2018, 2019, 35, 14782.
9, 568; c) M. Harja, G. Ciobanu, Sci. Total Environ. 2018, 628–629, [13] A. J. Ruys, M. Wei, C. C. Sorrell, M. R. Dickson, A. Brandwood,
36; d) M. T. Hua, J. L. Song, C. Xie, H. R. Wu, Y. Hu, X. Huang, B. K. Milthorpe, Biomaterials 1995, 16, 409.
B. X. Han, Green Chem. 2019, 21, 5073; e) S. Wasthi, S. K. Pandey, [14] G. Ma, X. Y. Liu, Cryst. Growth Des. 2009, 9, 2991.
E. Arunan, C. Srivastava, J. Mater. Chem. B 2021, 9, 228. [15] N. Horiuchi, S. Nakaguki, N. Wada, K. Nozaki, M. Nakamura,
[2] a) G. Popescu-Pelin, C. Ristoscu, L. Duta, G. E. Stan, I. Pasuk, A. Nagai, K. Katayama, K. Yamashita, J. Appl. Phys. 2014, 116,
T. Tite, M. S. Stan, C. Bletou, M. Popa, M. C. Chifiriuc, F. N. Oktar, 014902.
A. Nicarel, N. Mihalescu, ACS Sustainable. Chem. Eng. 2020, 8, [16] M. Rivas, L. J. delValle, E. Armelin, O. Bertran, P. Turon, J. Puiggalí,
4026; b) T. S. Phan, A. R. Sane, B. Rêgo de Vasconcelos, A. Nzihou, C. Alemán, ChemPhysChem 2018, 19, 1746.
P. Sharrock, D. Grouset, D. P. Minh, Appl. Catal., B 2018, 224, 310; [17] C. Fu, K. Savino, P. Gabrys, A. Zeng, B. Guan, D. Olvera, C. Wang,
c) M. Frasnelli, F. Cristofaro, V. M. Sglavo, S. Dirè, E. Callone, B. Song, H. Awad, Y. Gao, M. Z. Yates, Chem. Mater. 2015, 27,
R. Ceccato, G. Bruni, A. I. Cornaglia, L. Visai, Mater. Sci. Eng. 1164.
C 2017, 71, 653; d) L. Yu, D. W. Rowe, I. P. Perera, J. Y. Zhang, [18] S. Nakamura, H. Takeda, K. Yamashita, J. Appl. Phys. 2021, 89, 5386.
S. L. Suib, X. N. Xin, M. Win, ACS Appl. Mater. Interfaces 2020, 12, [19] S. A. M. Tofail, D. Haverty, K. T. Stanton, J. B. McMonagle, Ferroelec-
18235; e) Y. Q. Tang, Q. Y. Wang, Q. F. Ke, C. Q. Zhang, J. J. Guan, trics 2005, 319, 117.
Y. P. Guo, Chem. Eng. J. 2020, 387, 124166; f) Y. Liu, Y. X. Tang, [20] N. Horiuchi, N. Wada, K. Nozaki, M. Nakamura, A. Nagai,
J. Wu, J. Sun, X. Liao, Z. G. Teng, G. M. Lu, J. Colloid Interface Sci. K. Yamashita, J. Appl. Phys. 2016, 119, 084903.
2020, 570, 402; g) K. W. Jung, S. Y. Lee, J. W. Choi, Y. J. Lee, Chem. [21] a) Z. Iqbal, V. P. Tomaselli, O. Fahrenfeld, K. D. Möller, F. A. Ruszala,
Eng. J. 2019, 369, 529. E. Kostiner, J. Phys. Chem. Solids 1977, 38, 923; b) V. Devarajan,
[3] a) A. J. Nathanael, D. Mangalaraj, N. Ponpandian, Compos. W. E. Klee, Phys. Chem. Miner. 1981, 7, 35.
Sci. Technol. 2010, 70, 1645; b) A. J. Nathanael, S. I. Hong, [22] S. Koutsopoulos, J. Biomed. Mater. Res. 2002, 62, 600.
D. Mangalaraj, N. Ponpandian, P. C. Chen, Cryst. Growth Des. [23] P. N. De Aza, F. Guitián, C. Santos, S. De Aza, R. Cuscó, L. Artús,
2012, 12, 3565; c) A. Joseph Nathanael, D. Mangalaraj, P. Chi Chen, Chem. Mater. 1997, 9, 916.
N. Ponpandian, J. Nanopart. Res. 2011, 13, 1841. [24] J. C. Elliott, P. E. Mackie, R. A. Young, Science 1973, 180, 1055.
[4] a) H. D. Kim, H. L. Jang, H. Y. Ahn, H. K. Lee, J. Park, E. S. Lee, [25] J. S. Anderson, M. W. Roberts, F. S. Stone, in Proceedings of the Sev-
E. A. Lee, Y. H. Jeong, D. G. Kim, K. T. Nam, N. S. Hwang, Biomate- enth International Symposium on the Reactivity of Solids, Chapman
rials 2017, 112, 31; b) P. Yu, R. Y. Bao, X. J. Shi, W. Yang, M. B. Yang, and Hall, London 1972, p. xvii.
Carbohydr. Polym. 2017, 155, 507; c) H. W. Tong, M. Wang, W. W. Lu, [26] H. Owada, K. Yamashita, T. Umegaki, T. Kanazawa, J. Ceram. Soc.
Nanomedicine 2013, 8, 577. Jpn. 1989, 97, 1087.
[5] a) M. Nakamura, H. A. N. Hori, S. Namba, T. Toyama, S. Nishimiya, [27] M. Tanaka, R. J. Young, J. Mater. Sci. 2006, 41, 963.
K. Yasmashita, Mater. Sci. Eng. C 2016, 62, 283; b) M. Rivas, [28] S. Sahoo, R. Palai, R. S. Katiyar, J. Appl. Phys. 2011, 110, 044320.
L. J. Valle, A. M. Rodriguez-rivero, P. Turon, J. Puiggali, C. Alemán, [29] J. Sans, E. Armelin, V. Sanz, J. Puiggalí, P. Turon, C. Alemán,
J. Puiggalí, C. Alemán, ACS Biomater. Sci. Eng. 2018, 4, 3234. J. Catal. 2020, 389, 646.
Adv. Mater. Interfaces 2021, 2100163 2100163 (10 of 10) © 2021 Wiley-VCH GmbHYou can also read