On the impact of the geospace environment on lithospheric processes
←
→
Page content transcription
If your browser does not render page correctly, please read the page content below
On the impact of the geospace environment on lithospheric processes

                                                                                    Dimitar Ouzounov1, Galina Khachikyan2, *
                                                           1
                                                               Center of Excellence in Earth Systems Science & Observations, Chapman University, CA, USA
                                                                                        2
                                                                                          Institute of Ionosphere, Almaty, Kazakhstan

                                                                                                    Abstract
                                                     We have found that about two months after creating a new radiation belt in the inner magnetosphere
arXiv:2108.13788v2 [physics.geo-ph] 31 August 2021

                                                     due to a geomagnetic storm, an increasing seismic activity may occur near the magnetic field lines'
                                                     footprint. For example, the Combined Release and Radiation Effects Satellite (CRRES) detected a new
                                                     radiation belt after a geomagnetic storm on March 24, 1991. Shortly after that, on May 30, 1991, a
                                                     strong M7.0 earthquake occurred in Alaska in the footprint of geomagnetic line L~2.69. Additionally,
                                                     on October 28, 2012, a strong M7.8 earthquake occurred in Canada near the footprint of L~3.3, which
                                                     was close to the magnetic lines of a new radiation belt detected by a satellite "Van Allen Probes" after
                                                     a geomagnetic storm on September 3, 2012. This work considers a geomagnetic conjugation between
                                                     the Antarctic lithospheric plate boundary in the southern hemisphere and the junction of platforms and
                                                     orogens in the northern hemisphere. We show that seismotectonic structures in the north and southern
                                                     hemispheres are located not arbitrarily but controlled by the geometry of the main geomagnetic field.
                                                                                                         .

                                                                                                    1. Introduction

                                                     Back in 1995, a new term, "Space Weather," was introduced into solar-terrestrial physics, and in 2011,
                                                     on the initiative of Prof. K. Yumoto (Kyushu University, Japan), the "Litho - Space Weather"
                                                     terminology was defined. In 2011, the first ISWI/MAGDAS School on Litho-Space Weather was
                                                     launched in Africa by publishing the Selected Papers (MAGDAS,2011). The research within the
                                                     framework of Litho - Space Weather is developing in two primary directions: (1) the influence of
                                                     lithospheric processes on geophysical fields and the geospace environment, and (2) the impact of the
                                                     geospace environment on geophysical fields and lithospheric processes. In the first direction, over the
                                                     last 30 years, the international community's cooperation led to the creation of the concept of
                                                     lithosphere-atmosphere-ionosphere-magnetosphere coupling (LAIC) about pre-earthquake processes
                                                     (Pulinets and Boyarchuk, 2004; Pulinets and Ouzounov, 2011; Ouzounov et al., 2018 and references
                                                     in herein). However, the second direction is still under debate (e.g., Love and Thomas, 2013) despite
                                                     many statistical results on the correlation between the geospace environment variations and earthquake
                                                     occurrence (e. g. Simpson, 1968; Zhang, 1998; Sobolev et al., 2001; Duma and Ruzhin, 2003; Han et
                                                     al., 2004; Huzaimy and Yumoto, 2011; Khachikyan et al., 2014; Marchitelli et al., 2020; Novikov et
                                                     al., 2020; Chen et al., 2020; and references in herein). In this work, we will present some new results
                                                     in the second direction.

                                                     * Correspondence: Galina Khachikyan, galina.khachikyan@gmail.com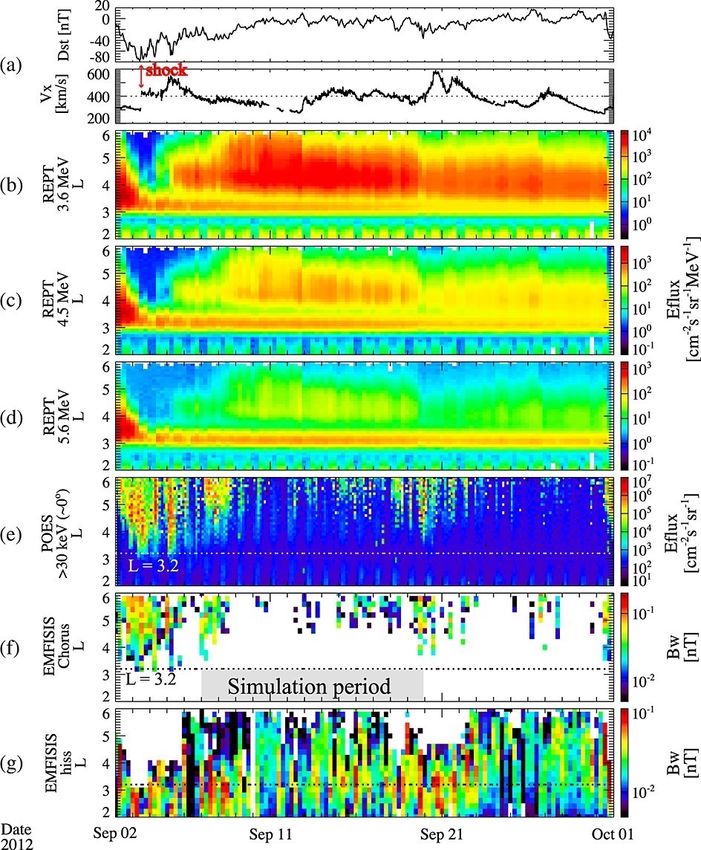
By addressing the broad scientific community, we would like to fill some existing gaps in two areas.
We show that there is a geomagnetic conjugation between the boundary of the Antarctic lithospheric
plate in the southern hemisphere and the zone of the junction of platforms and orogens in the northern
hemisphere, and it is especially pronounced between the south boundary of the Nazca lithospheric plate
and the boundaries of the north of the Cocos and Caribbean plates, which are located near the footprints
of geomagnetic field lines L= 1.2 – 1.5. We also show that about two months after creating a new
radiation belt in the inner magnetosphere due to a geomagnetic storm, a strong earthquake may occur
near the magnetic field lines' footprint belonging to a new radiation belt.
2. Geomagnetic conjugation between the boundary of the Antarctic lithospheric plate in
the southern hemisphere and the zone of the junction of platforms and orogens in the
northern hemisphere
The lithosphere is divided into a dozen major and several minor plates. Plates’ borders connect different
plates, those ones which are made of all oceanic lithosphere or all continental lithosphere as well. In
the southern hemisphere, the border of the Antarctic lithospheric plate connects with borders of
Australian, Pacific, Nazca, South American, Scotia, African, and Australian plate
(https://courses.lumenlearning.com/wmopen-geology/chapter/outcome-theory-of-plate-tectonics/).
Along the Antarctic plate border, the brightest tectonic structure: the mid-oceanic ridges are stretched.
Therefore, in (Khachikyan et al., 2013) the boundary of the Antarctic lithospheric plate was chosen to
check up a possible magnetic conjugation between lithospheric structures in the southern and northern
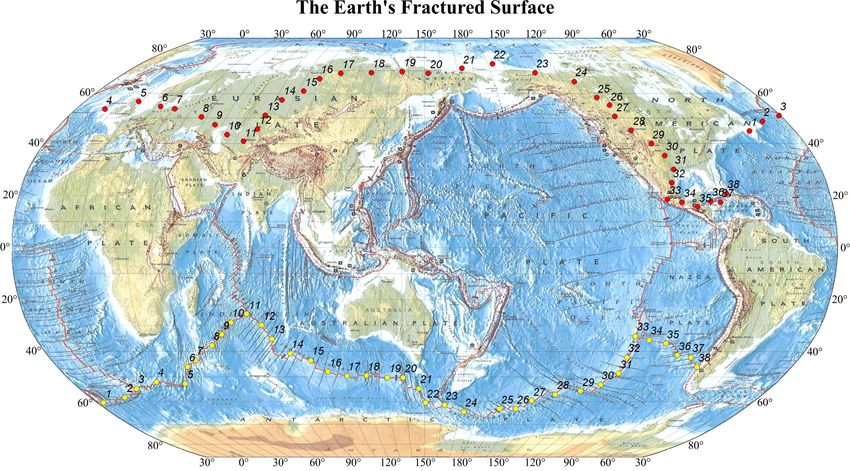
hemispheres. The coordinates of 38 points were determined, distributed relatively evenly along the
boundary of the Antarctic lithospheric plate (Figure 1 - yellow circles), and then the coordinates of
their magnetically conjugate points were determined (Figure 1 - red circles). Besides, for each of 38
points, the values of the McIlwain parameter (L) were calculated according to the ratio: L = R / Re,
where R is the distance from the center of the geomagnetic dipole to the point of the geomagnetic line
above the geomagnetic equator, Re is the Earth's radius. All calculations were carried out on the basis
of the international geomagnetic reference field model (IGRF) for the 2000 epoch
(http://www.ngdc.noaa.gov/IAGA/vmod/igrf.html) with using the computer codes of the GEOPACK
(Tsyganenko, 2008). Figure 2 shows the geomagnetic lines connecting each of the 38 points shown in
Figure 1.
2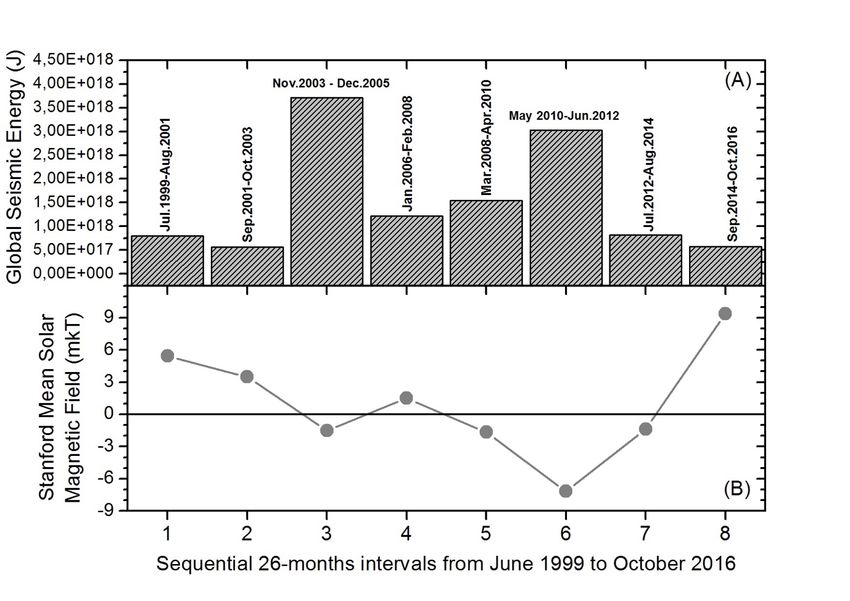
Figure 1. Locations of 38 sites in the southern hemisphere along the boundary of the Antarctic
lithosphere plate (yellow circles with corresponding numbers) and magnetically conjugated sites in the
northern hemisphere (red circles with corresponding numbers) were calculated for geomagnetic
conditions of 2000.

Figure 2. Geomagnetic field lines connecting magnetically conjugated sites shown in Fig 1.

                                                                                                   3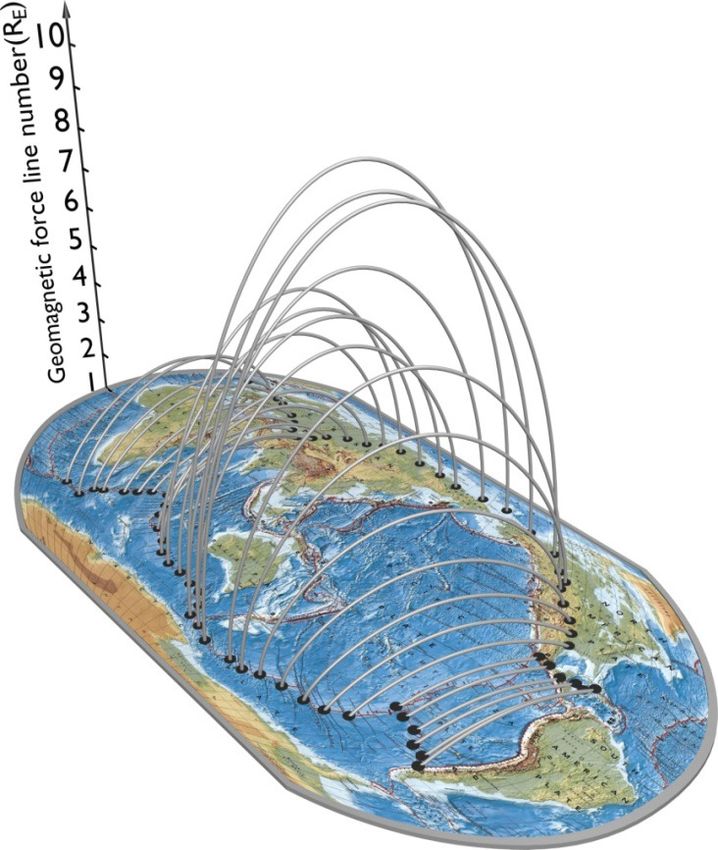
The results in Figures 1, 2 indicate that the Antarctic lithospheric plate boundary and/or the mid-
oceanic ridges in the southern hemisphere are in magnetic conjugation with the zone of the junction of
orogenic and platform structures in the northern hemisphere. Visually, the effect of geomagnetic
conjugation in Figures 1, 2 is most clearly manifested between the southern boundary of the Nazca
lithospheric plate and the northern boundaries of the Cocos and Caribbean plates, which are connected
by geomagnetic lines with L ~ 1.2–1.5.

       3. Seismic activity in relation to geomagnetic storms and radiation belt dynamics

The presence of geomagnetic conjugation between seismotectonic structures suggests the possibility
of a connection between variations of seismic activity at the base of geomagnetic lines in the earth's
crust and the dynamics of charged particles that populated these lines at the heights of the radiation
belt. This connection was indeed discovered some decades ago. So, space experiments showed that
several hours before strong earthquakes (on the average ~ 4h) the electron precipitation (electron
bursts) may occur along geomagnetic line penetrating the future epicenter (Aleksandrin et al., 2003;
Sidiropoulos et al., 2011; Anagnostopoulos et al., 2011; Zhang et al., 2013; and references in herein).
To explain these results, their authors suggested that in the region of earthquake preparation, the ultra-
and very low-frequency electromagnetic emissions to be generated and propagate upwards up to the
radiation belt. If the electromagnetic emission frequencies coincide closely with those for electrons,
the energy exchange can result in electron bursts. However, not all scientists agree with this
assumption. For example, (Sauvaud et al., 2014) suggest that detected electron bursts were not related
to earthquakes but occurred instead due to VLF transmitters operation, or lightnings and geomagnetic
storms as well. As for geomagnetic storms, it is well known that storms significantly impact the
structure and dynamics of the radiation belt (Baker et al., 2018; Li et al., 2019; Ripoll et al., 2019; and
references in herein). The storm distorts the outer electron radiation belt that results in the filling by
the high energy electrons the magnetic lines in the slot region (area between the inner and outer parts
of the radiation belt) and even in the inner magnetosphere. On the average, the energetic electrons
create a short-living (some days) new radiation belt in the slot region, but during only some
geomagnetic storms the energetic electrons create a long-living (some months) radiation belt in the
inner magnetosphere (Li et al., 2019). Here we consider variations of seismic activity with four widely
discussed cases of creation a new long-living radiation belt in the inner magnetosphere after
geomagnetic storms on March 24, 1991; September 3, 2012; June 21, 2015; and the strongest one

                                                                                                        4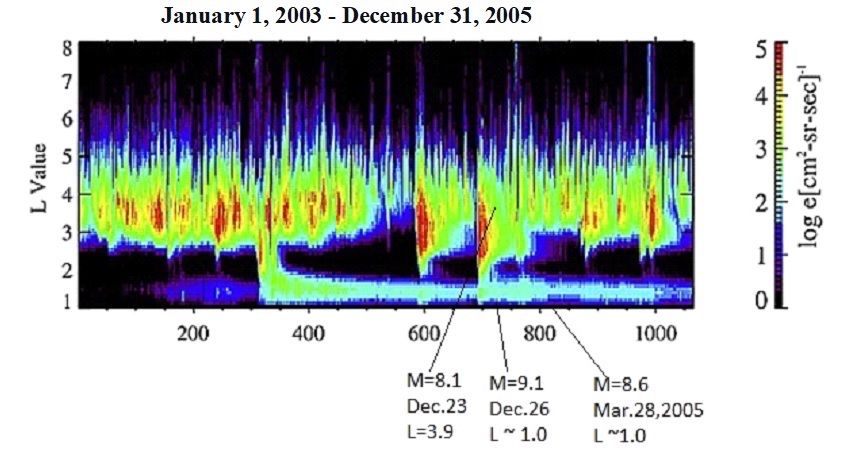
(Halloween storm) at the end of October – beginning of November 2003 (Blake et al., 1992; Galper,
1999; Thorne et al., 2013; Claudepierre et al., 2017; Baker et al., 2004, 2007).
Geomagnetic storm on March 24, 1991, started at 04:30 UT from the initial phase in Dst = +63 nT and
reached its negative extremum in the main phase on March 25, 1991 at 00:30 UT with Dst = - 298 nT.
At this time, the CRRES satellite was on the geomagnetic shell L~2.6, and its instruments recorded
powerful fluxes of electrons with E ~ 15 MeV and protons with E ~ 20-110 MeV (Blake et al., 1992).
In addition, the MIR orbital station observed a new radiation belt around L ~ 2.6 for about two years
(Galper, 1999).
Geomagnetic storm on September 1, 2012 started at 22:30 UT from the initial phase in Dst = +10 nT
and reached its negative extremum in the main phase on September 3, 2012 at 10:30 UT with Dst = -
69 nT. At this time, the Relativistic Electron Proton Telescope (REPT) on NASA’s Van Allen probes
board recorded a new belt of relativistic electrons around 3.0 ≤ L ≤ 3.5. Figure 3 presents that result
from (Thorne et al., 2013), which demonstrates the evolution of energetic electron flux at 3.6, 4.5, and
5.6 MeV showing the development and long-term stability of the unusual third radiation belt ring
between 3.0 and 3.5 RE.

                                                                 Figure 3. Evolution of energetic
                                                                 electron flux at 3.6, 4.5, and 5.6 MeV
                                                                 showing the development and long-
                                                                 term stability of the unusual third
                                                                 radiation belt ring between 3.0 and 3.5
                                                                 RE, measured by the REPT
                                                                 instrument on the Van Allen probes
                                                                 [Thorne et al., 2013, their Figure 1]:
                                                                 (a) The Dst index and solar wind
                                                                 velocity. (b–d) Electron flux at 3.6,
                                                                 4.5, and 5.6 MeV. (e) >30 keV
                                                                 electron precipitation flux on the
                                                                 nightside (21-03 MLT) obtained from
                                                                 multiple POES satellites. (f) RMS
                                                                 magnetic wave amplitudes of chorus
                                                                 emissions, averaged over ΔL = 0.2
                                                                 and 6 h, obtained by the EMFISIS
                                                                 search coil magnetometers on both
                                                                 Van Allen probes A and B. (g) Similar
                                                                 RMS amplitudes of plasmaspheric
                                                                 hiss from EMFISIS.

                                                                                                     5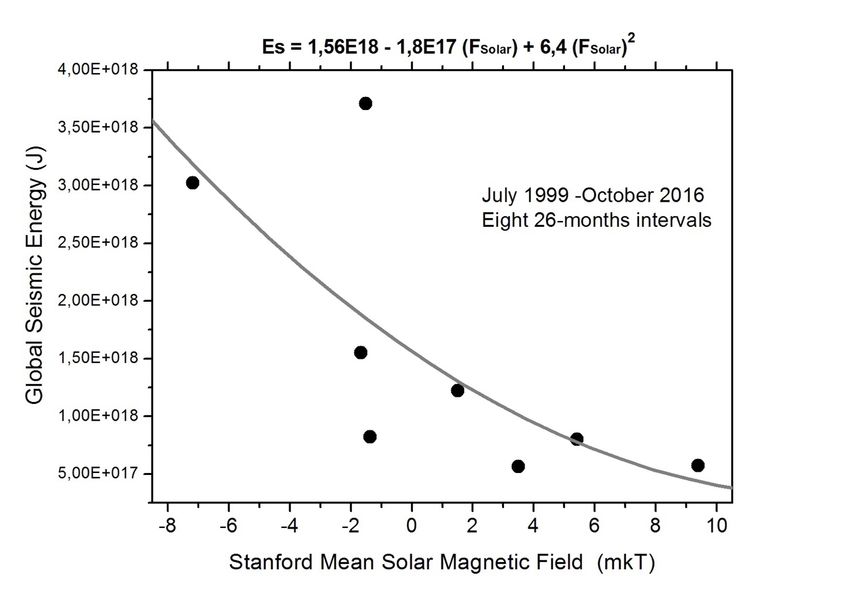
Geomagnetic storm on June 21, 2015, started at 18:30 UT from the initial phase in Dst = +35 nT and
reached its negative extremum in the primary phase on June 23, 2015, at 04:30 UT with Dst = - 204
nT. At this time, the Magnetic Electron Ion Spectrometer (MagEIS) on the NASA’s Van Allen probes
board recorded a new belt of relativistic electrons (E=1.06 MeV) around geomagnetic lines L ~ 1.5 -
1.8, which was persisted for some months. Figure 4 presents the result from (Claudepierre et al., 2017).
It was paid attention (Khachikyan, 2019) that seismic activity responds to dramatic radiation belt
changes due to geomagnetic storms. In below, we present a more detailed analysis of this effect. In
Figure 5A, the histogram of the number of earthquakes with М≥4.5 near the footprint of the
geomagnetic lines L = 2.5 - 2.7 in different months of 1991 is shown. The most significant number of
earthquakes occurred in May 1991, and the strongest was the M7.0 earthquake in Alaska, which
occurred on May 30, 1991, with the coordinates of the epicenter 54.570N, 161.610E near the footprint
of the geomagnetic line L ~2.69, closely adjacent to the new radiation belt. Thus, we see that an increase
in seismic activity at the base L = 2.5 - 2.7 in May 1991 occurred ~ 2 months after the geomagnetic
storm onset on March 24, 1991, which formed an additional radiation belt near L ~ 2.6.

Figure 4. MagEIS daily-averaged electron fluxes (E=1.06 MeV) from April, 2013 to September 2016,
plotted in L -versus-time format, from (Claudepierre et al., 2017, a fragment of their Figure 6).
Following the geomagnetic storm on June 21, 2015, the 1.06 MeV electrons traverse the slot region
and enter the inner zone forming a new radiation belt around L=1.5-1.8 which existed more of the ten
months (the dates are indicated at the top of Figure).

                                                                                                       6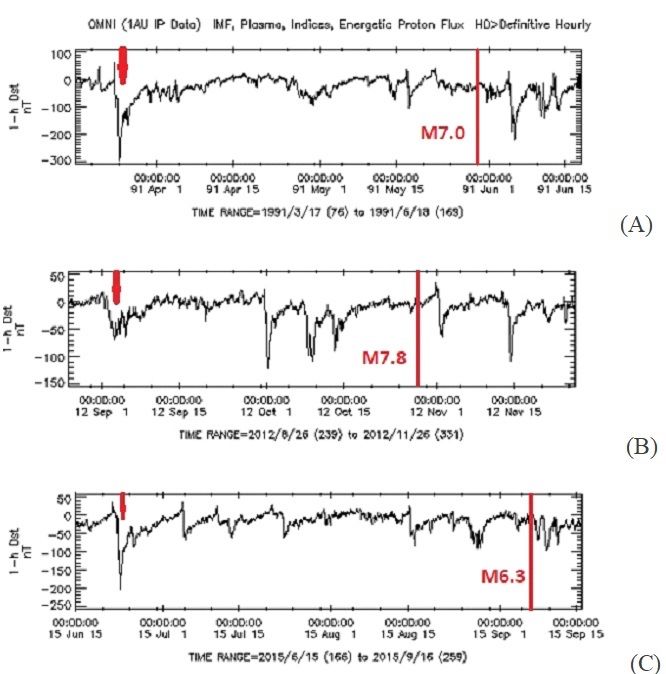
Figure 5B shows the distribution by months in 2012 of the number of earthquakes with a magnitude of
M≥4.5 that occurred near the footprint of the geomagnetic lines L = 3.0 - 3.5, around which a belt of
high-energy electrons was formed after a geomagnetic storm on September 1, 2012 (Thorne et al.,
2013). For the base of L = 3.0 - 3.5, the number of earthquakes strongly increased the largest here was
an earthquake with M = 7.8, which occurred off the coast of Canada on October 28, 2012, with
coordinates 52.790N, 132.10W near the footprint of L = ~3.32. This earthquake again happened ~ 2
months after the start of the geomagnetic storm. Detailed analysis of USGS global seismological
catalog data for 1973-2017 showed that in the regions pierced by geomagnetic lines L = 3.0 - 3.5, there
were only eight earthquakes with a magnitude of M≥7.0 during these 45 years, and the strongest (M =
                                                      7.8) occurred precisely in October 2012 in the
                                                      period of existence of additional radiation belt
                                                      formed in connection with a geomagnetic storm.

                                                      Figure 5. The histograms of the number of
                                                      earthquakes with М≥4.5 from the USGS
                                                      seismological catalog: (A) - near the footprint of
                                                      the geomagnetic lines L = 2.5 - 2.7 in different
                                                      months of 1991; (B) - near the footprint of the
                                                      geomagnetic lines L = 3.0 - 3.5 in different
                                                      months of 2012; (C) - near the footprint of the
                                                      geomagnetic lines L = 1.5 - 1.8 from January
                                                      2015 to April 2016.

                                                                                                     7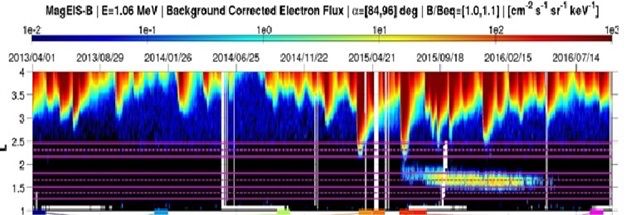
In Figure 5C we present a monthly number of earthquakes with M≥4.5 from January 2015 to April
2016 near the footprint of geomagnetic lines L = 1.5–1.8, around which a belt of high-energy electrons
was formed after a geomagnetic storm on June 21, 2015 (Claudepierre et al., 2017). The increase of
seismic activity here started in June 2015, just after a strong geomagnetic storm, but peaked in
September 2015. The largest was an earthquake with M = 6.3, which occurred on September 7, 2015
near New Zealand with coordinates of epicenter 32.820S, 177.860W in the footprint of L~1.58. The
M6.3 events again lags by a little over two months relative to the beginning of the geomagnetic storm
on June 21, 2015 which formed an additional radiation belt around L ~ 1.5–1.8.

                                                          Figure 6. Variations of hourly geomagnetic
                                                          Dst-index from the OMNI database for
                                                          three periods: March - June, 1991 (A),
                                                          August - November 2012 (B), and June -
                                                          September 2015 (C). Upper red arrows
                                                          mark dates of magnetic storms in March
                                                          1991; September 2012; and June 2015, and
                                                          red vertical lines indicate dates of the
                                                          strongest earthquakes: M7.0 in Alaska in
                                                          991; M7.8 near Canada in 2012; and M6.3
                                                          in New Zealand in 2015, which occurred in
                                                          the footprint of magnetic lines belonging to
                                                          the new belts of high-energy particles
                                                          formed due to geomagnetic storms (see
                                                          text).

Figure 6 visualizes the correlation between geomagnetic storm onset and the strongest earthquake in
the footprint of magnetic lines belonging to a newly created radiation belt. Here, the geomagnetic Dst-
index from the OMNI database is shown for three analyzed periods: March-June, 1991 (6A), August-
November 2012 (6B), and June-September 2015 (6C). Upper red arrows mark dates of magnetic storms
in March 1991; September 2012; and June 2015, and red vertical lines indicate dates of the strongest
earthquakes: M7.0 earthquake in Alaska in 1991; M7.8 near Canada in 2012; and M6.3 near New
Zealand in 2015. The Time delay between storm onset and earthquake occurrence consisted of about
60 days in 1991, 58 days in 2012, and 75 days in 2015. As we see, the time lag differs for different
earthquakes, but we consider them as similar because they belong to the footprint of magnetic lines

                                                                                                    8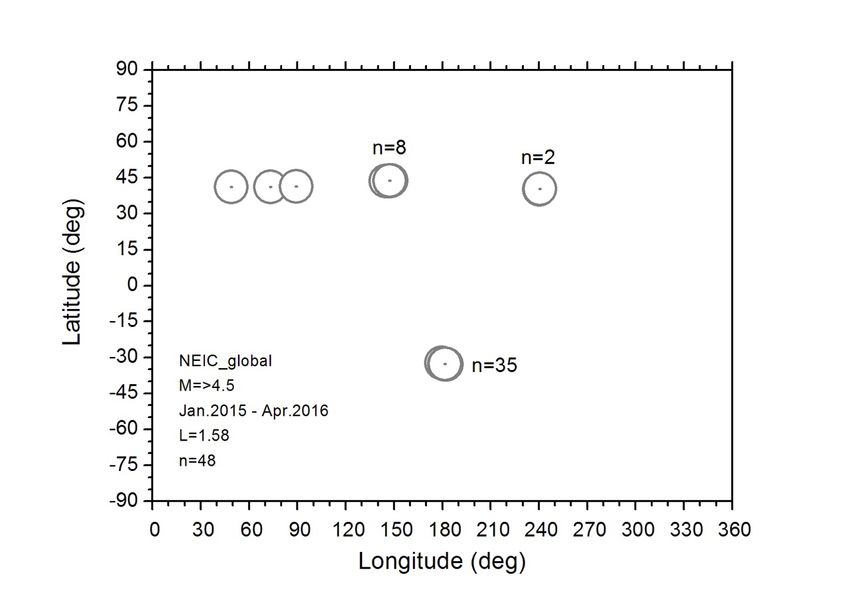
with a similar story. Besides this, Figure (6B) shows that the geomagnetic storm on September 1, 2012,
was only moderate, but the strong one happened on October 1, 2012. One may suggest that this strong
storm induced M7.8 earthquake in Canada. This is how it is challenging to find a correlation between
the magnetic storm and induced earthquake without an initial idea. Our idea was to investigate
seismicity in the footprint of magnetic lines belonging to new radiation belts created due to magnetic
storms, which allowed us to get similar results. Of course, strong magnetic storms in October 2012
could input the generation of the M7.8 event in Canada. However, since this event occurred in the
footprint of L=3.32, which population increased due to moderate storm on September 1, 2012, we
suggest that namely the moderate storm on September 1, was a start for M7.8 earthquake development,
while many works are needed in future to understand all steps in this complex process.
In Figure 7, we show the epicenters of 48 earthquakes with M≥4.5 occurred from January 2015 to April
2016 near the footprint of geomagnetic lines L=1.58, where M6.3 event occurred on September 7,
2015. It is seen that the most significant amount (35 events) occurred in the southern hemisphere near
New Zealand on the border of Australian and Pacific plates. In the northern hemisphere, the most
considerable amount (8 events) occurred around the region with central coordinates ~ 43.70N, 147.60E
that belongs to the southern part of the Kuril-Kamchatka Arc - one of the most seismically active
regions in the world, where the Pacific plate subducts into the mantle beneath the Okhotsk microplate.
While earthquake epicenters in Figure 7 are magnetically conjugated since they belong to the same
                                                                   geomagnetic lines L=1.58, the
                                                                   used seismic catalog with M≥4.5
                                                                   does not show that they occurred
                                                                   simultaneously.

                                                                   Figure 7. Spatial distribution of 48
                                                                   epicenters of earthquakes with
                                                                   M≥4.5 which occurred in January
                                                                   2015 – April 2016 in the footprint
                                                                   of magnetic lines L=1.58.

                                                                                                    9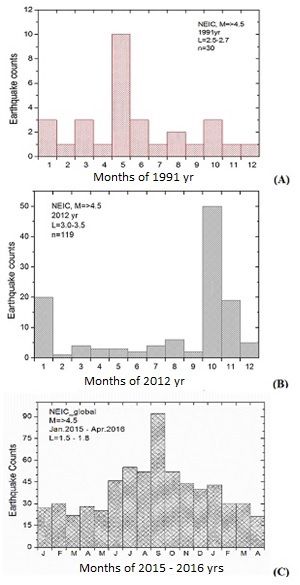
The earthquakes used in our study had magnitudes ≥M4.5; may be used in the future more precise
catalogs (with low magnitude events) could help in obtaining the more precise result.
To test if the relationship of seismic activity with the magnetic storm is significant in the spatial domain
(near the footprints of magnetic lines belonging to a new radiation belt created due to storm), we present
Figure 8, which shows the distribution by months in 2012 of the number of earthquakes with a
magnitude of M≥4.5 that occurred near the footprint of the geomagnetic lines L = 3.0 - 3.5, around
which a belt of high-energy electrons was formed after a geomagnetic storm (red bars), as well as in
neighboring geomagnetic lines L = 2.5 - 2.99 (green), and L = 3.51 - 5.0 (blue). It is noteworthy that
at the base of the lower lines (L = 2.5 - 2.99) and higher (L = 3.51 - 5.0), the distribution of earthquakes
by months was more or less uniform. For the base of L = 3.0 - 3.5, around which the belt of high energy
particles was formed due to a magnetic storm in September 2012, the number of earthquakes strongly
increased ~ 2 months after the start of the magnetic storm. This supports the suggestion that creating
of a new radiation belt due to geomagnetic storm is followed by an increasing seismic activity near the
footprint of magnetic lines belonging to a new radiation belt.

                                                                 Figure 8. Distribution by months of
                                                                 2012 of the number of earthquakes with
                                                                 magnitude М≥4.5 that occurred at the
                                                                 base of geomagnetic lines L = 2.5 - 2.99
                                                                 (green), L = 3.0 - 3.5 (red - around
                                                                 which a belt of high-energy electrons
                                                                 was formed after the geomagnetic storm
                                                                 on September 1, 2012), and L = 3.51 -
                                                                 5.0 (blue).

One of the important questions could be the next one: "Are there any pieces of evidence that the high-
magnitude earthquakes (M≥8) also result from the geospace environment impact? It is well known that
principal amounts of high-magnitude earthquakes occur at very low latitudes, where the geomagnetic
line values are close to L ~1.0. This does not allow satellites to determine if the charged particle
population around these lines increases due to geomagnetic storms. The deepest radiation belt (around
L ~ 1.5) was detected due to a giant magnetic storm at the end of October – beginning of November

                                                                                                       10
2003 (Halloween storm), when the Dst-index reached up to - 400 nT. The Solar Anomalous and
Magnetospheric Particle Explorer (SAMPEX) detected the multi‐MeV electron transport from the
outer zone of the radiation belt through the slot region into the inner magnetosphere up to L ~ 1.5
(Baker et al., 2004, 2007). A new belt of relativistic electrons existed for about 26 months until the end
of 2005 (Figure 9). The thin lines at the bottom shown in Figure 9 mark the three high-magnitude
earthquakes' dates in 2004-2005: М = 8.1, on December 23, 2004; M = 9.1 on December 26, 2004; and
M = 8.6 on March 28, 2005. According to statistics, on average, only one earthquake with a magnitude
of 8 or more occurs on the planet per year. However, when an intense belt of relativistic electrons was
formed in the lower magnetosphere after a giant magnetic storm in late October – early November of
2003, three such events occurred, and in a brief period (slightly more than three months).
Figure 9. Distribution on
geomagnetic lines in 2003-
2005 the flux intensity of
relativistic electrons with
energies of 2 - 6 MeV
according to the SAMPEX
satellite data (Baker et al.
2007 - a fragment of their
Figure 1); the lines at the
bottom mark the dates of the
three strongest earthquakes
in 2004-2005.
In Figure 10A, we show variations of seismic energy (Es=10(11.8+ 1.5M) released at the globe into 26-
month intervals (bins) from 1999 to 2016, on the base of the USGS seismological catalog for M≥4.5
(https://earthquake.usgs.gov/earthquakes/search/). They are July 1999 - August 2001; September 2001
- October 2003; November 2003 - December 2005; January 2006 – February 2008; March 2008 – April
2010; May 2010 – June 2012; July 2012 – August 2014; September 2014 – October 2016. It is seen
that from July 1999 to October 2003, the Es values into the 26-month bins did not exceed ~7.6 x10¹⁷
Joule. However, into the 26-month bin (November 2003 – December 2005), when a belt of relativistic
electrons has existed in the inner magnetosphere, the released seismic energy increased up to ~3.7
x1018 Joule. It is also seen that an increased realizing of seismic energy at the globe continued up to
the 26-month bin of May 2010 - June 2012. After that, the amount of seismic energy released into 26-
month bins becomes the same as before the Halloween magnetic storm. In fact, Figure 10A displays a
temporal clustering of Earth's megaquakes at the beginning of the 21st century. According to the USGS
11seismological catalog, the strongest among them are M9.1 - Sumatra - the Andaman Islands on 26
December 2004; M8.6 - northern Sumatra on 28 March 2005; M8.8 - offshore Bio-Bio (Chile) on 27
February 2010; M9.1 - great Tohoku (Japan) earthquake on 11 March 2011, and M8.6 - northern
Sumatra earthquake on 11 April 2012.
It is
Figure 10. A - global seismic energy released into the eight 26-months intervals: July 1999 - August
2001; September 2001 - October 2003; November 2003 - December 2005; January 2006 – February
2008; March 2008 – April 2010; May 2010 – June 2012; July 2012 – August 2014; September 2014 –
October 2016 on the base of the USGS seismological catalog for M≥4.5
(https://earthquake.usgs.gov/earthquakes/search/). B - the mean magnetic field of the Sun into the same
26-months intervals on the base of the Wilcox Solar Observatory data
(http://wso.stanford.edu/meanfld/).
needed to mention that after several Earth's megaquakes at the beginning of the 21st century, and
especially after the M9.0 earthquake in Japan, at the meeting of the Seismological Society of America
in 2011, a heated debate about whether the observed temporary clusterization of strong earthquakes
has some physical cause (Bufe et al., 2011; Ammon et al., 2011; Michael, 2011a, 2011b). The question
was raised in (Michael 2011a): "If global clustering of earthquakes is so important that it should be
12taken into account when assessing seismic hazard, then seismological data should reject the "null
hypothesis" that the temporal distribution of earthquakes on the planet is described by the distribution
Poisson (uniform distribution of random independent events that occur at a constant speed). However,
immediately the question arose about the reliability of the results of such testing conducted on a time-
limited sample of sporadic events (which are the megaquakes). De Oliveira (2012) evaluated the
effectiveness of traditional statistical tests to unambiguously answer the question of the existence or
absence of clustering of earthquakes in catalogs with a small number of events. He concluded that
when analyzing a fairly short sample with rare events, the test results cannot be considered reliable.
As a result, the next opinion has been formed (Michael, 2011a): "... even if there is a global process
leading to the generation and clustering of earthquakes, the length of the instrumental seismological
series is currently too small to discover reliably. This situation may change either with the accumulation
of seismological data in the future or with the advent of the physically justified hypothesis of
earthquake generation, which will positively affect the test results."
Figure 11. The distribution of the released global seismic energy versus the mean magnetic field of
the Sun into the 26-months intervals as shown in Figure 10.
As for the second part of the above opinion, a new idea for the generation of earthquakes is currently
advent, impacting the geospace environment on lithospheric processes. In the frame of developing this
idea, we show in Figure 10B the values of the mean magnetic field of the Sun into the same 26-months
13intervals: July 1999 - August 2001; September 2001 - October 2003; November 2003 - December
2005; January 2006 – February 2008; March 2008 – April 2010; May 2010 – June 2012; July 2012 –
August 2014; September 2014 – October 2016, calculated on the base of the Wilcox Solar Observatory
data (http://wso.stanford.edu/meanfld/MF_timeseries.txt). Simultaneously, in Figure 11, we show the
distribution of the released global seismic energy versus the values of the mean magnetic field of the
Sun into the 26-months intervals, which were defined in Figure 10. Comparison of both figures allows
one to conclude that released Earth's seismic energy tends to increase in periods of the negative mean
magnetic field of the Sun, which may be considered as an additional argument on existing of the impact
of the geospace environment on lithospheric processes.
4. Discussion
The results in Figures 1, 2 demonstrate a correspondence between the spatial arrangement of the main
tectonic structures and geomagnetic field parameters: the mid-oceanic ridges in the southern
hemisphere located along the Antarctic lithospheric plate border which connects with the borders of
Australian, Pacific, Nazca, South American, Scotia, African, and Australian plate in the southern
hemisphere, are being in magnetic conjugation with the zone of the junction of orogenic and platform
structures in the northern hemisphere. The effect of geomagnetic conjugation is most clearly
manifested between the southern boundary of the Nazca Plate and the northern boundaries of the Cocos
and Caribbean plates. Evidently, a correspondence between the spatial arrangement of the tectonic
structures and geomagnetic field parameters is expectable. As has noted (Buffett, 2015): "Two giant
heat engines operate inside the Earth. One power plate tectonics and accounts for most of the geologic
phenomena we observe at the surface. The other operates in the core, continually sustaining the Earth's
magnetic field against persistent ohmic losses. These two heat engines are coupled, primarily through
interactions at the boundary between the core and mantle. Transfer of heat, mass, momentum and
electric current across the boundary profoundly affects the dynamics and evolution of both regions on
timescales ranging from days to hundreds of millions of years." Since most of the earthquakes are
localized along the plate boundaries, a correspondence between the geography of the primary seismic
belts and geomagnetic field geometry occurs. For example, the results by (Khachikjan 2009) showed
that the main number of earthquakes occur in the areas with small values of geomagnetic declination
angle (5.00 ≥ D ≥ -1.00). It was shown that this main peak is formed by those earthquakes which
occurred in the regions of the continental orogens. In epicenters of earthquakes occurred in the regions
of the island arcs along the coast of the Pacific Ocean, the geomagnetic declination angles are mainly
14large and positive, while in epicenters of earthquakes occurred in the rift systems at the bottom of the
oceans, the geomagnetic declination angles are mainly large and negative.
It has long been noted that on the eve of tangible earthquakes, electromagnetic and plasma disturbances
appear in the characteristics of near-Earth space, both above the region of the future epicenter and the
magnetically conjugate region in the opposite hemisphere of the Earth (Pulinets and Boyarchuk, 2004;
Ouzounov et al., 2018 and references in herein). Thus, an opinion was formed that there is a disturbance
of the medium's electromagnetic and plasma state along the entire length of the magnetic tube
immersed in the zone of the future focus in connection with the earthquake. This idea suggested by
(Pulinets 2009) explains that this disturbance is caused by modifying the electric field in the global
electric circuit (GEC) by electromagnetic disturbances in the lithosphere accompanying the earthquake
preparation process.
The classical concept of GEC, initially proposed in (Wilson 1921), is a system of stationary currents
between conducting Earth and the ionosphere. At present, a modified configuration of the GEC is
discussed (Bering et al., 1998; Makarova and Shirochkov,1998). In a modified GEC, its external
element is located on the magnetopause with the electromotive force generator driven by solar wind
energy. Its internal element is located in the solid Earth with the electromotive force generator driven
by the tectonic processes (Makarova and Shirochkov,1998). In the modified configuration of the GEC,
the role of geomagnetic lines becomes essential since they could conduct the energy of the solar wind
in the lower geospheres. At the heights of the magnetosphere-ionosphere, where the conductivity is
high namely, field-aligned currents are responsible for the magnetosphere-ionosphere connections
(Ebihara and Tanaka, 2017 and references herein). In the underlying atmospheric layers, the
conductivity is low, which creates the main problem for the GEC's functioning. Energetic electrons,
which due to geomagnetic storms precipitate downward, produce air ionization in the mesosphere and
upper stratosphere (Kavanagh et al., 2018). The galactic cosmic rays produce ionization in the lower
stratosphere and upper troposphere (Bazilevskaya et al., 2008; Phillips et al., 2016), and in the near-
ground atmosphere, the ionization is produced by the isotopes of Radon (Gringel 1986; Pulinets and
Ouzounov, 2011; Pulinets et al., 2018; Golubenko et al., 2020). The ionization due to galactic cosmic
rays (GCR) is always present in the atmosphere, and it changes with the 11-year solar cycle due to
solar modulation. The intensity of the GCR is increased in the solar minimums, resulting in favorite
conditions for the GEC's functioning and seismic activity increasing, which is the case. For example,
(Ebisuzaki et al., 2011) showed that out of 12 strongest earthquakes (with a magnitude of more than
7.5) that occurred in Japan in 1700-2005, nine events (~70%) were confined to periods of low solar
15activity, when the intensity of galactic cosmic rays increased. The same relationship holds for seismic
activity on the planet as a whole (e.g., Simpson, 1968; Zhang, 1998; Huzaimy and Yumoto, 2011;
Khachikyan et al., 2014). Radon concentration in the planetary boundary layer, which may be
responsible for ionizing the near-ground atmosphere, shows relatively strong spatial variations and
differs widely above continental and oceanic areas. An average radon flux density for the entire Ocean,
0.0382 mBq m−2 s−1 (Schery and Huang, 2004), is much smaller than the typical estimates for the
average flux density from land, which are in the approximate range of 20 to 35 mBq m−2 s−1 (Schery
and Wasiolek, 1998). Over the land, the radon concentration depends on the tectonic conditions. For
example, in Mysore city (India), it is of order 20 Bq/m3 (Chandrashecara et al. 2006). Simultaneously,
in the vicinity of active faults, radon concentration may reach 2000 kBq/m3, five orders of magnitude
larger (Kobeissi et al., 2015). It was noted by (Baskaran 2018): "Radon emanation rates, to be higher
from seismically active areas including subsurface active faults, as they provide major conduit paths
for radon and other gases (such as CO2, CH4, N2, H2, He, Cl, and F) to escape. The escape rates of
gases from subsurface faults are not uniform, and they depend on several factors that include subsurface
porosity, permeability, the conductivity of the underlying material, etc. If there is no seismic or
volcanic activity in the subsurface environment, then the radon release rates are expected to be
relatively constant. However, due to subsurface seismic activities, the rupturing energy released could
alter the porosity and permeability of subsurface material, affecting the conduit pathways of radon".
Thus, if a suggestion that in the modified GEC, the geomagnetic field lines may transport the
electromagnetic energy from the magnetopause into the lower geospheres is correct, then one may
expect that the regions of active tectonic faults and the lithospheric plate borders are the most
appropriate for such transportation. In this connection, it is exciting to notice that the boundary of the
Antarctic lithospheric plate (which we analyzed in Figures 1 and 2) coincides very closely with the
layer of the higher radon emissions. Namely, in the southern hemisphere, the higher radon emissions
occur in the Southern Ocean around latitude ~50°S as it was modeled by (Schery and Huang, 2004),
and it is not difficult to calculate from Figure 1 that the middle latitude of the Antarctic lithospheric
plate is equal to ~48°S.During a geomagnetic storm, the slot region (between outer and inner radiation
belt) can be filled by energetic electrons as the outer electron radiation belt is severely distorted (Baker
et al., 2018 and references in herein). On average, the energetic electrons fill the slot region during
some days (Li et al., 2019). It was shown by (Kavanagh et al., 2018) that significant energetic
precipitation into the mesosphere and upper stratosphere occurs from the slot region at times when it
is filled and that the duration of such precipitation is ~10 days on average. This again may result in
favorite conditions for the GEC's functioning and, thus, for seismic activity increasing some days after
16geomagnetic storm onset. Indeed, (Sobolev et al., 2001) showed that in the territories underlaying by
the rocks with low electrical resistivity, the seismic activity increases, on average, 2 - 6 days after
geomagnetic storm onset. Only a few geomagnetic storms may lead to the formation of long-lived (up
to a year or more) belts of energetic electrons, both in the slot region and in the inner radiation belt (Li
et al., 2019). For these events, one could expect an increase in seismic activity level for a more extended
period after a geomagnetic storm onset. We analyzed seismic activity (Figures 5 - 8) for three such
events: after the geomagnetic storm onset on March 24, 1991, which formed an additional radiation
belt around L ~ 2.6 (Blake et al., 1992, Galper, 1999); after geomagnetic storm onset on September 1,
2012, which formed different radiation belt around L ~ 3.0 - 3.5 (Thorne et al., 2013); and after
geomagnetic storm onset on June 21, 2015, which formed different radiation belt around L = 1.5–1.8
(Claudepierre et al., 2017). For all of three cases, strong earthquakes occur ~ 2 months after the
geomagnetic storm onset in the local areas: in Alaska on May 30, 1991; near Canada on October 28,
2012; and near New Zealand on September 7, 2015, with their epicenters located near the footprints of
the geomagnetic field lines belonging to the new long-living radiation belts created in the inner
magnetosphere due to magnetic storms. These are other examples showing that the geomagnetic field
lines in the Global Electric Circuit could target energy from the space to the specific regions, causing
earthquakes. The giant geomagnetic storm at the end of October – beginning of November 2003
(Halloween storm) generated the strongest new radiation belt in the inner magnetosphere at L ~ 1.5,
which existed for about 26 months until the end of 2005 (Figure 9). After this event, the temporal
clustering of Earth's megaquakes started at the beginning of the 21st century (Figure 10A). Released at
that time, global seismic energy shows a correlation with the polarity of the mean magnetic field of the
Sun (Figures 10A, 11).These results also support the idea of the impact of the geospace environment
on lithospheric processes.
5. Conclusion
Does the geospace environment impact lithospheric processes? We are searching for answers exploring
the geomagnetic conjugation between seismotectonic structures in the southern and northern
hemispheres of the Earth. Our results indicate for connection between the geographical distribution of
seismotectonic belts and the geometry of the main geomagnetic field. By definition, the magnetic field
can affect only currents or moving charges, which can be implemented within the global electrical
circuit (GEC) framework, which connects all geospheres from the magnetopause, controlled by the
solar wind energy, to the intra-terrestrial conductive layers. The efficiency of such a GEC depends on
17the conductivity of the medium in different geospheres. One of the sources for ensuring conductivity
in the upper geospheres is high-energy charged particles falling out of new (additional) radiation belts
formed in the slot region or inner magnetosphere due to emptying the outer radiation belt geomagnetic
storms. Discovered effect of intensification of seismic activity near the footprint of geomagnetic lines
of new long-lived radiation belts (up to a year or more) indicates the advisability of conducting similar
studies for short-lived radiation belts (some ten days), which can be formed after each geomagnetic
storm. The experimental base for research can be data from Van Allen probes satellites (2012-2019).
The approaches developed based on retrospective data for the short-term forecast of increased seismic
activity after a geomagnetic storm can then be implemented on the real-time data of the corresponding
spacecraft.
Acknowledgments
Special thanks go to the US Geological Survey and European‐Mediterranean Seismological Centre for
providing earthquake information services and data. We acknowledge use of NASA/GSFC's Space
Physics Data Facility's CDAWeb service and OMNI data. Special thanks go to the CRRES, SAMPEX,
and Van Allen Probes scientific missions for providing observations of the radiation belt dynamics,
and, especially, to J. B. Blake et al., 1992; D. N. Baker et al., 2007, 2018; S. G. Claudepierre et al.,
2017, 2019; and R. M. Thorne et al., 2013, who results we used in our investigations.
References
Aleksandrin, S.Yu., Galper, A.M., Grishantzeva, L.A., Koldashov, S.V., Maslennikov, L.V.,
Murashov, A.M., Picozza, P., Sgrigna, V., Voronov, S.A. (2003). High-energy charged particle
bursts in near-Earth space as earthquake precursors. Annales Geophysics. 21. 597-602.
Ammon, C.J., Aster R.C., Lay T, Simpson D.W. (2011) The Tohoku earthquake and a 110‐
year spatio-temporal record of global seismic strain release. Seismo. Research Letters. Vol. 82. 454.
Anagnostopoulos, G. C., Vassiliadis, and Pulinets, S. (2011). Characteristics of flux-time
profiles, temporal evolution, and spatial distribution of radiation-belt electron precipitation bursts in
the upper ionosphere before great and giant earthquakes. Annales of Geophysics. 55. Doi:10.4401/ag-
5365- 2011.
Baker, D. N., Kanekal, S. G., Li, X., Monk, S. P., Goldstein, J., & Burch, J. L. (2004). An
extreme distortion of the Van Allen belt arising from the Halloween solar storm in
2003. Nature. 432(7019). 878– 881. https://doi.org/10.1038/nature03116
Baker, D.N., Kanekal, S.G., Horne, R.B., Meredith, N. P., Glauert, S.A., (2007). Low‐
altitude measurements of 2–6 MeV electron trapping lifetimes at 1.5 ≤ L ≤ 2.5. Geophysical Research
Letters. 34. No. 20. https://doi.org/10.1029/2007GL031007.
Baker, D. N., Erickson, P. J., Fennell, J. F., Foster, J. C., Jaynes, A. N., Verronen, P. T. (2018).
Space Weather Effects in the Earth’s Radiation Belts. Space Science Reviews.. 60 р. Doi
10.1007/s11214-017-0452-7.
18Baskaran, M. (2018) Radon: A Tracer for Geological, Geophysical and Geochemical Studies.
Springer Geochemistry. (eBook). DOI 10.1007/978-3-319-21329-3
Bazilevskaya, G. A., I. G. Usoskin, E. O. Flückiger, R. G. Harrison, L. Desorgher, R.
Bütikofer, M. B. Krainev, V. S. Makhmutov, Y. I. Stozhkov, A. K. Svirzhevskaya, N. S.
Svirzhevsky, and G. A. Kovaltsov (2008). Cosmic ray induced ion production in the atmosphere.
Space Sci. Rev. 137. 1-4. 149-173. DOI: 10.1007/s11214-008-9339-y.
Bering, E. A., A. A. Few, J. R. Benbrook.. (1998). The global electric circuit. Physics Today.
October. 24–30.
Bercovichi D. (1998). Generation of plate tectonic forces from lithosphere-mantle flow and
void-volatile self-lubrication. Earth Planet Science Letters. 154, 139-151.
Blake, J. B., Kolasinski, W. A., Fillius, R. W., Mullen, E. G. (1992). Injection of electrons and
protons with energies of tens of MeV into L < 3 on 24 March 1991. Geophysical Research Letters. 19.
No. 8. 821– 824. https://doi.org/10.1029/92gl00624
Bufe, C.G., Perkins D. (2011). The 2011 Tohoku earthquake: Resumption of temporal
clustering of Earth’s megaquakes. Seismological Research Letters. Vol. 82. 455.
Buffett B.A. (2015) Core–Mantle Interactions. In: Gerald Schubert (editor-in-chief) Treatise
on Geophysics, 2nd edition, Vol 8. Oxford: Elsevier. 213-224.
Chandrashekara M.S., Sannappa J., Paramesh L. (2006). Studies on atmospheric electrical
conductivity related to radon and its progeny concentrations in the lower atmosphere at Mysore,
Atmospheric Environment, 40(1), 87-95, 2006. https://doi.org/10.1016/j.atmosenv.2005.09.026
Chen, H., R. Wang, M. Miao, X. Liu, Y.Ma , K. Hattori, P. Han.(2020). A Statistical Study of
the Correlation between Geomagnetic Storms and M ≥ 7.0 Global Earthquakes during 1957-2020.
MDPI. Entropy. 9. 22. 11. 1270. doi: 10.3390/e22111270.
Claudepierre, S. G., Reeves G.D., O'Brien T. P., Fennell J. F., Blake J. B., Clemmons J. H.,
Looper M. D., Mazur J. E., Roeder J. L., Turner D. L. (2017). The hidden dynamics of relativistic
electrons (0.7-1.5 MeV) in the inner zone and slot region. Journal Geophysical Research. Space
Physics. 122. Doi:10.1002/2016JA023719.
Claudepierre, S. G., O'Brien, T. P. , Looper, M. D. , Blake, J. B., Fennell, J. F., Roeder, J. L. ,
Clemmons, J. H. , Mazur, J. E., Turner, D. L. , Reeves, G. D. , & Spence, H. E. (2019). A revised look
at relativistic electrons in the Earth's inner radiation zone and slot region. Journal of Geophysical
Research: Space Physics. 124. 934–951. Doi:10.1029/2018JA026349.
Duma G., Ruzhin Y. (2003). Diurnal changes of earthquake activity and geomagnetic Sq-
variations. Nat. Hazards Earth Syst. Sci. 3. 171–177. doi: 10.5194/nhess-3-171-2003.
Ebihara, Y., & Tanaka, T. (2017). Energy flow exciting field-aligned current at substorm
expansion onset. Journal of Geophysical Research: Space Physics. 122. 12,288–12,309.
https://doi.org/10.1002/ 2017JA024294
Ebisuzaki, T., Miyahara, H., Katoaka, R., Sato, T., Ishimine, Y. (2011). Explosive volcanic
eruptions triggered by cosmic rays: Volcano as a bubble chamber. Gondwana Research. 2011. 19.
1054 – 1061.
Galper А. М.(1999). Earth radiation belt//Soros Educational Journal. No. 6. 75-81.
http://cosmic-rays.ru/Resource/9906_075.pdf
Golubenko, K., Rozanov, E., Mironova, I., Karagodin, A., & Usoskin, I. (2020). Natural
sources of ionization and their impact on atmospheric electricity. Geophys. Res. Lett.
47. e2020GL088619.
Gringel, W. (1986). Electrical structure from 0 to 30 kilometers, in The Earth's Electrical
Environment. 166–182. National Academy Press, Washington, DC.
Han Y.B., Guo Z.J., Wu J.B., Ma L.H. (2004). Possible triggering of solar activity to big
earthquakes (Ms ≥ 8) in faults with near west-east strike in China. Sci. China Ser. G-Phys. Mech.
Astron. 47. 173–181. doi: 10.1360/03yw0103.
19Huzaimy, J. M., and K. Yumoto. (2011). Possible correlation between solar activity and global
seismicity. Proc. 2011 IEEE Int. Conf. Space Sci. Comm. Penang. Malaysia. 138–141.
Khachikjan G. (2009). Spatial earthquake statistics in geomagnetic coordinates. Proc. of Int.
468 Earthquake Sym. Turkey, Kocaeli. 2009. 445-451.
http://kocaeli2009.kocaeli.edu.tr/fullpaper09.pdf
Khachikyan, G.Ya., Zhakupov, N.S., Kadyrkhanova, N.Zh. (2013) Geomagnetic conjugacy of
modern tectonic structures. Geodynamics & Tectonophysics. 4 (2), 187–195.
doi:10.5800/GT2013420097
Khachikyan, G.Ya., Sadykova, A.B, Dzhanabilova S. (2014). The frequency of earthquake
occurrence and released seismic energy of the Earth with variations in solar activity. Scientific journal
- application to the International journal "Higher School of Kazakhstan". Search-Izdenis. No. 2. 55-
61 (in Russian).
Khachikyan, G.Ya. (2019). Observed response of Earth’s lithosphere to solar wind and
radiation belt variations. The Tenth Moscow Solar System Symposium (10M-S3). Moscow. Russia.
Book of Abstracts. 10MS3-PS-92. 474-475. https://ms2019.cosmos.ru/docs/10m-s3-abstract-book.pdf
Kavanagh, A.J., N. Cobbett, P. Kirsch. Radiation Belt Slot Region Filling Events: Sustained
Energetic Precipitation Into the Mesosphere. Journal of Geophysical Research: Space Physics.123.
No. 9. 7999-8020. https://doi.org/10.1029/2018JA025890.
Kobeissi M. A., Gomez F., Tabet C. (2015). Measurement of anomalous radon gas emanation
across the Yammouneh Fault in southern Lebanon: A possible approach to earthquake prediction. Int.
J. Disaster Risk Sci. 6. 250–266.
Li, W., Hudson, M.K. (2019). Earth's Van Allen Radiation Belts: From Discovery to the Van
Allen Probes Era. J. Geophys. Res. Space Physics. 124. No. 11. 8319-8351, DOI:
(10.1029/2018JA025940)
Love J.J., Thomas J.N. (2013). Insignificant solar-terrestrial triggering of earthquakes.
Geophys. Res. Lett. 40. 1165–1170. doi: 10.1002/grl.50211.
Makarova, L.N., Shirochkov, A.V. (1998). A new approach to the global electric circuit
conception. http://www.sgo.fi/SPECIAL/Contributions/Makarova.pdf
MAGDAS, 2011:
http://www.icswse.kyushuu.ac.jp/MAGDASSchool2011/pdfs/Selected_Papers_of_MAGDAS.pdf.
Marchitelli V., Harabaglia P., Troise C., De Natale G. (2020). On the correlation between solar
activity and large earthquakes worldwide. Sci. Rep. 10. 1–10. doi: 10.1038/s41598-020-67860-3.
Michael, A.J. (2011a) Random variability explains apparent global clustering of large
earthquakes. Geophysical Research Letters. Vol. 38. L21301. Doi:10.1029/ 2011GL049443
Michael, A.J. (2011b) The recent rate of great earthquakes: Global clustering or random
variability. Seismological Research Letters. Vol. 82. ID. NH31A-1525.
Novikov, V., Y. Ruzhin, V. Sorokin, A. Yaschenko (2020). Space weather and earthquakes:
possible triggering of seismic activity by strong solar flares. Annals of Geophysics. 63. 5.
PA554. doi:10.4401/ag-7975
Oliveira, F. D. (2012) Power of earthquake cluster detection tests. arXiv:1204.1131v1 [stat.т AP].
Ouzounov, D., S. Pulinets, K.Hattori, P.Taylor (2018) (Ed’s) Pre-Earthquake Processes: A
Multi-disciplinary Approach to Earthquake Prediction Studies, American Geophysical Union.
Published by John Wiley & Sons, 385p.
Phillips, T., Johnson, S., Koske‐Phillips, A., White, M., Yarborough, A., Lamb, A., & Schultz,
J. (2016). Space weather ballooning. Space Weather. 14. 697-703. 703.
https://doi.org/10.1002/2016SW001410
Pulinets, S.A. and K. Boyarchuk (2004). Ionospheric Precursors of Earthquakes, Springer.
Pulinets, S.A. (2009). Physical mechanism of the vertical electric field generation over active
tectonic faults. Advances in Space Research. 44. No. 6). 767–773.
20Pulinets, S. and D. Ouzounov. (2011). Lithosphere-Atmosphere-Ionosphere Coupling (LAIC)
model - An unified concept for earthquake precursors validation, Journal of Asian Earth Sciences 41,
371-382.
Pulinets S., Ouzounov D, A.Karelin, D.Davidenko (2018) Lithosphere–Atmosphere–
Ionosphere–Magnetosphere Coupling- A Concept for Pre‐Earthquake Signals Generation, In the Book:
Pre Earthquake Processes: A Multidisciplinary Approach to Earthquake Prediction Studies (Ed’s:
Ouzounov, et al.). Geoph. Monograph. 234. John Wiley & Sons. 79-98.
Ripoll J.‐F., S. G. Claudepierre, A. Y. Ukhorskiy, C. Colpitts, X. Li, J. F. Fennell, C. Crabtree.
(2019). Particle Dynamics in the Earth's Radiation Belts: Review of Current Research and Open
Questions. Journal of Geophysical Research: Space Physics. 125. 5. e2019JA026735
Sauvaud, J.-A., M. Parrot, and E. Slominska. (2014). Comment on “Comparative study on
earthquake and ground based transmitter induced radiation belt electron precipitation at middle
latitude”, by Sideropoulos et al. (2011). Nat. Hazards Earth Syst. Sci. 14. 1–9. www.nat-hazards-earth-
syst-sci.net/14/1/2014/ doi:10.5194/nhess-14-1-2014.
Schery S. D., S. Huang. (2004). An estimate of the global distribution of radon emissions from
the ocean. Geophysical Research Letters. 31. 19. L19104. doi:10.1029/2004GL021051.
Schery, S. D., and M. A. Wasiolek (1998). Modelling 222Rn flux from the Earth's surface. In
Radon and Thoron in the Human Environment. edited by A. Katase, and M. Shimo. 207– 217. World
Sci. River Edge. N. J.
Sideropoulos, N. F., Anagnostopoulos, G., and Rigas, V. (2011). Comparative study on
earthquake and ground based transmitter induced radiation belt electron precipitation at middle
latitudes. Nat. Hazards Earth Syst. Sci. 11. 1901–1913. doi:10.5194/nhess-11- 1901-2011.
Simpson I.F. (1968). Solar activity as a triggering mechanism for earthquakes. Earth and
Planet. Sci. Letter, 1968, Volume 3. Issue 5. 417-425.
Sobolev, G. A., N. A. Zakrzhevskaya, and E. P. Kharin. (2001). On the relation between
seismicity and magnetic storms. Phys. Solid Earth. 37. 917–927.
Thorne, R. M., W. Li, B. Ni, Q. Ma, J. Bortnik, D. N. Baker, H. E. Spence, G. D. Reeves, M.
G. Henderson, C. A. Kletzing, W. S. Kurth, G. B. Hospodarsky, D. Turner, and V. Angelopoulos
(2013). Evolution and slow decay of an unusual narrow ring of relativistic electrons near L~3.2
following the September 2012 magnetic storm. Geophysical Research Letters. 40. 3507–3511.
Doi:10.1002/grl.50627.
Tsyganenko, N.A. (2008). Geopack: A Set of Fortran Subroutines for Computations of the
Geomagnetic Field in the Earth’s Magnetosphere. http://geo.phys.spbu.ru/~tsyganenko/Geopack2008.
Wilson, C.T.R. (1921). Investigations on lightning discharges and on the electric field of
thunderstorms. Philos. Trans. Roy. Soc. London. 221A. 73–115.
Zhang, G.Q. (1998). Relationship between global seismicity and solar activities Acta
Seismologica Sinica. 11. No. 4. 495-500.
Zhang, X., Fidani, C., Huang, J., Shen, X., Zeren, Z., and Qian, J. (2013). Burst increases of
precipitating electrons recorded by the DEMETER satellite before strong earthquakes. Natural
Hazards Earth System Science. No. 13. 197-209. Doi:10.5194/nhess-13-197-2013.
21You can also read