Mapletree North Asia Commercial Trust - Business Update for the Period from 1 April 2020 to 31 December 2020 (YTD FY20/21)
←
→
Page content transcription
If your browser does not render page correctly, please read the page content below
Mapletree North Asia Commercial Trust
      Business Update for the Period from
1 April 2020 to 31 December 2020 (YTD FY20/21)
                 28 January 2021
Disclaimer

This presentation is for information only and does not constitute an invitation or offer to acquire, purchase or subscribe for units
in MNACT (“Units”). The value of Units and the income derived from them may fall as well as rise. Units are not obligations of,
deposits in, or guaranteed by, the Manager or any of its affiliates. An investment in Units is subject to investment risks, including
the possible loss of the principal amount invested. Investors have no right to request the Manager to redeem their Units while the
Units are listed. It is intended that Unitholders of MNACT may only deal in their Units through trading on the Singapore Exchange
Securities Trading Limited (“SGX-ST”). Listing of the Units on the SGX-ST does not guarantee a liquid market for the Units. The
past performance of MNACT is not necessarily indicative of its future performance.

This release may contain forward-looking statements that involve risks and uncertainties. Actual future performance, outcomes
and results may differ materially from those expressed in forward-looking statements as a result of a number of risks,
uncertainties and assumptions. Representative examples of these factors include (without limitation) general industry and
economic conditions, interest rate trends, cost of capital and capital availability, competition from similar developments, shifts in
expected levels of property rental income, changes in operating expenses, including employees’ wages, benefits and training,
property expenses and governmental and public policy changes and the continued availability of financing in the amounts and
the terms necessary to support future business. You are cautioned not to place undue reliance on these forward looking
statements, which are based on current view of management on future events.
Agenda
YTD FY20/21 Financial Summary
YTD FY20/21 Operational Update
Outlook
Appendix
Omori Prime Building, Tokyo
YTD FY20/21
    Financial
    Summary

4                 Sandhill Plaza, Shanghai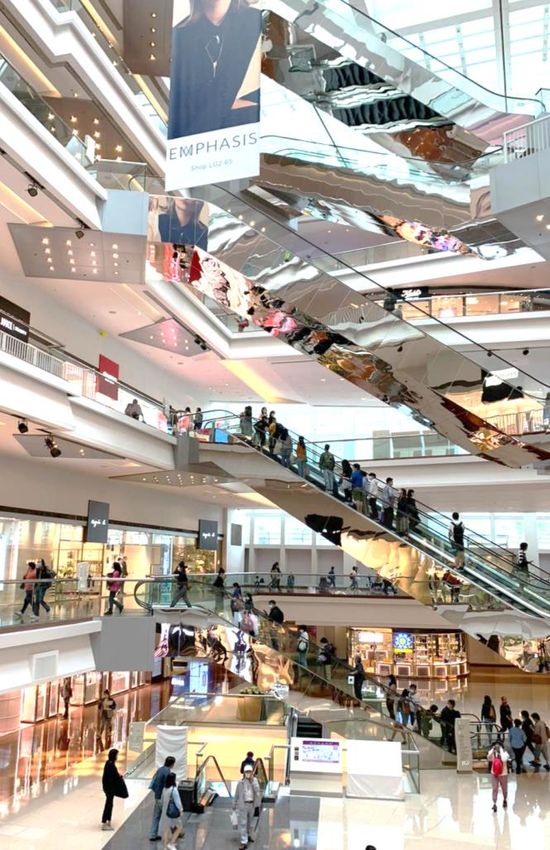
YTD FY20/21 Financial Summary
Gross Revenue1,2
YTD FY20/21 NPI declined by 2.3%. In view of COVID-19, NPI for 3Q FY20/21 was
higher rental reliefs were granted to support tenants at FW higher by 6.2% as a
S$290.8m mall. Average rental rates at FW mall and GW were also lower quantum of rental
4.7% compared to YTD FY19/20 lower in YTD FY20/21. reliefs was extended to
However, the decline was buffered by the full nine months retail tenants at FW mall,
of contributions from MBP and Omori. compared to 2Q
Net Property Income (“NPI”) FY20/21.
In YTD FY19/20, no rental was collected from FW mall
This is in line with the
S$215.4m and office when they were closed3.
progressive easing of the
Notwithstanding the incremental finance costs on restrictive COVID-19
2.3% compared to YTD FY19/20 borrowings to partially fund the acquisitions of MBP, Omori measures in Hong Kong
and TPG, and the stronger average rate of HKD against SAR during the first half
NPI Margin SGD, finance costs in YTD FY20/21 decreased by S$0.7 of the quarter, where
million compared to YTD FY19/20, mainly due to: there was some
74.1% - lower benchmark interest rates; and improvement to the sales
- lower interest rates from the refinancing of borrowings. performance at FW mall.
5.3 ppts compared to YTD FY19/20
1. GW and SP revenue is presented net of applicable value added tax. JP revenue is presented net of consumption tax.
2. The Gross Revenue and NPI from TPG are not consolidated into the same at the portfolio level. This is because the contribution from TPG will be reflected as MNACT's share of profit
after tax, based on its 50% interest.
3. For YTD FY19/20, there was no rental collection during the temporary closure of FW’s mall from 13 November 2019 to 15 January 2020 and its office tower from 13 to 25 November
2019.
FW: Festival Walk; GW: Gateway Plaza; SP: Sandhill Plaza; JP: Japan Properties; TPG: The Pinnacle Gangnam
5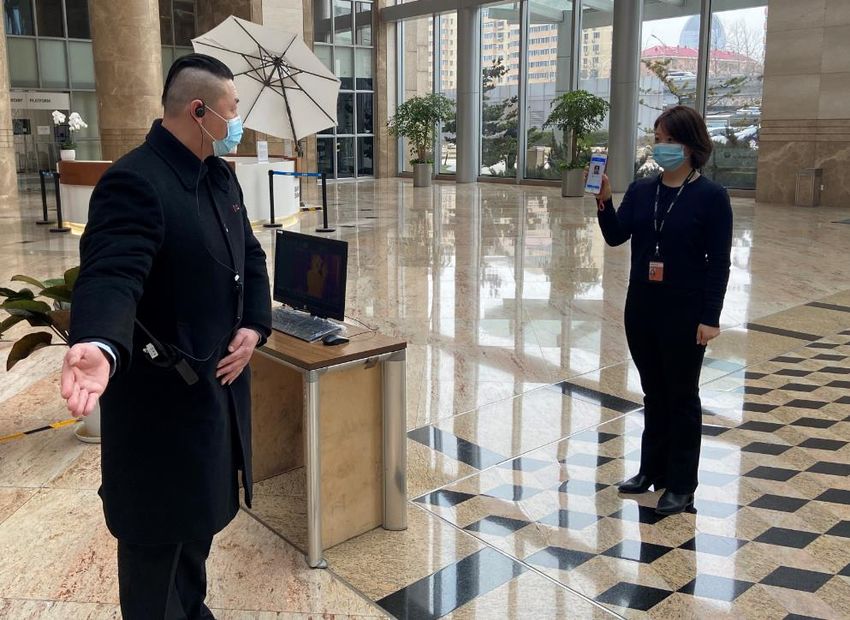
YTD FY20/21 Portfolio Contribution
    (Including contribution from The Pinnacle Gangnam)

                                                             S$292.7m                                                                                     S$216.9m
             Contribution to                                 FW                       47%                         Contribution                            FW       47%
             Gross Revenue1                                  GW                       20%                           to NPI1                               GW       21%
              (YTD FY20/21)                                  SP                         6%                       (YTD FY20/21)                            SP         8%
                                                             JP                       26%                                                                 JP       23%
                                                             TPG2                       1%                                                                TPG2       1%

    1. For presentation purpose, the Gross Revenue and NPI of the portfolio shown on this slide include MNACT's 50% share of the Gross Revenue and NPI from TPG.
    2. Contribution from TPG was from 30 October 2020, following completion of the acquisition.

    FW: Festival Walk; GW: Gateway Plaza; SP: Sandhill Plaza; JP: Japan Properties; TPG: The Pinnacle Gangnam
6
YTD FY20/21 Portfolio Gross Revenue and NPI by Asset
Gross Revenue by Asset (S$m) NPI by Asset (S$m)
1.8 1.5
37.1 76.6 FW 14.2% 28.7 FW 18.5%
17.5 49.8
18.9
62.4 19.0 GW 6.0% 50.2 17.7 GW 7.0%
58.6 46.7
SP 0.8% SP 1.0%
159.3 136.6 JP 106.1% 124.2 101.2 JP 73.9%
TPG N/A TPG N/A
YTD FY19/20 YTD FY20/21 YTD FY19/20 YTD FY20/21
Lower NPI for FW mainly due to a higher quantum of rental reliefs granted and a lower average retail rental rate, taking
into account the loss of revenue last year when Festival Walk was closed temporarily and a higher average rate of HKD
against SGD.
Lower NPI for GW mainly due to a lower average occupancy and average rental rate, partially mitigated by a higher
average rate of RMB against SGD.
Higher NPI for SP was mainly due to a higher average rental rate and a higher average rate of RMB against SGD,
partially offset by a lower average occupancy rate.
Higher NPI for JP was mainly due to a full nine-months of contribution from MBP and Omori.
NPI for TPG: Contribution from 30 October 2020, following completion of the acquisition.
FW: Festival Walk; GW: Gateway Plaza; SP: Sandhill Plaza; JP: Japan Properties; TPG: The Pinnacle Gangnam
7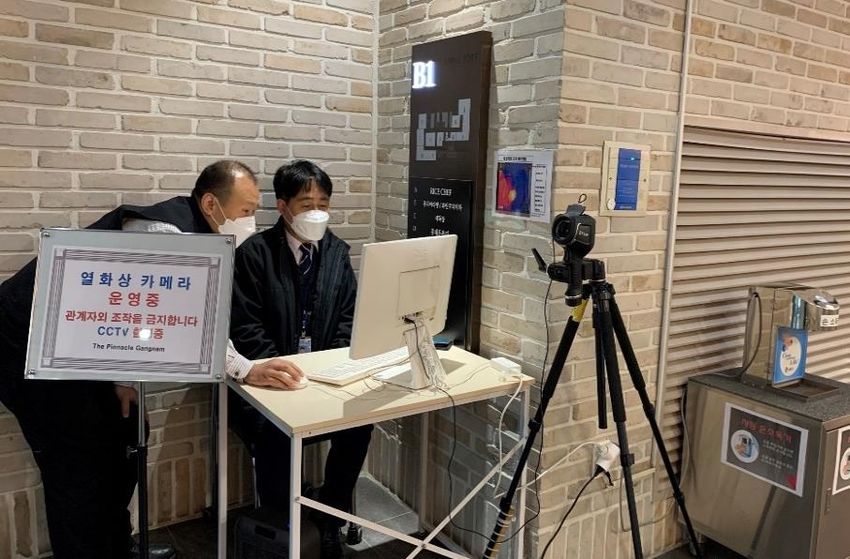
Balance Sheet and Capital Management Metrics
                                                       Assets under                                    Total                                            Net Asset Value
            Balance Sheet                              Management1                                     Gross Debt2                                      per Unit
               Metrics
                                                       S$8,134.6m                                      S$3,489m                                         S$1.306

                                                       30 September 2020:                              30 September 2020:                               30 September 2020:
                                                       S$7,948.3m                                      S$3,322m                                         S$1.337

                                                       Aggregate                                       Interest Cover Ratio on                          Annualised Effective
      Capital Management                               Leverage Ratio1,3,4                             a Trailing 12-Month                              Interest Rate for
                                                                                                       Basis5                                           YTD FY20/21
                                                       41.3%                                           3.4 times                                        2.04% per annum
                                                       30 September 2020:                              30 September 2020:                               YTD FY19/20:
                                                       40.1%                                           3.0 times                                        2.46% per annum
    1. Includes MNACT’s 50.0% effective interest in TPG.
    2. As of 31 December 2020, 74% (30 September 2020: 78%) of MNACT’s debt is unsecured. The secured debt includes JPY onshore borrowings, which are secured against JP, and the
       proportionate share of KRW onshore borrowings, which are secured against TPG.
    3. MNACT holds a 98.47% effective interest in JP and a 50.0% effective interest in TPG. In accordance with Property Funds Guidelines, the leverage ratio is aggregated on a proportionate basis
       based on MNACT’s share of both JPY and KRW onshore borrowings and total assets attributed to JP and TPG.
    4. As of 31 December 2020, MNACT’s share of total debt to net asset value ratio and MNACT’s share of total debt less cash and cash equivalents held in MNACT’s functional currency (SGD) to
       net asset value ratio were 77.3% and 75.8%, respectively.
    5. The interest cover ratios as of 31 December 2020 and 30 September 2020 are based on a trailing 12-month basis and do not take into account the interim insurance proceeds.

8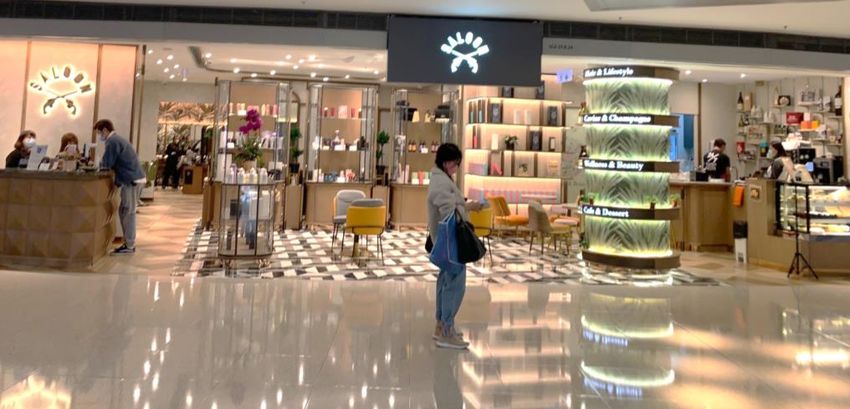
Prudent Capital Management
      Debt Maturity Profile (as of 31 December 2020)                                                                       ~25%
      Total Gross Debt1: S$3,489m                                                               Bank Debt
                                                                                                                          Floating-
     (Denomination: ~59% HKD, ~32% JPY,~5% KRW, ~3% SGD,~ 1% RMB)                               Fixed Rate Notes
                                                                                                                            Rate
              (S$m)                                                                                                                                 Interest Rate                       ~75%
               1,000                                               829         842                                       Borrowings
                 800
                                                                                             814                                                         Risk                        Fixed-Rate
                                                     564           224           41           41
                 600
                                        340           220                                                                                           Management                       Borrowings
                 400                                                            801          773
                                        175                        605
                 200                                  344                                                100
                  -
                            0-          165
                         Mar-21       Mar-22        Mar-23       Mar-24       Mar-25       Mar-26        Mar-27
         % of Total
            Debt
         Maturing by     0%         10%           16%            24%          24%           23%           3%                  ~10%
          End FY
                                                                                                                            Unhedged                                                ~90% of
      • Debt maturity profile remained well staggered with an average                                                                                                             expected DI
        term to maturity of 3.2 years as of 31 December 2020 (30 September                                                                                                            for
        2020: 3.07 years), with no debt refinancing requirements by March                                                                            Forex Risk                   2H FY20/21
        2021.                                                                                                                                       Management                    hedged into
      • Healthy liquidity position as of 31 December 2020 comprising                                                                                                                 SGD
        committed and uncommitted undrawn credit facilities of S$492.6
        million, and cash and bank balances of S$223.9 million.
    1. As of 31 December 2020, cross currency interest rate swaps entered into to swap SGD and HKD denominated medium-term notes to HKD and JPY, and USD and SGD denominated bank
       loans to HKD and JPY. RMB debt relates to onshore debt from acquisition of SP in June 2015. JPY debt relates to debt from acquisition of JP in May 2018 and February 2020, and the HK$580
       million Fixed Rate Notes issued in March 2019 with the swap transaction entered into to swap the HKD fixed interest rate into JPY fixed interest rate. KRW debt and SGD debt refer to onshore
       debt and offshore debt, respectively, from the acquisition of TPG in October 2020.
       Based on exchange rates of S$1= HK$ 5.8052, S$1 = RMB 4.8921, S$1 = JPY 77.9672 and S$1= KRW812.0179 as of 31 December 2020.

9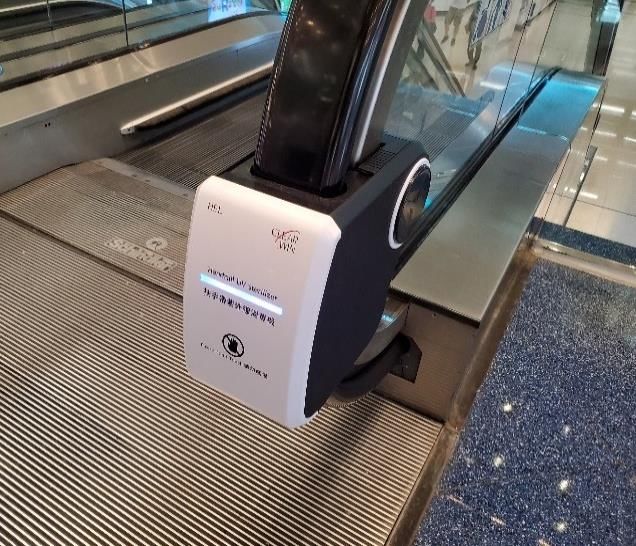
YTD FY20/21
 Operational
     Update

       mBAY POINT Makuhari, Chiba
Portfolio of Commercial Properties in North Asia Providing Income
and Geographical Diversification
As of 31 December 2020,
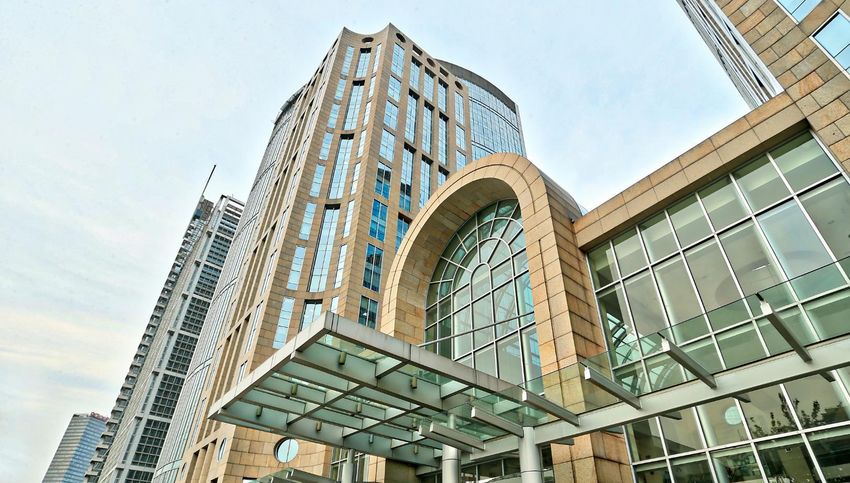
12 Properties Festival Walk
The Pinnacle Gangnam, Seoul
in Beijing, Hong Kong SAR1, (50% effective interest)
Japan, Seoul and Shanghai
Tokyo Tokyo Tokyo Tokyo
Gateway Plaza, Beijing South
S$8.1 billion Korea
Japan
Assets under Management2 Yokohama Chiba Chiba Chiba
China
96.9% (Top) IXINAL Monzen-nakacho Building, Higashi-
nihonbashi 1-chome Building, TS Ikebukuro Building,
Portfolio Occupancy Omori Prime Building
(Bottom) ABAS Shin-Yokohama Building, Fujitsu
Hong Kong SAR Makuhari Building, SII Makuhari Building, mBAY POINT
Sandhill Plaza, Shanghai Makuhari
(collectively known as “Japan Properties”)*
*While MNACT holds a 98.47% effective interest in JP, all property and financial-related figures (e.g. gross rental income, net property income, weighted average lease expiry, occupancy, trade sector breakdown and
valuation) stated in this presentation for JP are based on 100.0% effective interest in JP (which includes the 1.53% effective interest in the JP held by Mapletree Investments Japan Kabushiki Kaisha (“MIJ”)). For TPG,
all property and financial-related figures stated in this presentation (unless otherwise stated) are based on MNACT’s 50.0% effective interest in the property.
1. Where Hong Kong SAR is mentioned in the presentation, it refers to the Hong Kong Special Administrative Region (“SAR”).
2. Includes MNACT’s 50.0% effective interest in TPG, and based on exchange rates of S$1= HK$ 5.8052, S$1 = RMB 4.8921, S$1 = JPY 77.9672 and S$1= KRW812.0179 as of 31
December 2020.
11Portfolio Tenant Mix and Top 10 Tenants
(As of 31 December 2020)
Top 10 Tenants by Monthly GRI
(For the Month of December 2020)
Machinery / Equipment / Manufacturing 15.1%
Tenant Building
Apparel & Fashion Accessories 12.8%
Financial Institution / Insurance / Banking / Real Estate 12.7% 1. BMW GW
Food & Beverages 9.1% 2. Seiko Instruments Inc JP
Automobile 8.0%
Trade Sector by 3. NTT Urban Development JP
Professional & Business Services 6.7%
Gross Rental
Departmental Store & Supermarket 6.5% 4. TaSTe FW
Income (“GRI”)
(For the Month of Services 6.5% 5. ARUP FW
December 2020) Leisure & Entertainment 5.9%
Information Technology
6. Fujitsu JP
5.1%
Personal Cosmetics 4.2% 7. Festival Grand FW
Houseware, Electronics & Furnishings 3.7% 8. Apple FW
Luxury Jewellery,Watches & Accessories 1.9%
• No single trade sector Pharmaceutical / Medical
9. CFLD GW
1.3%
comprises more than
Natural Resources 0.2% 10. Bank of China GW
15.1% of GRI
Others 0.3%
Accounted for 35.6% of the portfolio GRI
12Well-Staggered Lease Expiry Profile
Portfolio Lease Expiry Profile by Percentage of Monthly GRI
(As of 31 December 2020)
29.0%
~3.6% already 24.0%
renewed or re-let 20.0% 21.6%
13.3% 12.7% 13.8%
11.1% 9.7%
9.3%
5.4% 5.7%
2.7% 2.4%0.9%1.9%1.5% 2.3%2.5% 2.1%1.8% 1.5%0.7%
0.7%0.5%1.3%0.2% 0.4% 0.6% 0.4%
FY20/21 FY21/22 FY22/23 FY23/24 FY24/25 and beyond
FW: Lease Expiry by % of GRI GW: Lease Expiry by % of GRI SP: Lease Expiry by % of GRI
JP: Lease Expiry by % of GRI TPG: Lease Expiry by % of GRI Portfolio
Note:
• Lease Expiry Profile: shows the remaining leases to be renewed or re-let as of quarter end.
• WALE is based on the expiry dates of committed leases.
Weighted Average Lease Expiry (“WALE”) by GRI (As of 31 December 2020)
Portfolio: 2.4 years FW: 2.2 years GW: 2.0 years SP: 2.2 years JP: 3.2 years TPG: 2.7 years
1. The portfolio WALE of 2.4 years as of 31 December 2020 was based on committed leases (leases which have been renewed or re-let as of 31 December 2020), with lease
commencement dates before and after 31 December 2020. Excluding committed leases commencing after 31 December 2020 , the portfolio WALE would have been 2.3 years as
of 31 December 2020.
13Update on Festival Walk, Hong Kong SAR
Festival Walk
Hong Kong SAR Retail Market
In Hong Kong SAR, retail sales Occupancy 98.9% Retail
from October 2020 to November (As of 31 December 2020) Compared to 99.0% as of Lower spending by the locals
2020 declined by 6.4%1, an 30 September 2020 amidst the COVID-19 restrictions
improvement compared to the following the resurgence of
24.7% decrease in retail sales Average Rental COVID-19 cases in the city.
from April 2020 to September Retailers remain cautious towards
Reversion2 -17%3 (retail)
2020. (For YTD FY20/21) taking on new leases5.
Following a resurgence of Granted rental reliefs of S$43.5
COVID-19 cases in the city in million in YTD FY20/21 to support
mid-November 2020, tighter Retail Sales4 32.5% year-on-year
tenants.
(For YTD FY20/21)
social distancing measures Office
were re-imposed and extended Stable and resilient: Full occupancy
till 3 February 2021, subject to No leases up for renewal in
Footfall4 42.3%
further review. (For YTD FY20/21)
year-on-year FY20/21.
1. Hong Kong Census and Statistics Department’s “Report on Monthly Survey of Retail Sales for November 2020”. Hong Kong SAR’s retail sales figures for December 2020 have not been published as
of 28 January 2021. Hong Kong’s retail sales from April 2020 to November 2020 declined by 20.6% year-on-year.
2. Average rental reversion is calculated based on the change in the effective rental rates of the new leases compared to the previous leases. It takes into account rent-free periods and step-up rental
rates over the lease term (if any). It excludes rental rates for short-term leases that are less than or equal to 12 months where the rental rates are not reflective of prevailing market rents that are on
normal lease tenure basis.
3. Taking into account the leases on short term renewals, the average rental reversion for Festival Walk for retail leases that were renewed or re-let in YTD FY20/21 would have been -23%.
4. To provide the same basis of comparison, the period of mall closure from 13 November 2019 to 31 December 2019 and the corresponding period in FY20/21 were not taken into account.
5. CBRE Marketview, Hong Kong Retail, 3Q 2020.
14Update on Festival Walk, Hong Kong SAR
On account of the estimated insurance claims for property damage and revenue loss
(“Business Interruption Insurance Amount”) during Festival Walk’s closure, the insurers
have made an additional interim payment of HK$59 million (approximately S$10.5
million) during the quarter.
Total interim insurance payments received as of 31 December 2020 was HK$263
million (approximately S$46 million)1.
These insurance proceeds are non-distributable income, and are recorded as non-
operating income in the financial statements.
As announced on 4 December 2019, the Business Interruption Insurance Amount will
be used to repay the external borrowings incurred to fund the distribution top-ups paid
to unitholders in 3Q FY19/20 and 4Q FY19/20.
Any Business Interruption Insurance Amount in excess of the distribution top-ups will be
distributed to unitholders.
The Manager will continue to work closely with the insurers to finalise the claims.
1. Please refer to MNACT’s SGX-ST Announcement dated 14 October 2020 titled “Update on Festival Walk”.
15Festival Walk Mall – YTD FY20/21 Retail Sales and Footfall
Retail sales and footfall continued to improve during 3Q FY20/21. Comparing 3Q FY20/21 vs 2Q FY20/21, retail sales increased by
19.8% while footfall improved by 24.0%, due to the festive season and progressive easing of the restrictive COVID-19 measures
during the first half of 3Q FY20/21.
However, uncertainties stemming from COVID-19 remain, with the tighter social distancing measures re-imposed in mid-November
2020 and extended till 3 February 2021 expected to impact retail sales.
Monthly Retail Sales and Footfall1 in 2020 Compared to 2019
74.1% 87.4% 84.9%
Retail Sales 63.9% Mall Closure from 13 November
52.6% 65.1% 66.3% 61.8% 2019 to 15 January 2020
Footfall
63.9% 65.6% 71.1% 70.1%
62.0% Resurgence of COVID-19 cases in
47.3% 53.2%
36.8% the city from mid-November 2020
2020 Mar Apr
Apr May
May Jun
Jun Jul
Jul Aug
Aug Sep
Sep Oct Oct Nov2
Nov Dec2 Jan-Feb
Effective from: 28 Mar 24 Apr 8 May 19 Jun 3 Jul 11 Jul 15 Jul 29 Jul 31 Jul 28 Aug 4 Sep 11 Sep 18 Sep 30 Oct 18 Nov 2 Dec 10 Dec
Hong Kong SAR Social Distancing Measures
Ho Launch of Easing of Tightening of Progressive easing Re-imposed
restrictive measures restrictive measures restrictive measures of restrictive measures restrictive measures
Headcount limit for gatherings: 4 4 8 50 50 50 4 2 2 2 2 4 4 4 4 2 2
Restaurants’ capacity limit: 50% 100% 100% 100% 100% 60% 50% 0% 50% 50% 50% 50% 50% 75% 50% 50% 50%
Per table limit for dine-in: 4 4 8 N/A N/A 8 4 0 2 2 2 4 4 6 4 2 2
6pm to 6pm to 9pm to 10pm 10pm 12am 2am 12am 10pm 6pm to
Banned dining in-services from: N/A N/A N/A N/A N/A N/A All Day
5am 5am 5am to 5am to 5am to 5am to 5am to 5am to 5am 5am
Cinema’s capacity limit: Closed 50% 50% 80% 80% Closed 50% 50% 50% 75% 75% 75% Closed
Lessons
Lessons of
Ice rink’s capacity limit: Closed 50% 100% 100% Closed Closed Lessons of ≤ 4 pax of ≤ 4 Closed
≤8 pax
pax
1. Retail sales and footfall in 2020 as a percentage of retail sales and footfall in 2019, for the period from April to November.
2. The mall was closed from 13 November 2019 to 15 January 2020. To provide the same basis of comparison, retail sales and footfall for November includes only 1 to 12
November 2020 and the corresponding period last year, while retail sales and footfall figures in December 2020 were not included in the chart.
16Enhancing Festival Walk Mall as a Lifestyle Hub
Continuously refresh tenant mix and bring in trades that are resilient, including
01
F&B, lifestyle and services
Recruit young and fast moving/trendy/service Introduced a wide range of new F&B concepts
trades into MTR level to capture impulse purchases
Four new restaurants and six confectionery outlets
opened in 3Q FY20/21, including:
Subdivide larger store spaces to smaller ones
One unit at MTR level was subdivided to house two
confectionery brands:
KONJIKI HOTOTOGISU (Michelin-star VA BENE ITALIANO (Traditional
ramen) Italian cuisine)
Bee Cheng Hiang (BBQ meat snack) hana-musubi (Japanese rice balls) lhk Doux Cadeau (Bird nest’s Sweet Fashion House (Patisserie)
desserts)
17Enhancing Festival Walk Mall as a Lifestyle Hub
Continuously refresh tenant mix and bring in trades that are resilient, including
01
F&B, lifestyle and services
Conversion of apparel shops to introduce Continued to bring in fresh yet complementary retail
experiential/service offerings concepts including:
Apparel Shops
CASETiFY STUDiO –Stylish and
custom-made tech accessories Le Fiori - Cakes and floral gifts
Sanrio GIFT GATE – Donguri Republic –
Saloon – Provides hairdressing and personal beauty services. diptyque –Scented candles Gift Merchandise Character-themed merchandise
Customers can enjoy first-class caviar, famous French desserts and fragrance diffusers
and organic pasto (light meals) imported from Italy.
18Enhancing Festival Walk Mall as a Lifestyle Hub
02 Support retailers to boost sales 03 Digital transformation to enrich
via alternative platforms shopping experience and increase
digital touchpoints
‘MyFestival’ Loyalty Programme
Partnership with
Integrated into an enhanced Festival Walk mobile app
Deliveroo for
discounts on Launched in September 2020.
takeaway and Earn “bonus points” from spending at
delivery orders Festival Walk, which can be used to redeem
e-coupons or gifts from the mall’s selected
shops.
Over 32,000 members (as of 31 December 2020)
Sales redemption promotional events
Takeaway launched for members only to encourage
offers by sign-ups.
selected F&B
tenants Use of data analytics to understand shoppers behavior
and preferences to cater to their evolving needs.
19Update on China, Japan and Korea Properties
Gateway Plaza, Beijing Sandhill Plaza, Shanghai Japan Properties The Pinnacle Gangnam, Seoul
Occupancy 92.9% 97.4% 97.9%1 97.5%
(As of 31 December 2020) Compared to 92.2% Compared to 96.9% Compared to 97.8% Compared to 89.6% as of 31 July
as of 30 September 2020 as of 30 September 2020 as of 30 September 2020 2020 (as reported in the
acquisition announcement2)
Average Rental -11% +7% +3% NA4
Reversion3
(For YTD FY20/21)
Updates Recorded a relatively Maintained high Maintained high Achieved higher
(As of 31 December 2020) high occupancy, occupancy and positive occupancy and positive occupancy level, attesting
compared to overall average rental average rental reversion to the attractiveness and
Beijing office vacancy reversion resilience of the asset
rate of 17.0%5 amid market volatilities
1. All Japan Properties except ASY and MBP registered full occupancy as of 31 December 2020. The occupancy rates for ASY and MBP were 92.7% and 94.3%, respectively.
2. Please refer to MNACT’s SGX-ST Announcement dated 25 September 2020 titled “(A) Acquisition of 50.0% Interest in An Office Building Known As “The Pinnacle Gangnam” Located In Seoul, Korea; (B)
Manager To Waive Entitlement To Performance Fees”.
3. Please refer to footnote 2 on slide 14 for definition on Average Rental Reversion.
4. There were no leases with expiry dates from 1 November 2020 to 31 December 2020 at The Pinnacle Gangnam.
20 5. Cushman & Wakefield, Beijing Marketbeat (Office), 4Q 2020.Opportunities to Capture Demand for Office Space
CHINA JAPAN SOUTH KOREA
Continue to ride on China’s economic recovery and growth Key trends Key trends
Promotion of the dual circulation strategy: to boost domestic consumption • Increased usage of • High-growth industries
and domestic market, while facilitating foreign investment decentralised spaces and such as information
Further opening-up of the financial market satellite offices as part of technology (“IT”) and
Technology self-reliance & innovation-driven developments tenants’ business continuity pharmaceutical
Development of Beijing Free Trade Zone (“FTZ”) to support the services planning companies remain
industry1 • Implementation of Japan’s attracted to the
Work Style Reform Act may Gangnam Business
Which support these demand drivers for offices/business parks:
drive demand for satellite District (“GBD”) in
offices near residential areas Seoul
Technology, Media, and Semiconductors
Telecommunications (“TMT”) Expected to benefit MNACT’s assets in Japan and South Korea:
JP, located mainly in fringe TPG, located in GBD,
Expected to benefit MNACT’s assets in China: office areas or suburban office would be able to continue
GW, located within the Chaoyang markets, are expected to be to tap on the increase in
SP is located in Zhangjiang able to capture potential office demand.
District and being part of the Beijing
Science City, Shanghai, which is demand arising from the
FTZ, is expected to benefit from a
a key cluster for semiconductor above trend.
potential increase in leasing demand
and IT companies.
due to wider business opportunities2.
1. Colliers, “Beijing Free Trade Zone helps accelerate Beijing office market development” (30 November 2020).
2. Savills, Beijing Office, October 2020.
21Safety of our Shoppers and Tenants Remains a Key Priority
FW SP JP
Other precautionary measures continue
to be in place:
Hand sanitizers are placed at
common areas for use by shoppers
and tenants.
UV disinfection devices on the Antimicrobial layers applied on high-
handrails of escalators located Cleaning and disinfection of common areas and high- touch surfaces at FW.
at high traffic areas within FW contact areas
GW TPG
Increased cleaning frequency for
air filters.
Notices are placed at the lift lobbies
as a reminder for tenants to adhere to
social distancing measures and/or
wear masks.
Non-contact temperature screening stations at GW and TPG
22Outlook 23 Gateway Plaza, Beijing
Outlook
There are green shoots of economic recovery in 2021. However, new waves of COVID-19 and uncertainties around vaccination rates may pose
risks to the onset or pace of recovery.
Hong Kong SAR
Leasing momentum is forecasted to remain weak as retailers are expected to remain cautious towards taking on new leases1.
For FW, the average renewal or re-let rental rate for FY20/21 is expected to be lower compared to FY19/20.
Our priority is to maintain high occupancy. And with the continuing impact on retail sales from the restrictive COVID-19 measures, we
remain committed to support our retail tenants through further rental reliefs on a case-by-case basis.
Continue to actively reposition tenant mix, roll out F&B takeaway promotions, organise various shopping and dining reward programmes
and pursue further digitalisation initiatives to enrich shopping experience and increase touchpoints.
Beijing, China
The office market2 remains under pressure due to new supply and slower absorption, even as market demand has resumed to some extent.
There were fresh restrictions implemented in Beijing towards the end of December 2020, after several COVID-19 infections emerged within
the city.
Inspections for new leasing are expected to slow in the near term.
City-wide vacancy is expected to rise to close to 20%.
Continue to focus on maintaining occupancy levels and retaining tenants for GW.
Shanghai, China
The COVID-19 situation remains stable, with few reported cases of COVID-19 infections.
For Shanghai offices3, despite a recovery in demand, the leasing strategies of companies remain conservative.
SP, a decentralised business park property which offers affordable rents compared to centralised office districts, is expected to remain
resilient.
1. CBRE Marketview, Hong Kong Retail, 3Q 2020.
2. Savills, Beijing Office, October 2020.
3. JLL, Asia Property Digest, 3Q 2020.
24Outlook
Greater Tokyo, Japan
State of emergency was declared for Tokyo, Saitama, Kanagawa and Chiba in January 2021 amidst the resurgence of COVID-19 cases.
Office vacancy rates in Tokyo are likely to inch up while average rental rates are expected to remain flattish due to subdued demand for
office space1.
Located mainly in fringe office areas or suburban office markets, JP are expected to maintain a stable performance given the gap in rental
costs between fringe/suburban offices and central office areas, and potential demand from tenants as they increase the use of
decentralised spaces as part of their business continuity planning.
Seoul, Korea
Social distancing rules were tightened since mid-November 2020 and extended until 31 January 2021 to curb the spread of COVID-19.
Grade-A office buildings in Seoul2 that provide great ventilation and work environment still remain in high demand.
IT and game companies are expected to expand their reach in Gangnam.
TPG, with Grade A specifications and a low vacancy rate, is expected to provide a stable income stream, underpinned by the embedded
annual rental escalations within the lease terms for most of the leases and continued demand from office users seeking upgrade, relocation
or expansion.
The full quarter’s contribution from TPG in 4Q FY20/21 and beyond will further diversify MNACT’s income streams.
MNACT
In view of the effects of the COVID-19 on the global economy and our operating environment, MNACT’s performance in FY20/21 is expected
to be lower than that in FY19/20.
We will continue to support our tenants, maintain high occupancy and adopt our disciplined approach of active asset management and
diversification through acquiring accretive assets in North Asia.
1. Savills, 2020 Review and 2021 Prospects, Japan, December 2020.
2. JLL, Korea Property Digest, 3Q 2020.
25Thank You 26
mBAY POINT
   Makuhari

                                   SII Makuhari
                                   Building

                Fujitsu Makuhari
                Building

Appendix
                                            MNACT’s properties in Chiba, Japan
Overview of Mapletree North Asia Commercial Trust (“MNACT”)
Singapore’s first commercial REIT with properties in China, in Hong Kong SAR and in Japan
(listed since 7 March 2013)
Trust Structure
Investment Mandate
Sponsor
Public
To invest in a diversified portfolio of Mapletree Investments Unitholders
Pte Ltd (“MIPL”)
income-producing real estate used
South Korea 37% 63%
primarily for commercial purposes 100%
located in Greater China, Japan and REIT Manager Trustee
South Korea1. Mapletree North Asia DBS Trustee
Commercial Trust Limited
Key markets include Tier-1 cities Management Ltd. (the “Trustee”)
(Beijing, Shanghai, Guangzhou and
Shenzhen) and key Tier-2 cities in
100%
China, in Hong Kong SAR, in Japan
and in South Korea.
Property Manager
Mapletree North Portfolio
Asia Property
Management
S$3.3b S$8.1b 37% Limited
Festival Walk
Gateway Plaza
Unitholdings held by Sandhill Plaza
Market Capitalisation2 Assets under Management3 Japan Properties
Sponsor4 The Pinnacle Gangnam
1. Please refer to MNACT’s SGX-ST Announcement titled “Expansion of Investment Mandate” dated 25 September 2020.
2. Based on unit closing price of S$0.970 on 31 December 2020.
3. Includes MNACT’s 50.0% effective interest in The Pinnacle Gangnam, and based on exchange rates of S$1= HK$ 5.8052, S$1 = RMB 4.8921, S$1 = JPY
77.9672 and S$1= KRW812.0179.
4. As of 31 December 2020.
28Diversified Portfolio of Quality Commercial Assets
Festival Walk, Gateway Plaza, Sandhill Plaza, Japan Properties, The Pinnacle Gangnam,
Hong Kong SAR Beijing, China Shanghai, China Greater Tokyo Seoul
One of the largest malls in A premier Grade-A office A premium business park Eight Freehold Properties in Freehold office building,
Hong Kong SAR, and nestled building, located in Lufthansa development located in Tokyo, Chiba and Yokohama located at Nonhyeon-dong,
in the local catchment area of Area (Third Embassy Area) Zhangjiang Science City in Gangnam-gu in Seoul.
Kowloon Tong. in Beijing. Pudong New Area.
• Net Lettable Area: • Net Lettable Area: • Net Lettable Area: • Net Lettable Area: • Net Lettable Area:
74,171 sqm 106,456 sq m 63,284 sq m 240,039 sq m 44,444 sq m
Retail (73%), Office (27%) Office (89%), Podium (11%) Office (97%), Amenities (3%) – Based on 100% interest
• Property Value1: • Property Value1: • Property Value1:
• Property Value1: • Property Value2:
HK$27,000m RMB6,553m RMB2,424m
JPY107b KRW226b – 50.0% interest
• Land Use Right Expiry: • Land Use Right Expiry: • Land Use Right Expiry:
• Land Use Right Expiry: • Land Use Right Expiry:
30 June 2047 25 February 2053 3 February 2060
Freehold Freehold
• Year of Acquisition: • Year of Acquisition: • Year of Acquisition:
• Year of Acquisition: • Year of Acquisition:
2013 (IPO) 2013 (IPO) 2015
2018 (6 assets) and 2020
2020 (2 assets)
1. Based on valuations performed by independent valuers as of 30 September 2020.
2. Purchase price of The Pinnacle Gangnam acquired on 30 October 2020.
29Continue to Pursue Diversification of Portfolio to Reduce Geographical
and Income Concentration
Investing in assets across diversified markets in China, Hong Kong SAR, Japan and South Korea enhances
31 Dec 2020:
our ability to deliver sustainable returns.
S$8.1 billion
7 March 2013 (IPO) FY15/16 Assets under
17 June 2015: Management
Mapletree Greater China 30 Sep 2020:
Commercial Trust (“MGCCT”) Acquisition of Sandhill S$7.9 billion
was listed on SGX-ST with Plaza in Shanghai. 31 Mar 2020:
two assets, Festival Walk S$8.3 billion
and Gateway Plaza. 31 Mar 2019:
S$7.6 billion 30 October 2020:
31 Mar 2018:
Completed acquisition of
S$6.3 billion
50% interest in The
31 Mar 2017: Pinnacle Gangnam, Seoul
S$6.2 billion
31 Mar 2016:
S$5.9 billion
31 Mar 2015:
S$5.3 billion
31 Mar 2014:
S$4.7 billion
FY18/19 FY19/20
7 Mar 2013 25 May 2018:
28 February 2020:
S$4.3 billion Completed acquisition of 6 freehold office
Completed acquisition of 2
properties located in Greater Tokyo.
freehold office properties
With effect from 25 May 2018, MGCCT was
located in Greater Tokyo.
renamed Mapletree North Asia Commercial
Trust.
30Strong Alignment with Unitholders
Management is incentivised to deliver sustainable and quality DPU growth.
• First S-REIT with no AUM-based fee structure
• Performance-based feature incentivises the Manager to grow DPU
Management Fee Structure
REIT Base Fee: 10.0% of Distributable Income1
Management Fee Performance Fee: 25.0% of the difference in DPU in a financial year with the DPU in the preceding financial year2 multiplied by the weighted average
number of Units in issue for such financial year.
The Performance Fee is payable if the DPU in respect of any financial year exceeds the DPU in the preceding financial year, notwithstanding that the DPU
in such relevant financial year may be less than the DPU in the financial year prior to the preceding financial year.
As announced on 25 September 20203, the Manager will waive its entitlement to any performance fee as provided under the Trust Deed
(“Performance Fee”) until such time that the DPU exceeds 7.124 cents (“Threshold DPU”), which was the DPU achieved in FY19/20, prior to
the full year impact of COVID-19
Upon MNACT’s DPU performance exceeding the Threshold DPU, the waiver will cease (and the Threshold DPU will no longer be applicable) in
subsequent years, and the Manager will continue to be entitled to receive the Performance Fee in accordance with the Trust Deed.
100% paid in units since listing
Property 2.0% of Gross Revenue
Management Fee 2.0% of Net Property Income
PM fees relating to Festival Walk and Gateway Plaza: 100% paid in units since listing
PM fees relating to Sandhill Plaza, Japan Properties and The Pinnacle Gangnam: 100% paid in cash 4
Acquisition Fee 0.75% for acquisitions from Related Parties
1.0% for all other acquisitions
1. In relation to the Japan Properties, the asset management services are provided by the Japan Asset Manager. In view of the fees payable in cash to the Japan Asset Manager for the Japan Properties, the Manager has
elected to waive the Base Fee (which it is otherwise entitled to under the Trust Deed) for as long as the Manager and the Japan Asset Manager are wholly-owned by Mapletree Investments Pte Ltd and the Japan Asset
Manager continues to receive the Japan Asset Management Fee in respect of the Japan Properties.
2. Calculated before accounting for the performance fee in each year.
3. Please refer to MNACT’s SGX-ST announcement dated 25 September 2020 titled “A) Acquisition of 50.0% Interest in an Office Building Known as “The Pinnacle Gangnam” located In Seoul, Korea and B) Manager to Waive
Entitlement to Performance Fees”.
4. For Sandhill Plaza, the Manager has elected to pay the Property Manager the Property Management Fee in cash from the date of acquisition on 17 June 2015. For six of the Japan Properties (MON, HNB, TSI, ASY, SMB
and FJM) acquired on 25 May 2018 and two of the Japan Properties (Omori and MBP) acquired on 28 February 2020, the Property Management Fee is payable in cash to the Japan Property Manager from the date of their
acquisitions. For The Pinnacle Gangnam, the Manager will elect to pay the Property Manager the Property Management Fee in cash.
31You can also read