Prudent public health intervention strategies to control the coronavirus disease 2019 transmission in India: A mathematical model-based approach ...
←
→
Page content transcription
If your browser does not render page correctly, please read the page content below
[Downloaded free from http://www.ijmr.org.in on Tuesday, March 24, 2020, IP: 182.69.234.241]

      Indian J Med Res, Epub ahead of print                                                                                     Quick Response Code:

      DOI: 10.4103/ijmr.IJMR_504_20

      Prudent public health intervention strategies to control the coronavirus
      disease 2019 transmission in India: A mathematical model-based
      approach

      Sandip Mandal1, Tarun Bhatnagar3, Nimalan Arinaminpathy4, Anup Agarwal1, Amartya Chowdhury1,
      Manoj Murhekar†, Raman R. Gangakhedkar2 & Swarup Sarkar1

      1
        Translational Global Health Policy Research Cell (Department of Health Research), 2Division of Epidemiology
      & Communicable Diseases, Indian Council of Medical Research, New Delhi, 3ICMR School of Public Health,
      †
        ICMR-National Institute of Epidemiology, Chennai, Tamil Nadu, India & 4Department of Infectious Disease
      Epidemiology, School of Public Health, Imperial College, St Mary’s Hospital, London, UK

      Received February 27, 2020

                     Background & objectives: Coronavirus disease 2019 (COVID-19) has raised urgent questions about
                     containment and mitigation, particularly in countries where the virus has not yet established human-to-
                     human transmission. The objectives of this study were to find out if it was possible to prevent, or delay,
                     the local outbreaks of COVID-19 through restrictions on travel from abroad and if the virus has already
                     established in-country transmission, to what extent would its impact be mitigated through quarantine of
                     symptomatic patients?
                     Methods: These questions were addressed in the context of India, using simple mathematical models
                     of infectious disease transmission. While there remained important uncertainties in the natural history
                     of COVID-19, using hypothetical epidemic curves, some key findings were illustrated that appeared
                     insensitive to model assumptions, as well as highlighting critical data gaps.
                     Results: It was assumed that symptomatic quarantine would identify and quarantine 50 per cent of
                     symptomatic individuals within three days of developing symptoms. In an optimistic scenario of the
                     basic reproduction number (R0) being 1.5, and asymptomatic infections lacking any infectiousness, such
                     measures would reduce the cumulative incidence by 62 per cent. In the pessimistic scenario of R0=4, and
                     asymptomatic infections being half as infectious as symptomatic, this projected impact falls to two per cent.
                     Interpretation & conclusions: Port-of-entry-based entry screening of travellers with suggestive clinical
                     features and from COVID-19-affected countries, would achieve modest delays in the introduction of
                     the virus into the community. Acting alone, however, such measures would be insufficient to delay the
                     outbreak by weeks or longer. Once the virus establishes transmission within the community, quarantine
                     of symptomatics may have a meaningful impact on disease burden. Model projections are subject to
                     substantial uncertainty and can be further refined as more is understood about the natural history of
                     infection of this novel virus. As a public health measure, health system and community preparedness
                     would be critical to control any impending spread of COVID-19 in the country.

      Key words Airport screening - COVID-19 - deterministic model - mathematical model - mitigation - quarantine - transmission

      © 2020 Indian Journal of Medical Research, published by Wolters Kluwer - Medknow for Director-General, Indian Council of Medical Research
                                                                          1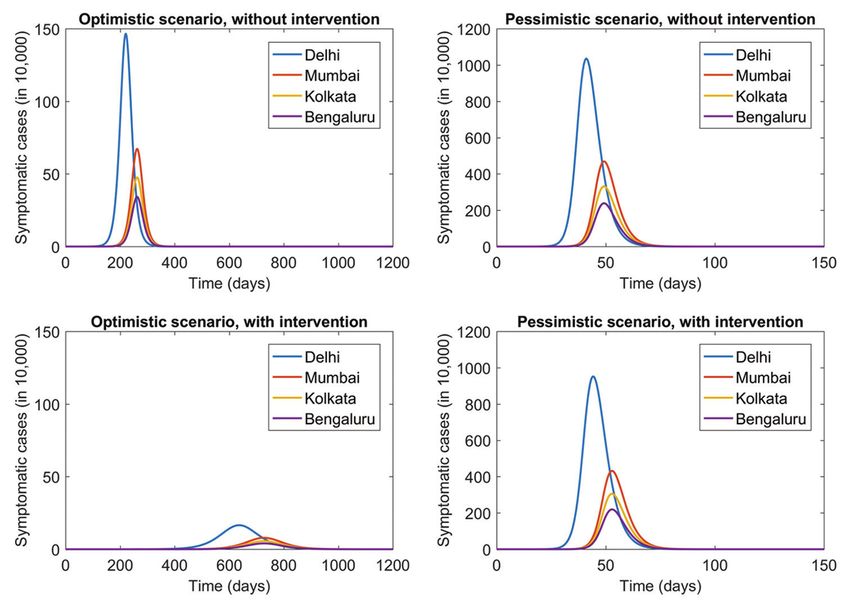
[Downloaded free from http://www.ijmr.org.in on Tuesday, March 24, 2020, IP: 182.69.234.241]
2 INDIAN J MED RES, 2020
As per the World Health Organization (WHO), spread of the outbreak. This analysis was done with
85,403 cases of coronavirus disease 2019 (COVID-19) the following objectives: (i) is it feasible to prevent, or
were reported globally, as of February 29, 2020, delay, the local outbreaks in India through restrictions
including 79,394 cases (2838 deaths) from China and on travel from countries with COVID-19 transmission;
6009 cases (86 deaths) from 53 other countries/territories/ and (ii) in the event that COVID-19 transmission
areas1. Initially, all of the cases detected in countries becomes established in India, the extent to which its
other than China were linked to infected cases from impact could be mitigated through quarantine.
China, with subsequent generation of cases in some Material & Methods
of the countries, the latest being Japan, South Korea
and Italy. Considering the high population mobility This analysis was based on a simple
through air travel and the documented person-to-person Susceptible-Exposed-Infectious-Recovered (SEIR)
transmission, the WHO provided an advisory on exit model to capture the natural history of COVID-19
screening in countries with the ongoing transmission and its transmission dynamics. The model structure
of COVID-19 and entry screening in countries is summarised in Fig. 1, with the following governing
without transmission, including screening for the equations:
signs and symptoms of respiratory infection with dS
focus on temperature screening to detect potential = −S
dt
suspects who would require further laboratory tests
for the confirmation of infection2. As per a stochastic, dE
= S − rE
worldwide, air transportation network dynamic model, dt
India ranks 17th among the countries at the highest risk dI
of importation of COVID-19 through air travel3. The = rE − I − I
dt
probability of an infected air traveller to come to India
as the final destination was 0.209 per cent, with the I k E
=
+
highest relative import risk in Delhi (0.064%) followed N N
by Mumbai, Kolkata, Bengaluru, Chennai, Hyderabad where the compartments are as follows: susceptible
and Kochi3. This in the context of an epidemic that has (S); exposed and infectious but not yet symptomatic
already set in and travel from infected areas continues. (E); infected and symptomatic (I) and recovered
The Ministry of Health and Family Welfare (MoHFW) (R). Model parameters are as follows: among those
of India had initially advised to refrain from travelling
to China and quarantine of those coming from China4.
Those returning from Wuhan, China, after January 15,
2020 were to be tested for COVID-19. Those feeling sick
within a month of return from China were advised to report
to the nearest health facility in addition to maintaining
self-isolation at home5. Initially, thermal entry screening
of passengers from China was established at 21 airports
across the country with universal screening for all flights
from China, Hong Kong, Singapore, Thailand, Japan,
South Korea, Iran and Italy. Symptomatic passengers
Fig. 1. Summary of the model structure used to represent coronavirus
were advised to volunteer for screening. Similar screening disease 2019 transmission and control in Indian cities. The population
was in place at international seaports6. Till February 29, in each metropolitan area is divided into different compartments,
2020, three cases were reported from India7. representing states of disease, with flows between compartments
given by the rates shown in the diagram. Thus, susceptible individuals
In the absence of a licensed vaccine or effective (S), upon acquiring infection, enter a state of asymptomatic infection
therapeutics for COVID-19, in addition to the (E) and with some delay develop symptomatic disease (I). It is
assumed that a proportion p of symptomatic cases is subject to
non-pharmaceutical measures of hand hygiene and quarantine [I(q)] and the remainder [I(n)] is not. The relative size of
cough etiquettes, quarantine becomes a critical these two populations (p) reflects the coverage of quarantine efforts.
strategic containment and mitigation intervention Individuals in I(q) are quarantined with an average quarantine delay
(1/δ). Finally, individuals may be cured (R) or die as per recovery
towards the early detection and isolation of cases to rate (γ) or mortality rate (µ), respectively. Those people who are
break the chain of transmission and slow down the successfully quarantined (Q) do not contribute to onward infection.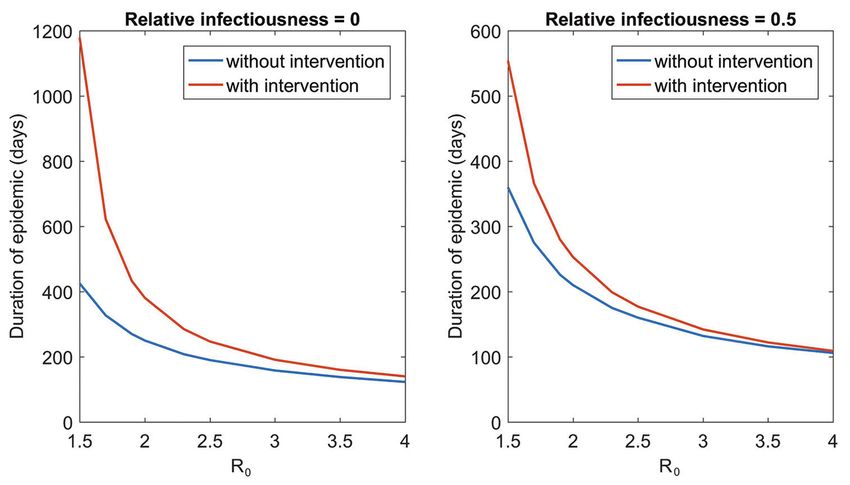
[Downloaded free from http://www.ijmr.org.in on Tuesday, March 24, 2020, IP: 182.69.234.241]
MANDAL et al: MATHEMATICAL MODELS FOR COVID-19 INTERVENTIONS IN INDIA 3
Table I. Model parameters for optimistic and pessimistic To calculate the latter, it was assumed that each day,
scenarios of coronavirus disease‑19 transmission in India there were a total of A arrivals from the source region
Parameters Optimistic Pessimistic into Indian airports, ignoring seasonality or secular
scenario scenario temporal trends. Recalling that E(source) (t) and I(source) (t)
Basic reproduction number (R0) 1.5 4 are proportions, then on any given day, the proportion
Infectiousness of asymptomatic 0 0.5 of airport arrivals that is infected and asymptomatic
cases, relative to symptomatic is E(source) (t). If we assume that symptomatic cases
case (k) are m times less likely to travel than those without
symptoms, then the proportion of arrivals being infected
and symptomatic is I(source) (t)/m. Further, assuming
that as a result of airport screening, a proportion pE
exposed, per-capita rate of developing symptoms (r);
of infected and asymptomatic cases is stopped at the
among symptomatics, per-capita rates of recovery and
airport before entering the community, and likewise for
death (γ and µ, respectively) and the average number
a proportion pI of infected and symptomatic cases.
of infections caused per day per symptomatic case (β)
and the infectiousness of exposed/asymptomatic cases, Putting these factors together, the number of cases
relative to symptomatic (k). of E being introduced into the community in India, per
day would be calculated as:
With the evolving understanding of the natural
history of COVID-19 infection, it was assumed that Introductions of E on day τ ~ Bin (A,q[τ])
all infections would go through an asymptomatic where ‘Bin’ denotes a binomial distribution, and
stage lasting three days on an average, followed by
q ( ) = ∫E (t ) dt
(d )
a symptomatic stage, also lasting three days on an
average. Previous work has shown that the extent of
transmission that occurs before symptoms develop can We modelled similarly for the number of
be an important factor in the feasibility of control8. introductions of I on day τ, but with the adjustment m
The estimates for the basic reproduction number (R0) described above.
range between 1.5 and 4.98-16. In the current study, we For traveller demographics, we assume
sought to capture a wide range of possible scenarios by conservatively that A=500, meaning that on an average,
adopting two contrasting scenarios, as listed in Table I. 500 passengers are arriving per day in Indian airports,
Containment: Port-of-entry screening model: First, from areas in China where COVID-19 transmission is
a deterministic epidemic was simulated in Wuhan, established; the prevalence of asymptomatic infection
China, governed by the equations above, to inform in international arrivals is the same as in their city of
projections for the daily introductions of COVID-19 origin and the prevalence of symptomatic infection
is half as much (m=½), assuming that symptomatics
that would arrive on Indian airports. This simulation
are half as likely to travel. Airline transportation
provided estimates for the prevalence of infection
data suggested that, on an average, there were
in China, denoted by E(source) (t) and I(source) (t), for the
3565 passengers arriving from the entire China per
proportion of the population having asymptomatic and
day, in Indian airports, during the period from October
symptomatic infection, respectively, at time t.
2018 to March 201918. We expect this number to have
Then the following stochastic process was been reduced substantially following recent travel
simulated for transmission in India: (i) A transmission restrictions, but the relevant data are not yet publicly
process governed by the equations above, using a available. Thus, we expect our assumption to be an
simple Gillespie algorithm17 to translate these to underestimate.
stochastic dynamics, assuming that infection events are Under the given scenarios for the proportion of
independent of one another; and (ii) Initial conditions asymptomatic and symptomatic cases that would go
being zero prevalence and universal susceptibility, but undetected by screening, we simulated the stochastic
with a time series of ME (τ), MI (τ), introductions of epidemic that would occur in India as a result of the
cases of E and I on day τ into the community, for all τ > daily introductions and estimated the average ‘time to
0 (these being arrivals from China who have not been epidemic’ as the number of days to reach a prevalence
stopped at the airport). of 1000 cases. This threshold, although arbitrary,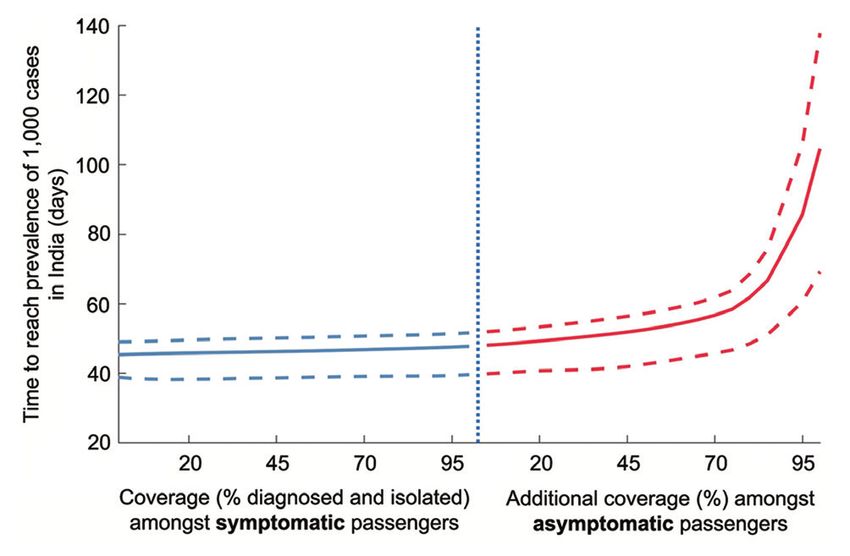
[Downloaded free from http://www.ijmr.org.in on Tuesday, March 24, 2020, IP: 182.69.234.241]
4 INDIAN J MED RES, 2020
represents a level at which it is clear that transmission Table II. Model coefficient for connectivity between cities
has been established in India. Cij Delhi Mumbai Kolkata Bengaluru
Mitigation: Within-country model: In the event that Delhi 1 0.00045 0.00029 0.00058
COVID-19 started spreading in India, we developed a Mumbai 0.00048 1 0.00019 0.00052
mathematical model to simulate the transmission dynamics Kolkata 0.00032 0.00018 1 0.00025
in the four most populated metropolitan areas (Delhi,
Bengaluru 0.00058 0.00052 0.00025 1
Mumbai, Kolkata and Bengaluru metropolitan areas) in
Cij, connectivity between cities i and j
India, as well as their population connectivity. We chose
to focus on these population centres on the assumption
that the introduction of COVID-19 was most likely to as a proxy for cij, while also conducting a sensitivity
occur in international transportation hubs, and thus that analysis to address intercity travel through other
these cities were most likely to be the focal points of means, including rail and road. These coefficients (cij)
initial COVID-19 transmission in the country. were estimated as a proxy for the frequency of daily
population movement between cities as a proportion
As an intervention, we modelled a ‘quarantine of the population of those cities. In sensitivity analysis,
of symptomatics’ scenario wherein a proportion p of we assumed ten times the rates shown in Table II, to
symptomatic cases was quarantined within an average address the potential contributions from the lack of rail
of d days of developing symptoms. To incorporate this and road travel data.
intervention, we adapted the model equations above,
as follows: Using this deterministic model, as summarized in
Fig. 1, we simulated the introduction of COVID-19
dSi
= − i S i and the resulting epidemic in one of the metropolitan
dt areas. We simulated the epidemic in various scenarios
dEi for the proportion of symptomatics being quarantined;
= i Si − rEi the delay to quarantine and the natural history scenarios
dt
are shown in Table I.
(q )
dI i (q ) (q ) (q )
= rpEi − I i − Ii − Ii We present the hypothetical scenario for
dt COVID-19 transmission and interventional effects
dI i
(n ) in Delhi metropolitan area, as an illustration. We
=r (1 − p ) Ei − I i
(n ) (n )
− Ii estimated the time to hypothetical peak epidemic
dt
in days. As an intervention, we modelled a scenario
dQi (q ) where a given proportion of symptomatic cases
= Ii − Qi − Qi
dt (50% at most) could self-quarantine, within a given
dRi (q ) (n )
delay after developing symptoms (at least two days).
= Ii + Ii + Qi The indicators for the impact of intervention on the
dt
hypothetical epidemic scenario were reduction in
I k E cumulative incidence, peak prevalence mitigation
=
i +
N N (proportional reduction in the highest number
∑ cij ( I j ) + kE / N
(q ) (n ) of prevalent cases) and attack rate mitigation
=i + Ij
ij
j j
(proportional reduction in cumulative incidence).
where the subscript i represents city i; I(q) is the number Results
with symptomatic infection who will self-quarantine after Containment: Airport screening: Fig. 2 shows the
an average delay of d days; I(n) is the number who are delays that could be achieved in the introduction of
symptomatic yet do not quarantine and the rate parameter infection within India, as a result of screening airport
δ is the inverse of the average quarantine delay, d. The
arrivals. If symptomatic arrivals alone were screened
infectiousness of exposed/asymptomatic cases, relative to
(blue curve), the model projections for the time to
symptomatic cases, is termed as relative infectiousness (k).
epidemic ranged from 45 to 47.7 days. For illustration,
Finally, cij is the connectivity between cities i we also examined the impact of screening among
and j. We used domestic airline transportation data18 asymptomatic individuals (red curve). Results showed[Downloaded free from http://www.ijmr.org.in on Tuesday, March 24, 2020, IP: 182.69.234.241]
MANDAL et al: MATHEMATICAL MODELS FOR COVID-19 INTERVENTIONS IN INDIA 5
Mitigation: Within-country interventions: Fig. 3
illustrates the hypothetical epidemic dynamics that
would result in the four metropolitan areas, from an
outbreak beginning in Delhi metropolitan area, and
under an ‘optimistic’ scenario for transmission. The
Figure illustrates the seeding of transmission in other
cities that could arise, as a result of air transportation
between these populations. The Figure also illustrates
the impact of a hypothetical intervention, wherein 50
per cent of symptomatic cases are quarantined (whether
voluntarily or through screening and testing), within
an average of three days of developing symptoms.
Such measures could reduce the peak prevalence
Fig. 2. Model projections for the time to epidemic in India substantially, thus minimizing the pressure on public
(the time to reach a prevalence of 1000 cases), under different health services. As a consequence, the intervention
scenarios for the intensity of port-of-entry screening. The left half
of the figure illustrates the effect, on epidemic timing, of screening has the effect of ‘flattening’ the epidemic curve,
symptomatic passengers alone; the right half illustrates the additional distributing cases over a longer duration than in the
effect of diagnosing coronavirus disease-19 amongst asymptomatic absence of intervention. The intervention could reduce
passengers, assuming full screening of symptomatic passengers
(infeasible, but illustrative). Solid lines show central estimates, the cumulative incidence by 62 per cent. We next
whereas dashed lines span 95 per cent of simulated uncertainty illustrate how these impacts may vary, under different
intervals. transmission and intervention scenarios.
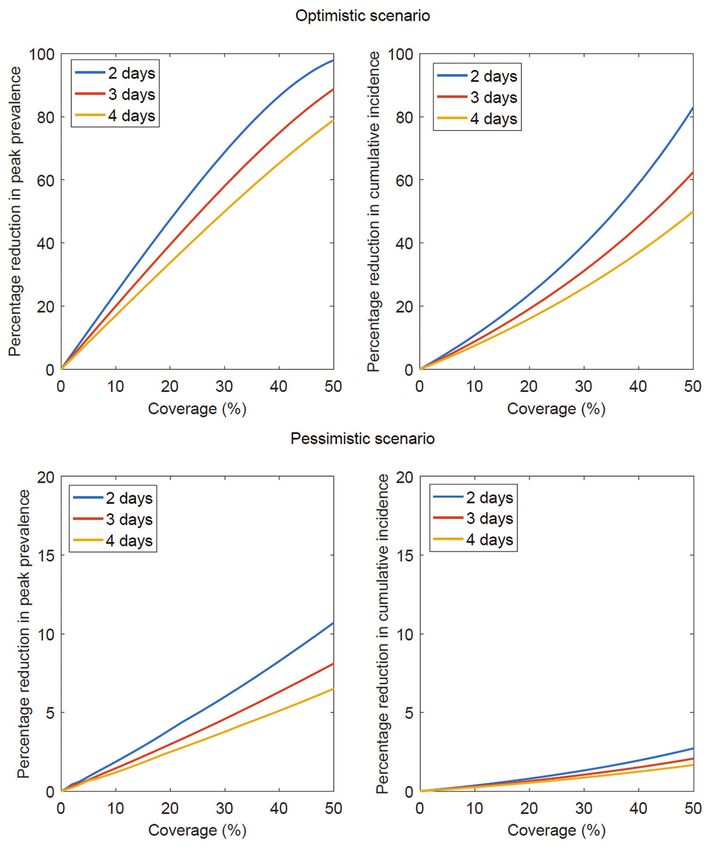
that identifying at least 75 per cent of the asymptomatic Impact of quarantine of symptomatics: In the
individuals was needed, in order to delay the ‘optimistic’ scenario, quarantining 50 per cent of
within-country outbreak by an appreciable amount. symptomatic cases within three days of developing
Additional detection of 90 per cent asymptomatic symptoms would reduce the cumulative incidence by
individuals would delay the average time to epidemic 62 per cent and the peak prevalence by 89 per cent.
by 20 days (Table III). These levels of coverage By contrast in a ‘pessimistic’ scenario, the projected
among asymptomatic cases are practically infeasible, impact on the cumulative incidence falls to two per
requiring almost all passengers from the identified cent and the peak prevalence by eight per cent. The
flights to be screened. However, this hypothetical corresponding impact on peak prevalence is similarly
scenario offers a helpful approach for explaining low, as shown in Fig. 4.
the lack of impact from addressing symptomatic
cases alone (Fig. 2, blue curve). Any containment Fig. 5 shows that the duration of the outbreak would
strategy focused on symptomatic infections, no matter be much lower in the scenario of ‘no intervention’
how comprehensively tends to be negated by the compared to ‘intervention’. As illustrated in Fig. 3, the
asymptomatic infections that escape detection and can overall effect of symptomatic quarantine is to flatten the
go on to cause onward transmission in the community. outbreak and increase the duration of the outbreak.
Table III. Alternate scenarios for the effect of airport entry screening of symptomatic and asymptomatic passengers on the delay in
average time to epidemic (days to reach a prevalence of 1000 cases) in India by R0 and relative infectiousness of asymptomatics
Parameters Delay in average time to epidemic (days)
R0 Relative infectiousness, All symptomatic COVID‑19 All symptomatic COVID‑19 All symptomatic COVID‑19
asymptomatic versus identified, but zero identified, with 50 per cent identified, with 90 per cent
symptomatic diagnosis in asymptomatics diagnosis in asymptomatics diagnosis in asymptomatics
2 0.5 1.2 5.7 16
2 0.1 2.9 7.4 20
4 0.5 0.5 1.9 5.7
4 0.1 0.8 2.9 7.9
COVID‑19, coronavirus disease 19[Downloaded free from http://www.ijmr.org.in on Tuesday, March 24, 2020, IP: 182.69.234.241]
6 INDIAN J MED RES, 2020
Fig. 3. Model projections for the hypothetical epidemic dynamics (symptomatic prevalence over time) with and without intervention under
different scenarios for epidemiologic parameters considering an intervention, in which 50 per cent of the symptomatic cases are isolated
within three days of developing symptoms.
A
B
Fig. 4. Model projections for the per cent reduction in hypothetical peak prevalence and per cent reduction in hypothetical cumulative incidence
by initiation of quarantine of symptomatics within two, three and four days under the ‘optimistic’ (A) and ‘pessimistic’ (B) scenarios described
in the main text.[Downloaded free from http://www.ijmr.org.in on Tuesday, March 24, 2020, IP: 182.69.234.241]
MANDAL et al: MATHEMATICAL MODELS FOR COVID-19 INTERVENTIONS IN INDIA 7
Fig. 5. Projected duration of epidemic (days) for the scenarios with and without symptomatic quarantine at 50 per cent coverage in three days
by R0 and relative infectiousness of asymptomatic cases. Here, the ‘epidemic duration’ is measured as the duration (in days) over which the
prevalence of symptomatic infection is >1 case.
Discussion sensitivity of exit and entry screening and proportion
of asymptomatic cases. Gostic et al20 estimated that
The focus of our analysis was not towards
predicting the burden of COVID-19 cases but to travel screening would miss more than half of the
identify rational intervention strategies that might infected travellers on account of being asymptomatic
work towards control of the outbreak in India. We and being unaware of exposure, emphasizing the
modelled the potential impact of containment strategy need for post-travel symptom tracking among them.
of point-of-entry screening and a mitigation response Our study adds to this by considering the population
through symptomatic screening on hypothetical implications of such leakages in arrival screening.
COVID-19 transmission scenario in India. Our results Our analysis shows that, even if symptomatic cases
suggest that in order to have an appreciable effect are comprehensively identified and quarantined, the
on delaying the establishment of transmission of delay in epidemic timing within India would be in
COVID-19 in India, airport arrival screening will need days and not weeks. According to the data shared by
to have near-complete capture of incoming COVID-19 the Delhi Health Department21, till February 13, 2020,
cases, including asymptomatic cases. Although not 17 of 5700 (0.3%) passengers, who had arrived from
practically feasible using the currently available tools, China and other COVID-19-affected countries prior
our results provide a hypothetical illustration of the to the beginning of airport screening from January 15,
additional benefit of identifying asymptomatic cases: 2020, were found symptomatic and hospitalized, while
if they escape any containment effort, they would the rest were advised for home isolation. The status
tend to negate the effects of that effort, by the onward of another 885 passengers remains unknown21. Entry
transmission that they can cause. Presently, there is screening or travel restrictions may be beneficial in
no accurate, rapid test for COVID-19 that could be reducing the risk of outbreak in countries with relatively
deployed in this setting, to reach the required levels low connectivity to China, and our study illustrates the
of detection among asymptomatic cases; the only way critical importance of community-based measures to
to reach 90 per cent diagnosis among asymptomatic detect potential cases and prevent transmission.
arrivals may be through isolation and quarantine of all We also examined the potential impact of quarantine
arrivals from specified origin airports. Resources may of symptomatics, in controlling transmission within
be better spent on the mitigation of infection in the India, with a focus on four major metropolitan areas.
community. Our results suggest that it may be possible to interrupt
Recent studies indicate that airport screening may the transmission of COVID-19 in India, but only in the
not be able to sufficiently detect COVID-19-infected most optimistic scenarios (for R0 and for coverage).
travellers. Quilty et al19 estimated that 46 per cent Even with high R0 and suboptimal coverage,
(95% confidence interval: 36 to 58) of infected symptomatic quarantine can still achieve meaningful
travellers would not be detected by thermal screening at reductions in peak prevalence, resulting in ‘spreading
airport exit and entry, depending on incubation period, out’ of the outbreak. This would make it easier to cope[Downloaded free from http://www.ijmr.org.in on Tuesday, March 24, 2020, IP: 182.69.234.241]
8 INDIAN J MED RES, 2020
with the peak demand on health services. However, other affected countries, we may expect eight to ten
such measures would have very little effect on the severe and 40-50 non-severe COVID-19 cases for every
overall epidemic size. The actual numerical impact will death25,26. In a closed setting of similar nature as that
be highly sensitive to the natural history of COVID-19, on the cruise ship ‘Diamond Princess,’ we may expect
the parameters for which are very uncertain at present. 26 per cent of the entire population to get infected and
one in 450 infected individuals to die27. We deduce
The WHO Scientific and Technical Advisory Group
that around five per cent of the infected patients will
for Infectious Hazards has recommended continuation
require intensive care and half of those admitted in the
of the containment strategy and monitoring for
intensive care unit will require mechanical ventilation.
the community transmission of COVID-1922. It
Over time, once the model is validated, appropriate
recommends close monitoring of the effectiveness and numbers can be generated for healthcare planning.
social acceptance of public health strategies to control
COVID-19 transmission in the light of its evolving It is pertinent that frontline healthcare workers
epidemiological understanding, including engagement are identified and trained before the outbreak sets
of vulnerable populations, and intensified active in. Health and life insurance should be announced
surveillance22. for healthcare workers if they contract COVID-19.
Considering the reports of a high number of infected
Continuous follow up of passengers returning healthcare workers, measures should be taken to
from COVID-19-affected countries and their contact build biosecurity wards and prepare for the outbreak
tracing for the emergence of suggestive symptoms in earnest. Resources should be earmarked; adequate
would put a high strain on the healthcare system, more supplies should be procured before the outbreak gains
so in the eventuality of the introduction of community momentum. Healthcare workers should be trained in
transmission. The increasing numbers would make it the use of personal protective equipment, screening
impractical to use laboratory testing to confirm each of asymptomatic contacts, isolation measures and
case, and therefore, use of symptomatic surveillance management of COVID-19 cases. Public health
should become the primary public health strategy to measures should be initiated at multiple levels,
detect and respond in the most effective and timely including but not limited to public messaging, and
manner. We could draw examples from the syndromic community health worker-based education.
surveillance approach for influenza-like illness in the
context of H1N123. In practice, this could be achieved Limitations of the model: As with any modelling
either through public advisories for sick individuals study, our analysis has some limitations to note. The
to self-quarantine, along with active engagement with mean duration of asymptomatic and symptomatic
the community, or through intensive surveillance stages is very much uncertain. Some infections may
for symptoms, followed by testing and quarantine. be subclinical and never develop symptoms. In the
A combination of both approaches is likely to be port-of-entry screening model, we adopted simple
needed, although promoting self-quarantine is likely assumptions on the number of daily arrivals from
to be more sustainable in the event that transmission non-coronavirus-affected areas due to lack of data.
becomes widespread. Engagement of local volunteers However, considering that we have only used data
and community-based organizations can provide the for airport arrivals and in particular from China, these
much-needed boost to the efforts of the public health assumptions are likely to be underestimates in the current
system. Considering the widespread use of mobile situation where people are travelling from many other
phones in the country, mobile applications can be countries that are now reporting COVID-19 cases, and
are thus conservative with respect to our conclusions;
used to self-monitoring and sharing of symptom
higher numbers of daily arrivals would tend to narrow
information on a real-time basis. The same was done
the gap in epidemic timing, between baseline and
for monitoring the passengers on the cruise ship off the
interventional scenarios. Other important uncertainties
Japanese coast24.
include natural history parameters, for example, the
With the evolving understanding of COVID-19 average duration of infection; the incubation period
epidemiology, especially the proportion of and the case fatality rate. Though we have tried to
asymptomatic infected cases, it is difficult to predict address some of these uncertainties through examining
the number of beds required or ventilators necessary different scenarios for transmission, yet we caution that
for COVID-19 cases at this stage. As per reports from our model findings may also be sensitive to these other[Downloaded free from http://www.ijmr.org.in on Tuesday, March 24, 2020, IP: 182.69.234.241]
MANDAL et al: MATHEMATICAL MODELS FOR COVID-19 INTERVENTIONS IN INDIA 9
parameters. As more data become available about this symptoms similar to many other lower respiratory tract
new virus, subsequent modelling work can be refined infections. There is a need to engage community-based
accordingly. organizations that can take up the work of symptomatic
surveillance, as well as raising awareness of the need
For the country-level model, for simplicity, we for self-quarantine where possible, and referral to
created hypothetical scenarios only in four metropolitan hospital where necessary, till infection is confirmed.
areas that have the highest population density. These Till that time, assurance of food and supplies should be
areas cover only about seven per cent of the total given following examples of such practices in Kerala29.
population of India. We ignored the rural population It is pertinent to engage with the media on a proactive
surrounded by these areas and their connectivity. basis with the provision of facts promptly such that
Future work to address this gap will benefit from more reporting of these events does not create a picture of the
systematic information on the rates of population flow overwhelming burden of COVID-19 in the country and
between these different settings, data that were not lead to undue anxiety among the population that may
available for our current study. We have simplified negatively influence self-quarantine. Health authorities
our meta-population model by considering constant need to be on alert and be prepared to closely monitor
connectivity between different cities, ignoring the situation with the establishment of an intensified
age-dependent mobility among the population. How surveillance. We advocate for a rational, flexible and
seasonality will change the endemicity of COVID-19 resilient approach that is sensitive to the outbreak
is still unknown and hence not considered in the stage as the health system prepares for the control of
model. Although there appear to be differences in the COVID-19 transmission in India.
immune responses of children compared to adults, for
simplicity, this model has not accounted the disease Financial support & sponsorship: None.
prevalence with age structure.
Comparison of our projected figures with data Conflicts of Interest: None.
from countries such as Japan, the Republic of Korea
References
and Iran can help to validate our model, assuming
similar transmission dynamics in India. It may be 1. World Health Organization. COVID-19 (COVID-19) Situation
Report - 40. Geneva: WHO; 2020. Available from: https://
noted that our analysis is based on the available global www.who.int/docs/default-source/coronaviruse/situation
epidemiological parameters from the initial phase of -reports/20200229-sitrep-40-covid-19.pdf?sfvrsn=849d0665_2,
the outbreak. However, we believe that the predicted accessed on February 29, 2020.
direction of the model-based impact of the proposed 2. World Health Organization. Updated WHO advice for
interventions would remain unaffected, although the international traffic in relation to the outbreak of the
onset, magnitude and timing of the simulated epidemic COVID-19. Geneva: WHO; 2020. Available from: https://
www.who.int/ith/COVID-19_advice_for_international_traffic
may change, even with the use of updated parameter /en/, accessed on February 11, 2020.
values from the evolving global situation of COVID-19
3. Event Horizon - COVID-19. Coronavirus COVID=19 Global
epidemic. Validation of mathematical models using Risk Assessment. Available from: http://rocs.hu-berlin.de/
real-time data is important to gauge the accuracy of corona/#relative-import-risk, accessed on February 26, 2020.
predicted transmission dynamics of infectious diseases. 4. National Centre for Disease Control. Travel Advisory.
While some models for Ebola virus disease27 provided 5 February, 2020. Available from: https://ncdc.gov.in/
fairly reasonable estimates, recent COVID-19 models28 WriteReadData/l892s/63950984511580999086.pdf., accessed
were inconsistent in their prediction. on February 16, 2020.
5. National Centre for Disease Control. COVID-19 outbreak
Public health implications: At present, it is not clear to in China – Travel advisory to travelers visiting China.
what extent the COVID-19 epidemic would establish Available from: https://ncdc.gov.in/WriteReadData/
itself in India. As the introduction of cases may take l892s/34827556791580715701.pdf, accessed on February 11,
2020.
anywhere from a minimum of 20 days to a few months to
be visible, we need to enhance surveillance and prepare 6. Bhargava B. Sudan P. Prepared for the coronavirus. The
Hindu; 11 February, 2020. Available from: https://www.
the community in a proportionate way that is neither thehindu.com/opinion/op-ed/prepared-for-the-coronavirus/
alarmist nor complacent. The critical concerns are the article30785312.ece, accessed on February 15, 2020.
efficiency and timeliness of quarantine and isolation 7. Press Information Bureau. Update on COVID-19: Cases
and the challenges of detection of COVID-19 with and management. Ministry of Health and Family Welfare,[Downloaded free from http://www.ijmr.org.in on Tuesday, March 24, 2020, IP: 182.69.234.241]
10 INDIAN J MED RES, 2020
Government of India; 2020. Available from: https://pib.gov.in/ 21. Press Trust of India. 17 people in Delhi who returned
newsite/pmreleases.aspx?mincode=31, accessed on February from abroad before coronavirus screening showed
29, 2020. symptoms, hospitalised. DTNEXT; February 15, 2020.
8. Wu JT, Leung K, Leung GM. Nowcasting and forecasting the Available from: https://www.dtnext.in/News/TopNe
potential domestic and international spread of the 2019-nCoV ws/2020/02/15172416/1215388/17-people-in-Delhi-who-retu
outbreak originating in Wuhan, China: A modelling study. rned-from-abroad-before-.vpf accessed on February 17, 2020.
Lancet 2020; 395 : 689-97. 22. Heymann DL, Shindo N, WHO Scientific and Technical
9. Imai N, Cori A, Dorigatti I, Baguelin M, Donnelly CA, Advisory Group for Infectious Hazards. COVID-19: What is
Riley S, et al. Report 3: Transmissibility of COVID-19. next for public health? Lancet 2020; 395 : 542-5.
Imperial College London 2020. Available from: https://www. 23. Elliot A. Syndromic surveillance: The next phase of public
imperial.ac.uk/media/imperial-college/medicine/sph/ide/ health monitoring during the H1N1 influenza pandemic? Euro
gida-fellowships/Imperial-2019-nCoV-transmissibility.pdf, Surveill 2009; 14 . pii: 19391.
accessed on February 17, 2020.
24. Sonnemaker T. The Japanese government gave 2,000
10. Riou J, Althaus CL. Pattern of early human-to-human iPhones to passengers stuck on a cruise ship where nearly
transmission of Wuhan 2019-nCoV. bioRxiv 2020. 200 coronavirus cases have been confirmed. Business
[doi: 10.1101/2020.01.23.917351]. Insider; 15 February, 2020. Available from: https://www.
11. Liu T, Hu J, Kang M, Lin L, Zhong H, Xiao J, et al. businessinsider.in/business/news/the-japanese-government-
Transmission dynamics of novel coronavirus (2019-nCoV). gave-2000-iphones-to-passengers-stuck-on-a-cruise-ship-
bioRxiv 2020. [doi: 10.1101/2020.01.25.919787]. where-nearly-200-coronavirus-cases-have-been-confirmed/
articleshow/74143614.cms, accessed on February 16, 2020.
12. Read JM, Bridgen JR, Cummings DA, Ho A, Jewell CP. Novel
coronavirus 2019-nCoV: Early estimation of epidemiological 25. Guan W, Ni Z, Yu H, Liang W, Ou C, He J, et al. Clinical
parameters and epidemic predictions. medRxiv 2020. characteristics of coronavirus disease 2019 in China. N Engl J
[doi: 10.1101/2020.01.23.20018549]. Med 2020. [doi: 10.1056/NEJMoa2002032].
13. Li Q, Guan X, Wu P, Wang X, Zhou L, Tong Y, et al. 26. Coronavirus COVID-19 global cases by the Center for Systems
Early transmission dynamics in Wuhan, China, of novel Science and Engineering (CSSE) at Johns Hopkins University
coronavirus-infected pneumonia. N Engl J Med 2020. (JHU). Available from: https://www.arcgis.com/apps/
[doi: 10.1056/NEJMoa2001316]. opsdashboard/index.html#/bda7594740fd40299423467b48e
14. Shen M, Peng Z, Xiao Y, Zhang L. Modelling the epidemic 9ecf6, accessed on February 28, 2020.
trend of the 2019 novel coronavirus outbreak in China. 27. Ferrández MR, Ivorra B, Ramos AM. Validation of the forecasts
bioRxiv 2020. [doi: 10.1101/2020.01.23.916726]. for the spread of the Ebola virus disease 2018-20 (EVD 2018-20)
15. Backer JA, Klinkenberg D, Wallinga J. The incubation period done with the Be-CoDiS mathematical model; 2020. Available
of 2019-nCoV infections among travellers from Wuhan, from: https://www.researchgate.net/profile/Benjamin_Ivor ra/
China. medRxiv 2020. [doi: 10.1101/2020.01.27.20018986]. publication/339443804_Validation_of_the_forecasts_for_
the_spread_of_the_Ebola_virus_disease_2018-20_EVD
16. Linton NM, Kobayashi T, Yang Y, Hayashi K, _2018-20_done_with_the_Be- CoDiS_mathematical_model/
Akhmetzhanov AR, Jung S, et al. Incubation period links/5e52fe18458515072db797a3/Validation-of-the-fore
and other epidemiological characteristics of 2019 novel casts-for-the-spread-of-the-Ebola-virus-disease-2018-20-EV
coronavirus infections with right truncation: A statistical D-2018-20-done-with-the-Be-CoDiS-mathematical-model.
analysis of publicly available case data. medRxiv 2020.
pdf, accessed on February 27, 2020.
[doi: 10.1101/2020.01.26.20018754].
28. Ivorra B, Ramos AM. Validation of the forecasts for the
17. Gualtieri AF, Hecht JP. Dynamics and control of infectious
international spread of the coronavirus disease 2019
diseases in stochastic metapopulation models. J Life Sci 2011;
(COVID-19) done with the Be-CoDiS mathematical model;
5 : 505-8.
2020. Available from: https://www.researchgate.net/profile/
18. Directorate General of Civil Aviation. Statistics and reports Benjamin_Ivorra/publication/339314163_Validation_of_the_
– Operator year 2019; Directorate General of Civil Aviation. forecasts_for_the_international_spread_of_the_coronavirus_
Available from: https://dgca.gov.in/digigov-portal/?page=jsp/ disease_2019_COVID-19_done_with_the_Be-CoDiS_
dgca/InventoryList/dataReports/aviationDataStatistics/air mathematical_model/links/5e503dd5458515072dafb711/
Transport/domestic/monthly/index.html, accessed on February Validation-of-the-forecasts-for-the-international-spread-of-
15, 2020. the-coronavirus-disease-2019-COVID-19-done-with-the-Be-
19. Quilty BJ, Clifford S, Flasche S, Eggo RM; CMMID nCoV CoDiS-mathematical-model.pdf, accessed on February 27,
Working Group. Effectiveness of airport screening at detecting 2020.
travellers infected with novel coronavirus (2019-nCoV). Euro 29. Maya C. Fighting a virus, yet again: How controlling the
Surveill 2020 ; 25. Nipah outbreak helped Kerala to take on COVID-19. The
20. Gostic K, Gomez ACR, Mummah RO, Hindu; 15 February, 2020. Available from: https://www.
Kucharski AJ, Lloyd-Smith JO. Estimated effectiveness thehindu.com/sci-tech/health/fighting-a-virus-yet-again-
of traveller screening to prevent international spread of how-controlling-the-nipah-outbreak-helped-kerala-to-take-
2019 novel coronavirus (2019-nCoV). medRxiv 2020. on-covid-19/article30825430.ece, accessed on February 18,
[doi: 10.1101/2020.01.28.20019224]. 2020.
For correspondence: Dr Tarun Bhatnagar, ICMR-National Institute of Epidemiology, Ayapakkam, Chennai 600 077, Tamil Nadu, India
e-mail: tarunbhatnagar@nie.gov.inYou can also read