Reliability and Validity of Panorama's Survey Topics for Students: 2020 Update
←
→
Page content transcription
If your browser does not render page correctly, please read the page content below
Reliability and Validity of Panorama’s Survey
     Topics for Students: 2020 Update
Table of Contents
Table of Contents                         2

Executive Summary                         3

Introduction                              4

Methods                                   4
   Topic Development                      5
   Data Source                             7
   Scoring                                7

Results                                   8
   Sample Demographics                    8
   Survey Satisficing                     9
   Reliability                            11
   Structural Validity                    11
   Convergent and Discriminant Validity   12

Conclusion                                14

References                                15

                                          2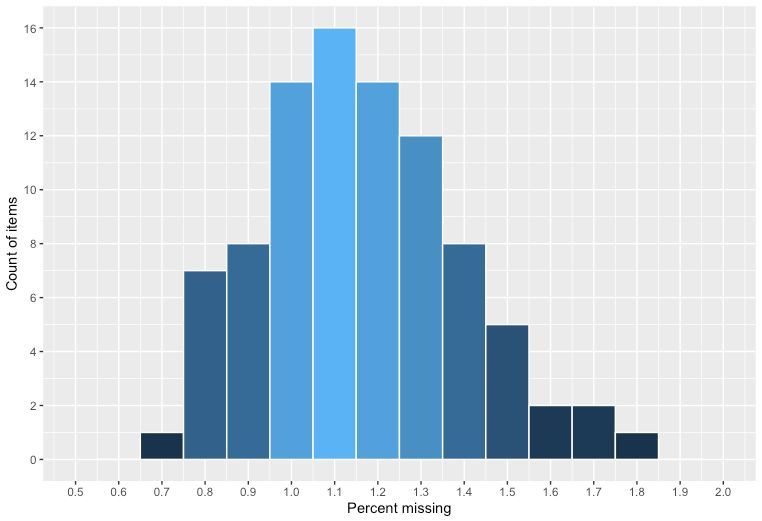
Executive Summary
Panorama Education's student surveys cover a range of topics about students' social-emotional
learning (SEL) and school environments. Students are more than just respondents for these
self-report surveys: By reflecting on their experiences and sharing their perspectives, they are
active agents in their own learning and in their school’s improvement. We developed our student
surveys using a rigorous six-step design process that builds reliability and validity into them from
the beginning (Gehlbach & Brinkworth, 2011; see also Artino, La Rochelle, DeZee, & Gehlbach,
2014). We analyzed data from millions of students in thousands of K-12 schools across the U.S to
demonstrate the psychometric strength of our surveys. Specifically, findings showed that:
1. Almost all students answered all of the questions in a topic. Even for the topic with the
lowest completion rate, 93.3% of respondents answered every question, suggesting that
non-response bias is not an issue for our survey results.
2. Our survey topics exhibit strong reliability by exceeding the conventional thresholds of
internal consistency.
3. Our topics demonstrate strong structural validity, meaning that the items making up each
topic do indeed belong together as part of a single construct.
4. Our topics evidence both convergent and discriminant validity in that they show higher
correlations with theoretically related constructs and lower correlations with theoretically
unrelated constructs.
Panorama's surveys are available to all on our website. These measures of students' SEL and
school environments offer a research-backed means to inform the work of educators,
policymakers, and researchers.
3Introduction
In this report, we describe the development of Panorama's student survey topics and provide
updated evidence for their reliability and validity. We consolidate and expand on past reports
(Panorama Education, 2015a, 2015b, 2016, 2019) by covering the full range of topics from our
student surveys, including those that measure social-emotional learning (SEL), as well as those
that capture students’ perceptions of their school, classrooms, and teachers. This report presents
psychometric results from much larger datasets than past reports and also takes advantage of a
broader range of data sources. Our goal in presenting these results is to inform not just
educators and experts from the schools, districts, states, and organizations that we partner with,
but also the larger community of policymakers and practitioners interested in educational
measurement, human development, and school improvement.
For educators interested in measuring SEL or climate variables for these purposes, self-report
surveys possess principled and pragmatic advantages over other measurement strategies. They
are uniquely efficient and cost-effective, allowing educators to quickly and affordably census their
entire student body on an array of topics. Unlike other methods (e.g., classroom observation,
performance tasks) that tend to treat students primarily as data sources, climate and SEL surveys
typically treat students as active agents of school improvement and of their own learning; in this
sense, they can serve as both measurement instruments and the basis for educational
interventions. Finally, for educators primarily interested in students’ internal mental states (e.g.,
perceptions of safety, feelings of belonging, judgments of self-efficacy), self-report is a natural fit
over other methods, such as teacher-report, that require others to infer students’ thoughts or
feelings. These and other benefits (e.g., ease of reporting, standardization, understandability of
results) explain the prevalence of self-report surveys in climate and SEL measurement.
In considering the quality of these or any other measurement instrument, bedrock principles of
psychometrics are worth keeping front of mind. First, despite established criteria of what
constitutes “good” for many statistics, reliability and validity exist in shades of gray. When we
claim here or elsewhere that our survey instruments are “valid and reliable,” we mean that they
meet established standards of educational measurement, not that reliability or validity are
black-and-white determinations. Second, reliability and validity depend on use; they are not fixed
properties of a measurement instrument (Messick, 1995a). If schools are funded, if teachers are
compensated, or if students' grades are based on self-report data, then these contingencies will
likely contaminate the measurement process. For this reason, the results we present here are for
the informative applications that motivate our client partnerships.
Methods
As described below, we developed a broad range of student measures by following best
practices in the science of survey development. Following up initial validation efforts, we used a
4large, de-identified dataset from Panorama’s partners (with their permission) to comprehensively
examine these topics’ psychometric properties.
Topic Development
Education researchers and practitioners at the Harvard University Graduate School of Education
developed Panorama’s student surveys, which came out of the six-step design process by
Gehlbach and Brinkworth (2011; see also Artino et al., 2014).1 An outline of the process is below.
For a more detailed description of the design process, see Panorama Education (2015a). To the
best of our knowledge, this process is unsurpassed in terms of its rigor and capacity to minimize
survey error. The strengths of this process come from two approaches.
First, this process builds evidence of validity—specifically, content validity and substantive validity
(Messick, 1995b)—into each survey topic from the outset of the design process. The six key steps
in the process include literature review, interviews and focus groups, synthesis of indicators, item
(question) creation, expert review, and cognitive pre-testing and interviewing. Upon completion of
these six steps and a round of revisions to the items, the topics were subjected to large-scale
pilot tests.
Second, this process ensures that each survey item is designed to adhere to the science of
survey design’s best practices (Gehlbach & Artino, 2018; Dillman, Smyth, & Christian, 2014;
Fowler, 2013). For example, researchers have concluded that designing survey items as
statements, particularly ones that require respondents to agree or disagree, is likely to inject
additional measurement error and bias into responses.
Numerous surveys used by educators unfortunately fail to adhere to these well-established
survey design practices. For example, asking questions with response options that are linked to
the underlying concept is the preferred practice (Dillman et al., 2014; Krosnick, 1999a; Saris,
Revilla, Krosnick, & Shaeffer, 2010)—e.g., rather than posing statements that respondents are
supposed to agree or disagree with. Failing to label all response options, using numeric rather
than verbal labels, and using too few response options are other commonly violated best
practices (Artino et al., 2014; Dillman et al., 2014; Krosnick, 1999b; Weng, 2004). As a survey topic
violates more of these best practices, the amount of measurement error and bias grows. The
topics that comprise Panorama’s survey instruments adhere to these best practices, which was
confirmed during the expert review step.
Table 1 summarizes Panorama’s student survey topics, including each construct’s definition and
recommended key scholarly references. It also gives the survey source for each topic. All of the
survey content is available on our website.
1
To bring non-Panorama measures of social awareness and self-management to schools and districts upon
request while also keeping consistency and Panorama’s high standards for research-backed surveys, our
team adapted these topics to better align with best practices in survey design. For example,
agree/disagree statements were rephrased as questions.
5Table 1. Panorama Student Survey Topics
Construct/Topic Definition Key Reference(s)
Classroom Effortc How much effort students put into school and learning Covington (2000); Ryan & Deci (2000)
Climateabc Perceptions of the overall social and learning climate of the school Thapa, Cohen, Guffey, &
Higgins-D’Alessandro (2013)
Emotion Regulationc How well students regulate their emotions Duckworth, Gendler, & Gross (2014)
Engagementabc How attentive and invested students are in school Fredricks, Blumenfeld, & Paris (2004)
Gritbc How well students are able to persevere through setbacks to achieve important long-term Duckworth & Gross (2014)
goals
Growth Mindsetabc Student perceptions of whether they have the potential to change those factors that are Dweck (2008); Yeager et al. (2019)
central to their performance in school
Learning Strategiesabc How well students deliberately use strategies to manage their own learning processes Fiorella & Mayer (2016); Pintrich & De
generally Groot (1990)
Pedagogical Perceptions of the quality of teaching and amount of learning students experience from a Cantrell & Kane (2013); Good (2014)
Effectivenessab particular teacher
Rigorous How much students feel that their teachers hold them to high expectations around effort, Ames (1992); Jussim & Harber (2005)
Expectationsabc understanding, persistence and performance in class
School Safetybc Student perceptions of physical and psychological safety while at school Cornel & Mayer (2010)
Self-Efficacyc How much students believe they can succeed in achieving academic outcomes Usher & Pajares (2008)
Self-Managementc How well students manage their emotions, thoughts, and behaviors in different situations Transforming Education (2016)
Sense of Belongingabc How much students feel that they are valued members of the school community Cohen & Garcia (2008); Osterman (2000)
Social Awarenessc How well students consider the perspectives of others and empathize with them Transforming Education (2016)
Teacher-Student How strong the social connection is between teachers and students within and beyond the Pianta, Hamre, & Allen (2012); Roorda,
Relationshipsabc school Koomen, Spilt, & Oort (2011)
a
Classroom and school versions available; b Part of the Panorama Student Survey; c Part of Panorama for SEL
6Some survey topics have parallel classroom and school forms (e.g., Classroom Climate and
School Climate, respectively) to help educators target feedback to classroom and schools,
respectively. Additionally, certain topics have parallel forms based on students’ grade level (3-5th
grade vs 6-12th grade) to accommodate differences in reading comprehension or educational
context (i.e., elementary vs secondary schooling). Since the differences between parallel forms,
when they exist, are relatively minor (e.g.,”How sure are you…” vs “How confident are you…”) we
do not present separate analyses in this report for each form.
For those interested in more details about our development of student topics, we recommend
our previous validity reports on the Panorama Student Survey (Panorama Education, 2015a;
Panorama Education, 2015b). For those interested in our student equity topics, their development
and validity are documented in a separate report (Panorama Education, 2019). Some topics from
the student surveys have also been featured in major reports—including reports published by the
NewSchools Venture Fund (Messano, Childress, Atwood, & Kubagawa, 2019), by Policy Analysis
for California Education (Gehlbach & Hough, 2018), and by the CORE Districts and other
organizations (West, Buckley, Krachman, & Bookman, 2018).
Data Source
For the analyses we report here, we relied on survey data collected during the 2016-17 school
year from approximately 3,500,000 students in over 5,900 schools. We present further
information on this sample in the Results section below.
Scoring
All survey items have five fully-labeled verbal response options, except for a few bipolar
questions with seven response options. To calculate topic scores, we converted each of the five
response options to a 1-5 integer value (with 5 always reflecting a more positive response) and
averaged across item scores within the topics. For items with 7 response options, we
arithmetically transformed those responses to a 1-5 scale before taking the average. Unless
otherwise noted, we excluded any student who skipped more than half of the items in a topic.
7Results
Sample Demographics
Table 2 presents the demographics for the student sample analyzed in this report.2 The sample
shows considerable demographic diversity that either meets or exceeds that found nationally
(McFarland et al., 2019). As expected, it contains an even distribution of students with respect to
gender and grade level. Reflecting the diversity of the schools and districts partnering with
Panorama, the sample contains relatively more under-represented minorities, English Language
Learners (ELLs) and students eligible for free or reduced-priced lunch (FRPL) relative to the
national student population.
Table 2. Student Demographics
Demographic Group %
Female 49.6
Male 50.4
Asian 5.8
Black 13.3
Latinx 53.0
Multiracial 1.9
Native American 0.5
Pacific Islander 1.6
White 23.9
3rd Grade 9.5
4th Grade 11.0
5th Grade 11.6
6th Grade 10.9
7th Grade 11.5
8th Grade 10.7
9th Grade 10.4
2
Since some students were missing demographic data—due to survey non-response, schools or districts
electing to not include demographic data with their surveys, or certain demographics not being recorded in
school and district data systems—percentages reported reflect just those students with non-missing data
for the given area. The percentage of students with missing demographics ranged from a low of 5.2% for
grade level to a high of 37.4% for free/reduced-price lunch eligibility. Note that the percentages may not
total to 100.0 due to rounding error.
810th Grade 9.1
11th Grade 8.3
12th Grade 7.1
English language learner 21.3
Eligible for free/reduced-price lunch 76.6
Survey Satisficing
Satisficing (a portmanteau of satisfy and suffice) is a decision-making strategy in which individuals
expend just enough mental effort to reach an acceptable (as opposed to optimal) solution (Simon,
1957). In taking surveys, respondents can exhibit satisficing in various forms—e.g., by skipping
items, selecting a “don’t know” response option, or giving identical responses across multiple
items (called straightlining)—all of which represent potential threats to a topic’s reliability or
validity (see Barge & Gehlbach, 2012; Krosnick, 1991).
Past large-sample research on student SEL surveys administered by Panorama (n = 409,721) has
shown that satisficing is a relatively minor concern (Vriesema & Gehlbach, 2019). To confirm that
conclusion, we investigated the extent of satisficing in our entire 2016-17 survey dataset by
examining the combined effects of early termination (i.e., submitting an unfinished survey) and
item skipping (i.e., neglecting to answer individual survey questions). Both forms of satisficing
manifest as missing data and could potentially bias results if respondents with missing data differ
from those with complete data on the constructs of interest (e.g., Holt & Elliot, 1991).
The vast majority of respondents answered all survey questions within each topic: On average,
95.7% of respondents answered all questions from a topic. Even the topic with the lowest
full-completion rate (also the topic with the most items), Self-Management, still had 93.3% of
respondents completing every question, leaving only 6.7% of respondents skipping one or more
questions. An item-level analysis revealed similarly low levels of satisficing: The mean missing
data rate across all items was only 1.2%, and the max rate of missing data across all items was
1.8%. Figure 1 presents the distribution of the percentage of missing data across all survey items.
Taken together, these results affirm that early survey termination or item skipping do not threaten
the quality of the data schools collect through Panorama.3
3
For satisficing analyses, we included all available data; unlike other analyses, we did not exclude data
from participants who did not answer at least half the questions from a topic.
9Table 3. Full Completion Rates by Topic
% Students with
Topic Complete Data
Climate 96.6
Self-Efficacy 95.9
Classroom Effort 97.5
Engagement 95.4
Emotion Regulation 96.6
Growth Mindset 95.3
Grit 95.7
Learning Strategies 95.4
Pedagogical Effectiveness 93.6
Rigorous Expectations 95.8
Social Awareness 94.7
Sense of Belonging 96.7
Self-Management 93.3
School Safety 95.8
Teacher-Student Relationships 96.8
Figure 1. Distribution of Missing Data across All Survey Items
10Reliability
Reliability, as assessed through Cronbach’s alpha, is essentially a measure of signal-to-noise
(DeVellis, 2016) with higher values reflecting more “signal” and less “noise.” Put differently,
Cronbach’s alpha measures how similarly students respond to items from the same topic, i.e., a
topic’s internal consistency (Streiner, 2003). As shown in Table 4, all of Panorama’s survey topics
met or exceeded the typical sufficiency threshold of .70.
Structural Validity
We conducted confirmatory factor analyses to assess the structural validity of each survey topic
(see Messick, 1995b). More specifically, we examined whether each topic had the statistical
structure we expected, i.e., whether it measures only a single dimension (and not multiple
dimensions). Table 4 presents the two key statistics from each analysis: the comparative fit index
(CFI) and the root mean square error of approximation (RMSEA).
With a maximum possible value of 1, CFI measures how well the data from each topic fit a
one-dimensional solution. Historically, a CFI of .90 or greater has been considered sufficient,
though a value closer to .95 or above is preferred. As shown in Table 4, all but one topic meet
the preferred threshold, with many effectively at the upper bound of 1. RMSEA is a
complementary measure of model fit, with lower values indicating better fit. All but one topic
were at or under the typical threshold of 0.08. The same topic, Self-Management, missed the
conventional thresholds for both statistics, but only marginally; notably, it is also the topic with the
largest number of questions. (For a discussion of the CFI and RMSEA, including thresholds to
determine model fit, see Hu & Bentler, 1999; Laverdière, Morin, & St-Hilaire, 2013.)
Table 4. Reliability and Structural Validity Results by Topic
Topic ɑ CFI RMSEA
Climate 0.84 1.00 0.04
Self-Efficacy 0.78 1.00 0.03
Classroom Effort 0.75 1.00 0.03
Engagement 0.87 1.00 0.05
Emotion Regulation 0.84 0.99 0.05
Growth Mindset 0.79 0.96 0.08
Grit 0.74 0.99 0.05
Learning Strategies 0.83 0.99 0.05
Pedagogical Effectiveness 0.94 0.99 0.06
Rigorous Expectations 0.86 0.99 0.06
Social Awareness 0.80 0.96 0.06
11Sense of Belonging 0.85 0.99 0.06
Self-Management 0.83 0.89 0.09
School Safety 0.73 0.95 0.07
Teacher-Student Relationships 0.90 0.99 0.07
Note: ɑ = Cronbach’s alpha, CFI = comparative fit index, RMSEA = root mean square
error of approximation; all results based on 2016-17 sample and rounded to two
decimal places.
Convergent and Discriminant Validity
Convergent and discriminant validity assess how much a measurement instrument, in this case a
survey topic, measures what it is designed to measure. An instrument demonstrates convergent
validity when it correlates as expected with measures of theoretically similar constructs (or
alternative measures of the same construct). Conversely, an instrument demonstrates
discriminant validity when it correlates minimally with measures of theoretically-dissimilar
constructs. If students’ responses on our Sense of Belonging topic correlated positively with their
responses on our Teacher-Student Relationships topic, for example, that would be evidence of
convergent validity; and if students’ Sense of Belonging responses showed a relatively small
correlation with their Classroom Effort responses or standardized test scores, that would be
evidence of discriminant validity (for more, see Messick, 1995a).
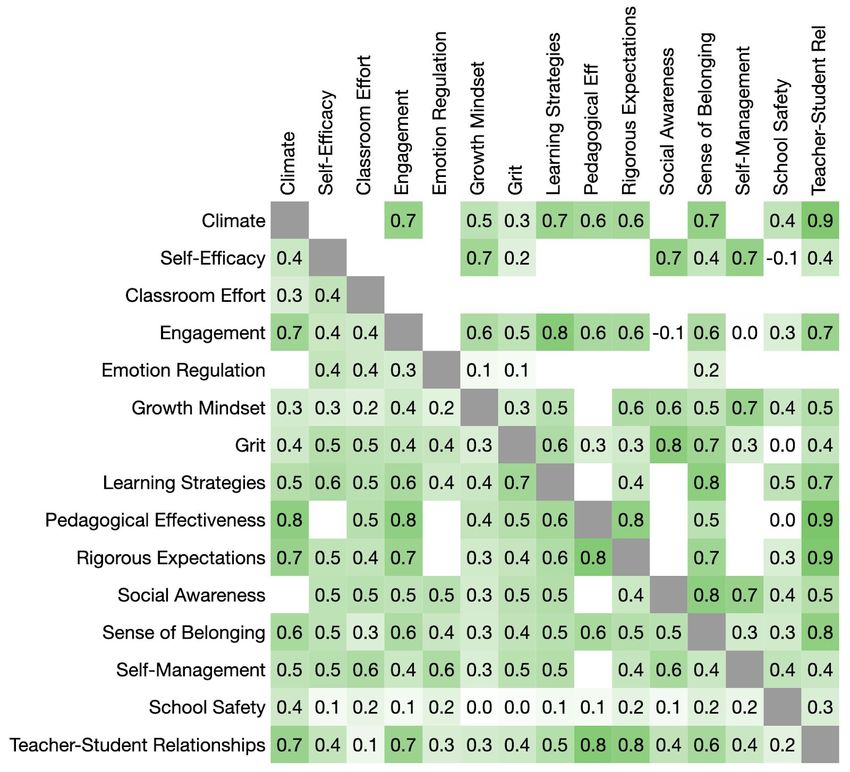
To address convergent and discriminant validity, we computed intercorrelations among all
student topics at the student and school level and compared those with what one would expect
based on extant scholarship. As shown in Figure 2, the survey topics correlate with each other
largely as expected. With only one exception (a trivially negative school-level correlation between
Social Awareness and Engagement), the correlations are all positive, with stronger correlations
for more related constructs (e.g., Sense of Belonging and Teacher-Student Relationships) and
weaker correlations for less related constructs (e.g., School Safety and Growth Mindset).
As one of many possible examples of convergent validity, we see particularly strong correlations
(at both the student and school level) between our Teacher-Student Relationships, Rigorous
Expectations, Sense of Belonging, and Climate topics. Based on prior work showing the centrality
of student’s relationships with their teachers to their social experience of school more
generally—as well as the impact of teachers’ setting high expectations for their students—we
would expect these topics to be highly related (see Anderman, 2003; Brinkworth, McIntyre,
Juraschek, & Gehlbach, 2018; Lee, 2012)
As an example of discriminant validity, we see relatively no meaningful correlations between
students’ perception of the safety of their environment as measured by our School Safety topic
and their social-emotional competencies (e.g., Social Awareness, Growth Mindset), perceptions of
their teachers (e.g., Pedagogical Effectiveness, Rigorous Expectations), or even feeling that they
belong at school (e.g., Sense of Belonging). Based on prior psychometric evidence and research
12(e.g., Skiba et al., 2004; Thapa et al., 2013) , one would expect students' safety experience to
diverge from these other variables.
Figure 2. Topic Intercorrelations
Note: We calculated Spearman rank-order correlations to minimize measurement assumptions (see Chen &
Popovich, 2002). Values above the diagonal are school-level correlations (between school-level mean
topic scores), and numbers below the diagonal are student-level correlations. Blank cells indicate topic
pairs with insufficiently sized samples (fewer than 20 schools or 500 students).
13Conclusion
Panorama developed its student surveys through a rigorous process that builds in validity at the
outset. This report provides psychometric evidence for the reliability and validity of our student
topics. Since nearly all students complete all items from the topics administered to them, missing
responses do not undermine the quality of the data. Additionally, the topics demonstrate strong
internal consistency and structural validity. Finally, intercorrelations among the topics denote
discriminant and convergent validity. Panorama's surveys therefore offer schools and districts a
research-backed means for measuring the social-emotional learning and school climate variables
that undergird child development and academic growth.
14References
Ames, C. (1992). Classrooms: Goals, structures, and student motivation. Journal of Educational
Psychology, 84(3), 261.
Anderman, L. H. (2003). Academic and social perceptions as predictors of change in middle
school students' sense of school belonging. The Journal of Experimental Education, 72(1),
5-22.
Artino Jr., A. R., La Rochelle, J. S., Dezee, K. J., & Gehlbach, H. (2014). Developing questionnaires
for educational research: AMEE Guide No. 87. Medical Teacher, 36(6), 463-474.
Barge, S. & Gehlbach, H. (2012). Using the theory of satisficing to evaluate the quality of survey
data. Research in Higher Education, 53(2), 182-200. doi:10.1007/s11162-011-9251-2.
Brinkworth, M. E., McIntyre, J., Juraschek, A. D., & Gehlbach, H. (2018). Teacher-student
relationships: The positives and negatives of assessing both perspectives. Journal of
Applied Developmental Psychology, 55, 24-38.
Cantrell, S., & Kane, T. J. (2013). Ensuring fair and reliable measures of effective teaching:
Culminating findings from the MET project’s three-year study. MET Project Research
Paper.
Chen, P. Y., & Popovich, P. M. (2002). Quantitative Applications in the Social Sciences:
Correlation. Thousand Oaks, CA: SAGE Publications, Inc. doi: 10.4135/9781412983808
Cohen, G. L., & Garcia, J. (2008). Identity, belonging, and achievement: A model, interventions,
implications. Current Directions in Psychological Science, 17(6), 3 65-369.
Cornell, D. G., & Mayer, M. J. (2010). Why do school order and safety matter? Educational
Researcher, 39(1), 7-15.
Covington, M. V. (2000). Goal theory, motivation, and school achievement: An integrative review.
Annual Review of Psychology, 51(1), 1 71-200.
DeVellis, R. F. (2016). Scale development: Theory and applications (Vol. 26). Sage Publications.
Dillman, D. A., Smyth, J. D., & Christian, L. M. (2014). Internet, phone, mail, and mixed-mode
surveys: The tailored design method. John Wiley & Sons.
Duckworth, A. L., Gendler, T. S., & Gross, J. J. (2014). Self-control in school-age children.
Educational Psychologist, 49(3), 199-217.
Duckworth, A., & Gross, J. J. (2014). Self-control and grit: Related but separable determinants of
success. Current Directions in Psychological Science, 23(5), 319-325.
Dweck, C. S. (2008). Mindset: The new psychology of success. Random House Digital, Inc.
Fiorella, L., & Mayer, R. E. (2016). Eight ways to promote generative learning. Educational
Psychology Review, 28(4), 717-741.
Fowler Jr., F. J. (2013). Survey research methods. Sage publications.
Fredricks, J. A., Blumenfeld, P. C., & Paris, A. H. (2004). School engagement: Potential of the
concept, state of the evidence. Review of Educational Research, 74(1), 59-109.
Gehlbach, H., & Artino, A. R. (2018). The survey checklist (manifesto). Academic Medicine: Journal
of The Association of American Medical Colleges, 93(3), 360-366.
doi:10.1097/ACM.0000000000002083
15Gehlbach, H., & Brinkworth, M. E. (2011). Measure twice, cut down error: A process for enhancing
the validity of survey scales. Review of General Psychology, 15(4), 380.
Gehlbach, H., & Hough, H. J. (2018). Measuring Social Emotional Learning through Student
Surveys in the CORE Districts: A Pragmatic Approach to Validity and Reliability. Policy
Analysis for California Education, PACE.
Good, T. L. (2014). What do we know about how teachers influence student performance on
standardized tests: And why do we know so little about other student outcomes. Teachers
College Record, 116(1), 1-41.
Holt, D., & Elliot, D. (1991). Methods of weighting for unit non-response. Journal of the Royal
Statistical Society: Series D (The Statistician), 40( 3), 333-342.
Hu, L. T., & Bentler, P. M. (1999). Cutoff criteria for fit indexes in covariance structure analysis:
Conventional criteria versus new alternatives. Structural Equation Modeling: A
Multidisciplinary Journal, 6(1), 1-55.
Jussim, L., & Harber, K. D. (2005). Teacher expectations and self-fulfilling prophecies: Knowns
and unknowns, resolved and unresolved controversies. Personality and Social
Psychology Review, 9(2), 131-155.
Krosnick, J. A. (1991). Response strategies for coping with the cognitive demands of attitude
measures in surveys. Applied Cognitive Psychology, 5(3), 213–236.
Krosnick, J. A. (1999a). Maximizing questionnaire quality. In J. P. Robinson, P. R. Shaver & L. S.
Wrightsman (Eds.), Measures of Political Attitudes ( pp. 37-57). San Diego: Academic Press.
Krosnick, J. A. (1999b). Survey research. Annual Review of Psychology, 50( 1), 537-567.
Laverdière, O., Morin, A. J., & St-Hilaire, F. (2013). Factor structure and measurement invariance of
a short measure of the Big Five personality traits. Personality and Individual Differences,
55(7), 739-743.
Lee, J. S. (2012). The effects of the teacher–student relationship and academic press on student
engagement and academic performance. International Journal of Educational Research, 53,
330-340.
Messano, F., Childress, S., Atwood, J., & Kubagawa, M. (2019). Insight brief: Using expanded
measures of student success for school improvement. Retrieved from
http://www.newschools.org/wp-content/uploads/2019/10/EDSS_2019.pdf.
Messick, S. (1995a). Standards of validity and the validity of standards in performance
assessment. Educational measurement: Issues and practice, 14(4), 5-8.
Messick, S. (1995b). Validity of psychological assessment: Validation of inferences from persons'
responses and performances as scientific inquiry into score meaning. American Psychologist,
50(9), 741-749.
McFarland, J., Hussar, B., Zhang, J., Wang, X., Wang, K., Hein, S., Diliberti, M., Forrest Cataldi, E.,
Bullock Mann, F., and Barmer, A. (2019). The Condition of Education 2019 (NCES 2019-144).
U.S. Department of Education. Washington, DC: National Center for Education Statistics.
Retrieved from https://nces.ed.gov/pubsearch/pubsinfo.asp?pubid=2019144.
Osterman, K. F. (2000). Students' need for belonging in the school community. Review of
Educational Research, 70(3), 3 23-367.
16Panorama Education (2015a). Panorama Student Survey: Development and psychometric
properties. Retrieved from
https://go.panoramaed.com/hubfs/Files/PSS%20full%20validity%20report.pdf.
Panorama Education (2015b). Validity Brief: Panorama Student Survey. Retrieved from
https://panorama-www.s3.amazonaws.com/files/panorama-student-survey/validity-brief.pdf.
Panorama Education (2016). Reliability and Validity of Panorama’s Social-Emotional Learning
Measures. Retrieved from
https://panorama-www.s3.amazonaws.com/files/sel/SEL-Validity-Report.pdf.
Panorama Education (2019). Reliability and Validity of the Panorama Equity and Inclusion Survey.
Retrieved from https://go.panoramaed.com/hubfs/Validity-Report-Equity-Inclusion-Survey.pdf.
Pianta, R. C., Hamre, B. K., & Allen, J. P. (2012). Teacher-student relationships and engagement:
Conceptualizing, measuring, and improving the capacity of classroom interactions. In
Handbook of Research on Student Engagement (pp. 365-386). Springer, Boston, MA.
Pintrich, P. R., & De Groot, E. V. (1990). Motivational and self-regulated learning components of
classroom academic performance. Journal of Educational Psychology, 82(1), 33-40.
Richeson, J. A., & Sommers, S. R. (2016). Toward a social psychology of race and race relations
for the twenty-first century. Annual Review of Psychology, 67, 439-463.
Roorda, D. L., Koomen, H. M., Spilt, J. L., & Oort, F. J. (2011). The influence of affective
teacher–student relationships on students’ school engagement and achievement: A
meta-analytic approach. Review of Educational Research, 81(4), 493-529.
Ryan, R. M., & Deci, E. L. (2000). Self-determination theory and the facilitation of intrinsic
motivation, social development, and well-being. American Psychologist, 55(1), 68.
Saris, W. E., Revilla, M., Krosnick, J. A., & Shaeffer, E. M. (2010). Comparing questions with
agree/disagree response options to questions with item-specific response options. Survey
Research Methods, 4( 1), 61-79.
Skiba, R., Simmons, A. B., Peterson, R., McKelvey, J., Forde, S., & Gallini, S. (2004). Beyond guns,
drugs and gangs: The structure of student perceptions of school safety. Journal of School
Violence, 3(2-3), 149-171.
Simon, H. A. (1957). Models of Man: Social and Rational. New York: Wiley
Streiner, D. L. (2003). Starting at the beginning: An introduction to coefficient alpha and internal
consistency. Journal of Personality Assessment, 80(1), 99-103.
Sue, D. W. (2013). Race talk: The psychology of racial dialogues. American Psychologist, 68(8),
663.
Thapa, A., Cohen, J., Guffey, S., & Higgins-D’Alessandro, A. (2013). A review of school climate
research. Review of Educational Research, 83(3), 357-385.
Transforming Education (2016). Measuring MESH: Student and Teacher Surveys Curated for the
CORE Districts.
Usher, E. L., & Pajares, F. (2008). Sources of self-efficacy in school: Critical review of the literature
and future directions. Review of Educational Research, 78(4), 751-796.
Vriesema, C. C., & Gehlbach, H. (2019). Assessing Survey Satisficing: The Impact of Unmotivated
Questionnaire Respondents on Data Quality. Working Paper. Policy Analysis for California
17Education, PACE. Retrieved from
https://edpolicyinca.org/publications/assessing-survey-satisficing
Weng, L. J. (2004). Impact of the number of response categories and anchor labels on coefficient
alpha and test-retest reliability. Educational and Psychological Measurement, 64(6), 956-972.
doi: 10.1177/0013164404268674
West, M. R., Buckley, K., Krachman, S. B., & Bookman, N. (2018). Development and
implementation of student social-emotional surveys in the CORE districts. Journal of Applied
Developmental Psychology, 55, 119-129.
Yeager, D. S., Hanselman, P., Walton, G. M., Murray, J. S., Crosnoe, R., Muller, C., Tipton, E.,
Schneider, B., Hulleman, C. S., Hinojosa, C. P., Paunesku, D., Romero, C., Flint, K., Roberts, A.,
Trott, J., Iachan, R., Buontempo, J., Man Yang, S., Carvalho, C. M., Hahn, P. R., ... Dweck, C. S.
(2019). A national experiment reveals where a growth mindset improves achievement. Nature,
573(7774), 364-369.
© Panorama Education 2020
Revised July 21, 2020
18You can also read