Evolution of galaxies, halos, and structure over 12 Gyrs
←
→
Page content transcription
If your browser does not render page correctly, please read the page content below
Evolution of galaxies, halos, and structure over 12 Gyrs Tag: MSE-highz-SRO1/ MSE-lowz-SRO1 Lead: Aaron Robotham, Michael Balogh, Luke Davies, Simon Driver, Carlo Schmid, Yue Shen 1. Abstract Here we propose an ambitious design of nine photo-z selected survey cubes that will allow MSE to measure the build up of large scale structure, stellar mass, halo occupation and star formation out to z = 5.5. By targeting (300 Mpc/h)3 boxes, each volume will measure “Universal” values for an array of potential experiments. At low redshift we will directly observe halo abundances below 1012 M¤, which means we can measure the occupation of halos and their abundance over a four decade range in halo mass, accounting for the majority of stellar mass in the low-redshift Universe. At higher redshifts our survey volumes will trace the transition from merger-dominated spheroid formation to the growth of disks, covering the peak in star-formation and merger activity. This combination of depth, area and photo-z selection is not possible without a combination of LSST and MSE. As such, MSE will be able to produce the definitive survey of structure, halos and galaxy evolution over 12 billion years. With the nominal design of MSE these proposed surveys will take ~7 years to observe. 2. Science Justification Current surveys that span the low (z < 0.3, e.g. GAMA/SDSS), moderate (z ~ 1, e.g. zCOSMOS, Lilly et al 2007) and high redshift (z > 3, e.g. VVDS, Le Fevre 2013) Universe come from hugely different telescopes. At low redshift the extra-galactic field is dominated by the Sloan Telescope and the Anglo-Australian Telescope (2.5/4m, FoV ~ 3/2 deg) and at higher redshifts a mixture of large facilities dominate (8+m, FoV
range of 1012M¤ - 1015M¤ halos (see Figure 16 in Robotham et al 2011). Also, without a
photo-z selection it becomes extremely inefficient to sample faint galaxies at low redshift,
with fainter apparent magnitudes naturally pushing the peak in the n(z) distribution to higher
redshifts.
With this aim in mind, and with the knowledge that such a study opens up a large suite of
complementary science such as ultra-large dynamic range close-pair and halo occupation
distribution (HOD) studies (see Robotham et al 2014), we have designed an ambitious survey
that only MSE is reasonably able to conduct on a sensible timescale (~7 years). The basic
goal is to observe 3,200 sq deg of the Northern extra-galactic sky (overlapping fully with the
proposed LSST survey region and substantially with the current SDSS footprint) between
redshift 0 and 0.21 and down to a limiting magnitude of iAB=25.3 selected from LSST
standard depth multi-year survey. To efficiently probe down to low mass halos it is
advantageous to observe as large an area as possible, and 3,200 sq deg over the suggested
redshift extent minimally contains a 300x300x300 Mpc/h co-moving cube. This means our
volume is large enough that we reach Universal homogeneity in all three dimensions
(Srimgeour et al 2013, Driver & Robotham 2010). By observing to i = 25.3 within z = 0.21
we expect to be deep enough that essentially all 1012M¤ mass halos are both detected and
have a reasonable mass estimate, with 10 or more galaxies identified (see RHS of Figure 1). 108
1
Comoving mass density (arbitrary units)
Dark Matter Intinrisc HMF
Stellar Mass 1+ galaxies per halo
107
2+ galaxies per halo
0.8
Number of Halos d0.5dex
5+ galaxies per halo
106
10+ galaxies per halo
0.6
105
104
0.4
103
0.2
102
Gal N = 16M
MSE survey: 3,438 sq deg / 0version of this experiment). Beyond this range we are limited by the high quality photo-z i <
25.3 sample provided by LSST. Despite this, we can still probe the dominant component of
stellar mass (M*) and its halo occupation distribution out to z = 2 with S5 and S6. This takes
our galaxy evolution analysis out to 10 Gyrs in consistent co-moving volumes that have high
statistical quality.
New survey possibilities are opened up if MSE has a spectral range covering 380-1800 nm or
even better 380-2400 nm (rather than the nominal 380-1300 nm). Importantly OII becomes
visible out to z = 5.4 (at 2400 nm), i.e. it becomes a common emission feature that S1 to S9
can all observe, offering a consistent star-formation tracer over 12 Gyrs from a single facility.
If we have access to Ly-α and OII then direct measurements of the feedback of gas into the
inter-stellar medium is possible. With the shorter spectrograph range this experiment could
only be conducted in S7. With the extended range this direct fuelling can be measured for S7,
S8 and S9. We will also be able to observe Ha, and construct a full BPT diagram out to z =
2/2.5 (i.e. S1 to S6/S7) with an extended spectrograph range (1800/2400 nm).
60
S1 S5 S9
Co−Dist (Mpc/h)
40
20
0
0 50 100 150
Co−Dist (Mpc/h)
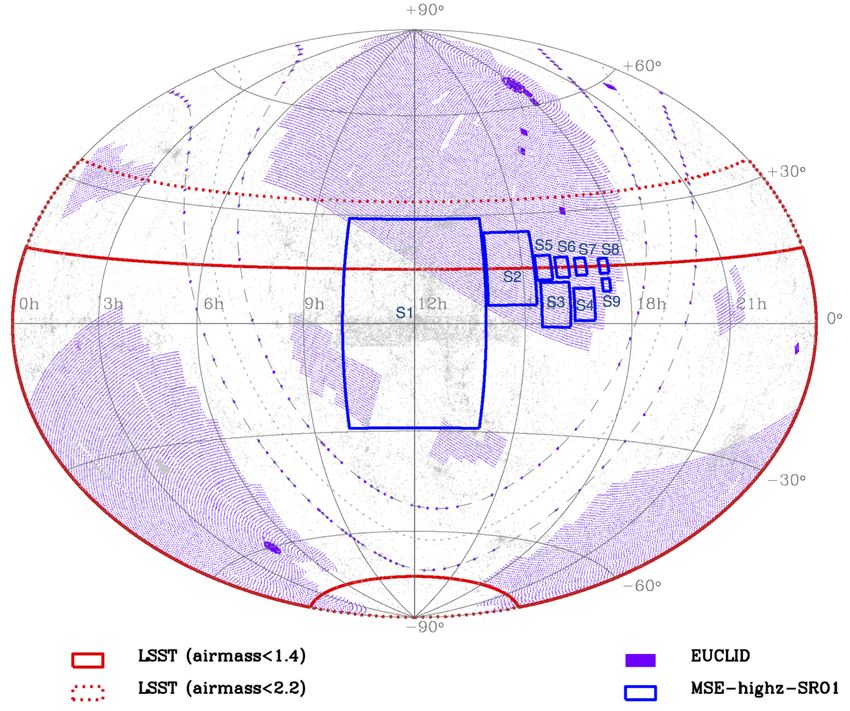
Figure 2: The proposed range of equi-comoving MSE survey cubes (S1 to S9). The top panel shows the cosmic
SFH from Hopkins & Beacom 2006. The middle panel shows the proposed surveys. The bottom panel shows
enlarged versions of the growth in large-scale structure in TAO simulated (50 mpc/h)3 survey cubes for S1, S5
and S9 redshifts. The irregular spacing for S8 and S9 is required to avoid the strong sky absorption features, see
Figure 3 for details.
It is clear that such a survey suite opens up a vast amount of science that is not accessible to
any other facility. A non-exhaustive summary is given below, where we will:• Measure halo occupation (through group finding) below 1012M¤. This combined with
an HOD analysis will definitively uncover the interplay between stellar mass and
halos, and will put any detailed study of individual halos (e.g. future MilkWay and
M31 “archeology” studies) into a proper cosmological context.
• Directly observe the evolution of the massive end of the halo mass function out to
redshift 1 (half the age of the Universe). This is step beyond cluster count cosmology,
and will be conducted with a homogenous selection with LSST (the selection function
is one of the major limitations of current cluster cosmology work).
• Study the evolution of the large-scale structure and cosmic web out to z = 5 with a
consistent galaxy tracer with homogenous bias.
• Study the merger rate and star-formation history for all galaxies down to M*/10
(covering the converged majority of stellar mass) out to z = 1.
• Study the close clustering and merger rate of massive galaxies (1011M¤) out to z = 5.
• With photometry from LSST we will be able the majority of the stellar component of
the cosmic spectral energy distribution (CSED) out to z = 2.
• Together with other next generation telescopes (most significantly LSST, Euclid,
WFIRST, SKA, 30+m telescopes) we these surveys will have a vital role in:
o Measuring morphological evolution to z = 1
o Studying the interplay between gas, dust, stars and environment
o Providing IFU targets for 30+m telescopes for well understood samples at
multiple epochs
o Offering the sample superset for high S/N observations of individual galaxies
in order to ascertain the evolution of metals through cosmic time.
• Especially at higher redshifts, exciting work looking at the clustering of AGN is
viable. This would naturally be a subset of the proposed surveys, but extended AGN
focused science cases could be constructed and incorporated into the nominal design.
The main competition to MSE in doing such a combined survey is Subaru-PFS (Takada et al
2013) and VLT-MOONS (Cirasulo et al 2012). PFS will have a spectral range 380-1300 nm
but in many other respects will have similar capability to MSE. It will nominally be
conducting z < 1, i < 21.5 and 1 < z < 2, i < 23.9 photo-z pre-selection surveys (based on
shallower HSC data). In both regimes the surveys discussed here are at least a magnitude
deeper (a factor ~3 in stellar mass) and over much larger areas (fixed 16 sq deg for PFS, 400
to 30 sq deg over the same range for MSE. The huge advantage of MSE compared to all of
the proposed PFS surveys is that we will be extending to the scale of homogeneity in all three
dimensions. For many of the science cases laid out here (and foreshadowed on a smaller scale
by PFS) the definitive measurement will be made by MSE, with no further appreciable
improvements to be made by moving to larger survey volumes (since many extra-galactic
measurements are dominated by sample variance not Poisson statistics of the sample itself).
Regarding potential competition, VLT/MOONS will have a spectral range 680-1800 nm and
is focusing on surveys at z > 1. Where MSE has a potentially huge advantage is the LSST
and Euclid/WFIRST photometric source catalogues. These telescopes will only become
available post 2020, and offer a paradigm shift in optical quality. In particular, using LSST
allows us to conduct surveys S1 (3,200 sq deg) to S7 (22 sq deg) with identical photometry
and photo-z technique. Such homogeneity will improve the robustness of almost every type
of analysis made. Given the fast survey speed of MSE, once LSST and Euclid data become
available no other facility will be able to keep up with the observing speed of MSE, i.e. it will
dominate the next generation of spectroscopic surveys from 0 < z < 6.
Robotham, 2011, MNRAS, 424 Le Fevre, 2013, A&A, 559 Lilly, 2007, ApJS, 172
Robotham, 2014, MNRAS, 444 Driver, 2010, MNRAS, 407 Cirasulo, 2012, arXiv, 1208.5780
Srimgeour, 2012, MNRAS, 425 Hopkins, 2006 ApJ, 651 Takada, 2013, arXiv, 1206.07373. Key astrophysical observables
For all clustering related experiments the core observation will be a redshift. This can be
obtained through cross-correlation template fitting using auto-z (Baldry et al 2014) or similar.
Value added products would be to get better signal-to-noise for star-formation features (Hα
and OII) and for absorption features (Mg and Na). Broadly speaking our required spectral
range is 372.7(1+zlo) to 372.7(1+zhi) [for tracing OII, our main driver]. Similarly we have
517.5(1+zhi) [for tracing Mg-b] 589.4(1+zhi) [for tracing Na] (656.4*(1+zhi) [for tracing Hα].
The nominal range of 380-1300nm for MSE is adequate for a large amount of HOD related
science (see Figure 3), allowing Hα measurements out to z=1 (S4) and Mg-b absorption out
to z=1.5 (S5). For robust redshifts for non-emission galaxies the presence of C-K and g-band
(i.e. the 400 nm break feature) is probably a sensible minimum requirement, meaning we can
do reasonably unbiased HOD target selection and analysis all the way to an upper limit of z =
2 with the nominal design. This is within the regime of interest, and allows for a possible
analysis of the interplay between merging and star-formation at z = 2 (S6). If the
spectrograph is extended out to 1800 nm (i.e. H-band limit) then OII (and H-K and g-band) is
visible out to S8 (z = 3.5), allowing high fidelity velocity measurements (and therefore HOD
analysis, at least for massive halos) for S1 to S8. High quality OII redshifts are only possible
in S9 if the spectrograph range is increased to 2400 nm (i.e. K-band limit). It should be noted
that the regular spacing of S1 to S7 could not be continued for S8 and S9 because the
important OII line becomes highly attenuated by the sky, even at an excellent site such as
MSE on Mauna-Kea. The S8 and S9 volumes were therefore adjusted to optimally sit within
the H and K bands respectively. By some cosmic conspiracy a 300Mpc/h LoS baseline
almost exactly fits within these two bands.
Mayall/DESI
WHT/WEAVE
VISTA/4MOST
Facilities
VLT/MOONS
Subaru/PFS
Subaru/FMOS
MSE
1
Sky Transimission
0.8
0.6
0.4
0.2
0
6
S9 Lya OII
5
UV Absorption
12
G−band
Travel Time / Gyrs
4
Hb
Redshift
S8 OIII,5008
Mg
3
Na
11
S7 Ha
2
10
S6
9
S5
8
1
S4
S3
4 6
S2
S1
0
0
0 500 1000 1500 2000 2500
Wavelength / nm
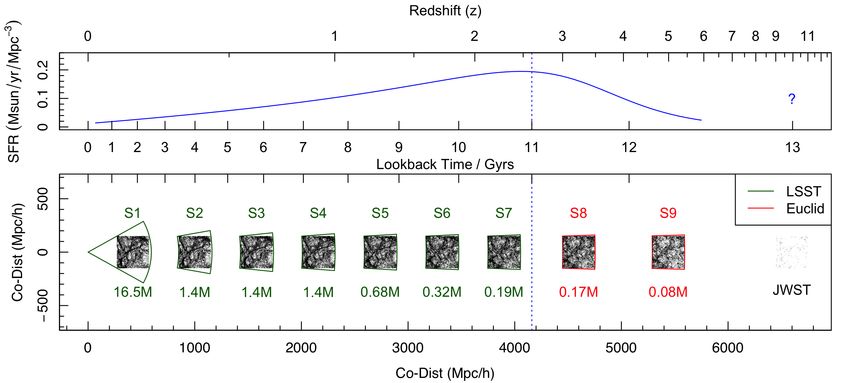
Figure 3: Accessibility of different spectral features for the different proposed volumes. The nominal 380-1300
nm MSE limit is shown as vertical dashed lines, with proposed extensions at 1800 and 2400 nm (H and K band)
also displayed. S1-S7 via the OII line are still viable with a 380-1300 nm facility, but S8 and S9 are not viable).For redshift measurements the key requirement is velocity accuracy. Pragmatically, a velocity accuracy that is within the typical velocity width of individual galaxies is appropriate. With moderate (R~ few thousand) resolution we can expect to obtain a velocity accuracy of a few 10s km/s, where no more than 30 km/s is ideal. 1011/12M¤ halos have typical velocity dispersions of 100/200 km/s, and with 10 galaxies in a group we would expect relative velocity dispersion errors of 10% / 5% respectively, which is perfectly adequate for the more stringent group finding and halo occupation analysis requirements. It is not worth attmpeting to get much higher velocity accuracy because the internal dispersion of even a 109M¤ galaxy is ~100 km/s, so velocity accuracy rapidly becomes limited by the complex internal kinematics of galaxies, not the spectral resolution. OII will provide a good estimate of the systemic galaxy velocity for all nine surveys, and Ha will also be an excellent velocity measure where available (to S4/S6/S7 if the spectrograph limit is 1300/1800/2400 respectively). Ly-α is a complex feature that contains high velocity nebula components and severe self-attenuation, so group finding (and associated halo science) based on Ly-α alone is likely to be highly compromised. To extract the useful information for the data (i.e. redshifts) we would expect to require a basic reduction and then we would run auto-z (Baldry et al 2014) or similar. This is a proven technique for extracting redshifts via absorption or emission lines, and does not rely on good flux calibration or continuum templates. This is a proven process from the GAMA survey, and should work equally well on MSE data given we will be operating in a similar S/N regime. A successful redshift measurement requires good continuum S/N in the rest-frame optical regime (i.e. S/N of a few). From experience with GAMA, this is typically adequate to extract robust redshifts with a feature cross-correlation fitting code (auto-z, Baldry et al 2014). We expect to be able to obtain emission line equivalent widths and associated star formation rates with data of this quality. We would expect to be able to measure reasonable Ha derived star formation rates (which have higher S/N and are usually more robust than OII derived rates) from S1 to S4/S6/S7 if we have a 380 to 1300/1800/2400 nm spectrograph range. These are also the survey limits in which we can plausibly construct a full BPT diagram to separate AGN/LINERS/star-forming galaxies. Such a division increases the scientific quality of the survey because AGNs and LINERS can otherwise be a strongly contaminating population for any star-formation measurement. 4. Target selection Table 1 specified the major characteristics of the required surveys. S1-S7 will use a LSST defined survey selection. LSST is being designed to produce robust photometric redshifts for i < 25.3 out to z = 2.5 and over the entire visible sky, so this comfortably covers the proposed area of S1 (3000+ sq deg) and the redshift limit of S7. For S8 and S9 a Euclid or W-FIRST photo-z selection would be required, using the proposed deep surveys. These are nominally of the required depth, although it is uncertain where on the sky they will be placed. Clearly it is vital they are visible to MSE, since this is the only plausible source of photo-z optimized targeting for S8 and S9. For S2-S7 it is possible that a similar selection could be made using photo-z from the Subaru HSC surveys, but S1 is substantially larger than the proposed HSC fields. Having uniform photometry throughout is optimal, so LSST-based input catalogues for all of S1-S7 is preferable.
Survey                                z(low z(high Area(/(deg2 Vol(/(Gpc3         Photo         Selection                           SM(lim(/(M! Gal(N((M) Fibre(H((M) Passes
S1                                          0 0.214      3233.8      0.0674       LSST          i
be the case that using a small number of dedicated IFUs to target highly clustered regions could be the most efficient approach to obtaining redshifts. A detailed cost-benefit analysis would need to be made to answer this question using realistic sky simulations. In total we are proposing to observe 22M galaxies over the nine survey cubes. There is, of course, scope to scale the surveys down, but there are clear scientific compromises to this. The survey volumes have been selected to guarantee the smallest contiguous volume that has obtained homogeneity in all dimensions (Srimgeour et al 2013, Driver & Robotham 2010). This means all measures of large-scale structure (fractal nature, halo abundance) and galaxy evolution (particularly cosmic star formation rate and merger accretion rate) can be directly interpreted as a Universal average. Similar studies over substantially smaller volumes by competing facilities (e.g. Subaru-PFS and VLT-MOONS) will be primarily limited by sample variance, which has been historically a huge source of uncertainty at high redshift. The photo-z pre-selection minimises wasted observations that are not within the windows of high interest, and hence LSST (and at higher redshift Euclid or W-FIRST selection) is vital. The photometric limits are such that beyond S2 we do not attempt to be complete below stellar mass =5x10⁹ M¤ (see right panel of Figur 4). This takes us 1 dex below M* in the range of surveys where the limit is applied, which appears to be enough to ascertain the full Universal fraction of mass accretion through mergers (see Robotham et al 2014) since the integrated mass should be convergent in this regime. This sliding limit is applied for S2 to S4. For S5 and above it is not feasible to get down to such a depth given a hard photo-z pre-selection limit from LSST of i = 25.3, unless there is future deep-field coordination between MSE and LSST. In summary, the current design is the minimum in depth and volume required for the range of potential science outlined. There is scope to drop entire survey cubes with the loss of potential science. For exploring entirely new parameter domains S1 and S9 are objectively the most compelling for their proposed depth and volume respectively. S8 and S7 are the next most compelling due to the paucity of contiguous volume surveys in these regimes. S5 to S9 collectively span the increase, peak and decline in star-formation, mergers, large-scale structure formation and quasar activity. They also cover the transition between turbulent clumpy star-formation to smoother disk growth mechanisms. For this reason doing all five of S5-S9 is highly compelling. S1 to S4 are the surveys that will have a consistent HOD analysis given their equivalent stellar mass limits (deeper in the case of S1). A case could be made for only doing a subset of S2/S3/S4, perhaps merging S2 and S3 into an intermediate volume. S4 in particular is expensive in terms of fibre-hours required (6.1m, the most of all surveys), but it does offer an 8 Gyr look-back timescale for the HOD science case (over half the age of the Universe), so from a galaxy evolution and halo evolution standpoint it is a more interesting survey regime than S2 or S3. Pragmatically, a merger between S2 and S3 would be the first option to consider, should the survey scale outlined be considered too ambitious for MSE. We can make an approximate estimate to the total time to conduct all nine surveys using a few assumptions. If we assume MSE will have double the integration efficiency compared to VVDS (conducted using VIMOS an 8.1m VLT since 2003) then we approximately expect to obtain a redshift in T = 0.5 x 4.5^(i – 23), i.e. ~0.5/2/10 hours for i = 23/24/25 respectively. Using this rough estimate we can calculate the number of fibre hours required for each of the nine survey volumes (these numbers are given in Table 1). The distribution of i-band magnitudes is shown in the left panel of Figure 4, where it is clear that only a minority of sources are fainter than i=24, i.e. extreme integration times should be quite rare. In total our 22M objects will require 26M fibre hours (assuming efficient survey tiling, and that we do not integrate longer than required on sources). Assuming we observe for 100 dark/grey nights per year, for 10 hours a night and using a nominal 3,200 multiplex we have 3.2M fibre hours per year for the surveys (this assumes no survey inefficiency, simulations are required to
determine the true fibre placement efficiency). This means all nine surveys will take
approximately seven years to complete. The main telescope-side speed-up that is possible is
to increase the multiplex of MSE. If MSE has the same multiplex as DESI (5000 fibres) then
the combined surveys will take 4.4 years to complete. A survey-side option is to reduce the
number of surveys (as outlined above). A strong case can be made for not reducing the
volumes or depths of the proposed survey volumes, so the first option to consider is whether
a subset of the proposed S1 to S9 surveys could be merged. Another survey-side is to spread
the RA baseline such that the surveys are observable across all available ~200 dark/dark-grey
nights. This could speed up the survey campaign by a factor ~2 (i.e. all nine surveys will take
3.5 years) but at a serious cost to any other dark sky (particularly extra-galactic) science case.

A note on the higher redshift (S8 and S9) volumes: pure drop-out selected z ~ 5+ samples are
highly contaminated from M-T dwarf stars and lower-z galaxies (z ~ 1 for z ~ 5 selections),
where either saw-tooth-like dwarf stellar spectra or the 400nm break are identified
consistently with the target Ly-α break. Ambiguity arises in these selections as they
traditionally only observe in three bands (one short-ward and two long-ward of Ly-α at the
target redshift, e.g. r/i/z for z~5), and simply aim to select sources with a strong continuum
break and relatively flat-continuum - as expected for high-z sources where we are probing the
UV-continuum region. With only a single colour in this continuum region it is difficult to
differentiate true high-z sources from their low-z counterparts (see Stanway 2008 for a
detailed discussion on contamination in high-redshift photometric selections).

However, with additional bands (specifically NIR from Euclid or WFIRST) selections can be
improved to rule out such contaminating sources. For example, multiple NIR bands allow for
a much more detailed analysis of the spectral slope long-ward of the break, allowing the
removal of sources with non-flat spectral shapes. In addition, with high quality data out to K-
band, we should be able to identify the 400nm break in high-z sources out to z=5.5 (between
H and K). This will significantly improve the fidelity of our photo-z measurements and aid in
the removal of contaminating sources.

5. Cadence and temporal characteristics

Repeat observations are not required for the proposed surveys.

6. Calibration Requirements

The wavelength calibration needs to be accurate to better than the desired velocity accuracy
throughout (~30 km/s, for reasons outlined above). This is to ensure we do not have any
systematic biases in our redshift distributions. The expectation would be to have pixel level
or better calibration accuracy.

The main sky features will need to be either well subtracted or potentially (for stronger line)
masked entirely. Experience from GAMA suggests that 1% sky subtraction accuracy is
probably adequate for obtaining good redshifts.

For the core redshift science the spectrophotometric calibration does not need to be
especially good. Getting Ha SFR from EW also does not require particularly good flux
calibration (only relevant for the low-z HOD science case).

7. Data processing
Instrumental signatures (the major ones) will need to be removed prior to redshift
measurements. Auto-z is fairly robust to poor flux calibration and even imperfect sky
subtraction issues, but the wavelength calibration would need to be very good throughout.
Potentially the exact wavelength calibration could be left as a variable within auto-z, but this
is probably non-ideal, and likely to create degenerate solutions.

The zeroeth-order quantity we need from the data is the redshift. We expect to do this using a
tool similar to auto-z (Baldry et al 2014). Higher order products, depending on the data
quality (since these products will not drive the survey design), are potentially EW for various
features. The expectation would be to do this via direct line summation or Gaussian fitting
technique (e.g. Hopkins et al 2013). The primary requirement for all nine surveys is redshifts,
with additional science made possible if spectral analysis is possible (potentially only for the
brighter targets observed).

For the core HOD related science we require robust multi-band photometry (optical and NIR
restframe ideally), and stellar mass estimates, for all targeted objects. Since we will be
requiring photo-z to enable optimal pre-selection we should expect to have this information
in place prior to redshifts being obtained. For various science applications it is possible to
imagine further data being obtained (e.g. restframe UV, MIR, FIR and radio), but this is not a
specific requirement for the core science cases. The most obvious source for such data over
~3,200 sq deg is LSST and Euclid/WFIRST. Other teams are responsible for producing the
photometric data products for these surveys, but there may be an advantage (or even
requirement) for MSE to be collaboratively involved with these teams at an early stage.

At a minimum we would expect to return sky subtracted, wavelength calibrated, but not flux
calibrated, 1D spectra for each targeted object. We would also produce redshift
measurements with quality estimates for each object.

8. Any other issues

How the surveys are distributed across the sky and how they are scheduled is a very serious
issue that requires careful consideration. As shown in Figure 5, S1 is likely to be
appropriately centred close to RA=180 and Dec=0. There is no strong science led reason to
require S2 to S6 to overlap on the sky, so serious survey-speed gains might be possible if
they are spread out over a large RA baseline. The big difference between traditional extra-
galactic surveys (e.g. SDSS, GAMA, z-COSMOS) and the proposed MSE surveys is that
they will be photo-z selected, so there is no particular observing gain through stacking them
(wedding cake style) in overlapping parts of the sky. They are separated along the co-moving
line-of-site such that even large-scale structure is barely associated between adjacently
numbered survey volumes. At a minimum the fields should be spread over ~7-8 hours in RA
(105-120 deg) to ensure the proposed surveys can be observed efficiently by MSE throughout
a night (i.e. if all surveys shared the same central RA then the observing efficiency drops by a
factor of a few, meaning the combined survey would take 20+ years).

A number of science cases could be made for placing S7 – S9 within the extent of a
foreground field since they will contain extremely bright AGNs. A number of science cases
can potentially make use of bright background AGN, e.g. as probes of the inter-galactic
medium (IGM) at lower redshifts via the study of absorption features in the spectra of the
distant AGN. S7 and S8 in particular are close to specifying the same survey requirements as
the SRO concerning the 3D mapping of the IGM.
A lot of thought needs to go into the careful design of the survey regions, with consideration
given the historic datasets in certain regions. This is particularly true for the UV and FIR,
since this data will not be substantially improved for low redshift studies for a generation (the
wide field GALEX and Herschel telescopes are now decommissioned). Thought must also be
given to upcoming facilities. In the radio the SKA (based in South Africa and Australia) will
be a game-changer for extra-galactic HI and continuum studies out to z = 1+ (current
facilities observe to only z ~ 0.1). Clearly the SKA will be optimal for Southern hemisphere
fields, and MSE will be located in the Northern hemisphere. To combat this any proposed
fields should be close to the equator, making them reasonably observable by facilities in
either hemisphere. It is also vital that MSE has some influence and involvement in the
location of the future Euclid and WFIRST deep fields. If these are placed at declination
below -40 deg then they become unviable for the MSE S8 and S9 volumes because the
airmass at Mauna Kea is always poor. In general it is advisable that the MSE survey volumes
avoid the ecliptic and Milk-Way plane (possible for S2-S9, see Figure 5) since this at least
ensures shallow Euclid coverage with improved resolution compared to LSST.

In summary, a huge amount of coordinated effort is required if maximum science is to be
extracted from the proposed MSE surveys.

Figure 5: Straw-man locations for proposed S1 – S9 regions, that are visible from both Mauna Kea (+20 deg lat,
MSE) and Cerro Pachón (-30 deg lat, LSST). The Milk-Way and Ecliptic can be seen as great circles of
avoidance for the proposed Euclid shallow survey (purple). The distribution shown here is such that the
proposed MSE survey volumes are only observable in one semester, but with a broad RA baseline allowing
them to use full nights efficiently. A number of permutations for the survey design and sky distribution are
possible, so effort must be invested into the optimal design of the MSE survey suite.
The size of fibres on sky is a potential issue. The nominal 1” fibre size is clearly optimised
for expected point-spread-function at a good seeing site such as Mauna Kea. For extra-
galactic work a fibre size of 2” (e.g. AAT) to 3” (e.g. SDSS and the VLT/KMOS IFU unit
size) is considered optimal. Galaxy sizes become almost constant for z > 1 at ~2-3”, so all of
S1-S9 would likely achieve better throughput with larger fibres (especially S1). Having a
range of available fibre sizes would also be advantageous. Detailed study of the optimal fibre
size distribution is required to fully assess this issue, since uniformly larger fibre size would
have a certain negative impact on stellar focussed science.

There are still a significant number of unknowns that could seriously impact any future multi-
epoch HOD focussed survey. The core requirement for the highest priority elements of the
science case is for high completeness at all angular scales regardless of clustering on sky.
How efficiently MSE can do this will clearly be a function of the intrinsic source clustering
and the fibre placement technology. Any time estimates could be out by a factor of ~2 if the
Universe and technology conspire to make high completeness on small spatial scales
difficult. This is a complex issue to overcome, and will require detailed simulations to
understand fully.

A mechanism for rapidly assessing whether any given target has a reliable redshift and can
therefore be removed from the target list would be hugely beneficial to the survey. Such
dynamic feedback would prevent time wasted increasing S/N beyond what is required for the
core case. This would require a pipeline that can dynamically reduce, stack and redshift the
individual short integrations (e.g. 20 mins) for each galaxy. Scheduling software that can
cope with such dynamism (currently not an option at ESO survey facilities) would give MSE
an appreciable advantage in the domain of extra-galactic surveys.
You can also read