Sopa Piranha* The Missing Catalyst June 23, 2011 - Issue #20
←
→
Page content transcription
If your browser does not render page correctly, please read the page content below
Sopa Piranha*
                      The Missing Catalyst
                      June 23, 2011 - Issue #20

This quarter‘s Sopa takes a look at the platinum group of metals (PGM)—platinum, palladium,
rhodium, osmium, iridium, and ruthenium. Our primary focus is on platinum with a minor focus on
palladium. We take a brief look at the history of platinum and its uses, along with the basics of
what we should know about platinum. As always, if you are generally familiar with platinum, you
may wish to skim or entirely skip section one.

We also take a deeper look at the supply/demand environment, primary end users and the
impending impact on both near and longer-term pricing. We have addressed a wide array of
opinions and research on the topic to demonstrate the investment opportunities within the space.
Our core thesis is that the PGM‘s only need one catalyst to send prices skyrocketing in Q4.

Some of you may not have heard the recent news; catalytic converter theft is on the rise. Many
local police stations are laser etching license plate numbers into the catalytic converters for those
people who choose to take them up on it. Why is it that thieves are targeting catalytic converters?
Platinum and palladium prices have run quite a lot and the scrap value of a catalytic converter is
apparently now significant enough for thieves to take the risk. We show you why platinum and
palladium are worth watching in your portfolio as well as your garage.

Section One: What should I know about platinum?
   I.   A Brief History and Overview—the earliest evidence of platinum’s use dates to near
        700B.C. with the ancient Egyptian high priestess Shepenwepet II. The small, adorned copper
        alloy box, excavated along with the accompanying sarcophagus can be traced to the era of the
        high priestess. While the box is made primarily of copper alloys, it is also decorated with gold
        and platinum group alloys. It is questionable whether or not the use of platinum was
        deliberate at the time but nevertheless it is noteworthy.

        As for platinum itself, platinum is a chemical element with the symbol Pt and the atomic
        number 78. Platinum derives its name from the Spanish word platina, which is a
        diminutive of the Spanish word for silver—plata. During the 16th century, Spanish
        Conquistadores came across platinum in their ultimate quest for gold and El Dorado, the lost
        city of gold, in the region known as New Granada— in present day Columbia. However, the
        Spanish largely dismissed platinum and viewed it as needing to ‗ripen‘ into gold so they
        returned the majority of their finds to the rivers where they thirsted only for gold.

        It wasn‘t until the 18th century that chemists began looking more closely at platinum and it was
        not until the 19th century that techniques were developed for refining platinum,

© 2011 SOPA PIRANHA Market Commentary, Wolf Asset Management International. All Rights Reserved.      1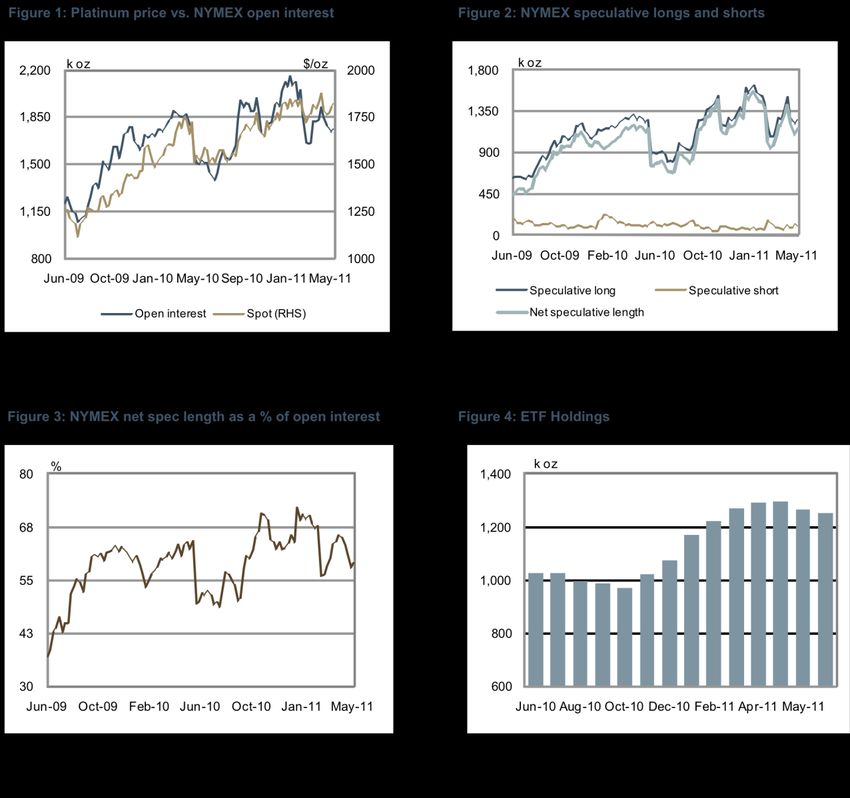
palladium, and later rhodium, iridium, and osmium. Columbia was still thought to be the
      principal source of supply at this point in history but that began to change near the end of the
      19th century as platinum was discovered in the nickel and copper ore mines of Canada in
      1888, near Ontario. In 1924, platinum was discovered in South Africa’s Transvaal province
      and shortly thereafter, two very large deposits were discovered which later became known as
      the Bushveld Igneous Complex, now known to be the world‘s largest reserve of platinum.
      Today, we know the majority of the world’s platinum deposits reside in South Africa and
      surrounding regions with 80+% of the 2010 world supply. See below a map of the
      Bushveld Complex and mine breakdowns by ownership. See also the table showing supply
      breakdown for 2010 by region. We delve further into supply and demand dynamics in section
      two but want to demonstrate the overall regional breakdown so the reader may have an idea
      of where the world‘s platinum supplies are generally sourced.

                                        Bushveld Igneous Complex

                                     Source: Anglo American

© 2011 SOPA PIRANHA Market Commentary, Wolf Asset Management International. All Rights Reserved.    2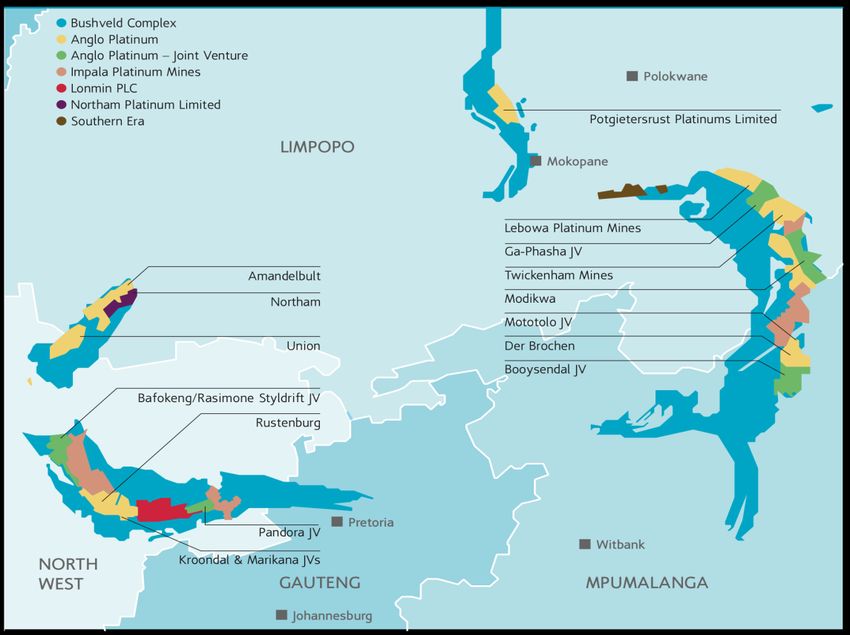
2010 Platinum Supply ex-Recycling

                                     Platinum Supply 2010
                                   UBS Macquarie    Johnson Matthey          Average
             in ,000s ounces
             South Africa         4,585         4,619                4,635        4,613
             Russia                 810           832                  825          822
             North America          210           210                  210          210
             *Other                 379           348                  390          372
             Total                5,984         6,009                6,060        6,018
*Note: Roughly 72% of the ounces defined as "Other" are mined in Zimbabwe and refined in South Africa.
 Depending on the data source, recycling adds between 1.095(Macquarie)-1.84(Johnson Matthey) million
ounces to world supply. Both firms choose to look at recycling as a demand reducer within sectors
               (primarily autocatalyst and jewelry) rather than a source of supply.

                       **Data Sources: UBS, Macquarie, Johnson Matthey—2011

  II. Platinum and Uses: Platinum is rare, only occurring at the rate of 0.005 parts per million in
      the earth‘s crust. By comparison, silver for example occurs at a rate of 0.075ppm, gold
      0.004ppm. Platinum has many favorable properties that make it suitable to industrial
      applications. Platinum is extremely dense. Platinum sometimes occurs as a native metal but
      it more commonly occurs in other PGMs or along with nickel and copper ore.

      Because of its extremely high melting point (3,214.9°F) and density relative to other elements,
      virtually all impurities can be melted away leaving the platinum as a stand-alone. Platinum by
      itself is highly resistant to corrosion and also unsusceptible to both hydrochloric and
      sulfuric acids. Platinum is non-magnetic.

      Platinum is more efficient than palladium at removing harmful gases from the combustion
      process but often times the two are combined for the use in catalytic converters. Diesel
      engines in particular, require a higher proportion of platinum in their catalysts than
      gasoline based engines. Platinum demand has been on the rise as environmental legislation
      has become increasingly stringent. The demand side of the equation is closely linked to the
      global auto and truck sales. Approximately 40% of gross platinum demand (33.9% of net
      demand) comes from autocatalyst uses. (Note for our purposes, net demand is inclusive of
      recycling as a demand reduction which pertains primarily to autocatalysts and jewelry.)

      Autocatalysts are the largest user of platinum in the world but also the largest source of
      recycling with 35% of gross demand needs being met by recycling. Roughly 40-45%
      (Johnson Matthey v. Macquarie data) of 2010 global world supply, inclusive of
      recycling, is currently being taken up by autocatalysts. Autocatalysts also make up the
      lion’s share of demand for palladium with 56.6% of gross demand (53% of net demand)
      coming from the sector. When looking at recycling/use ratios, palladium recycling within
      the sector satisfies roughly 24% of gross autocatalyst demand when compared to
      platinum’s 35% rate.        For 2010, total gross palladium autocatalyst demand as
      percentage of global world palladium supply inclusive of recycling equated to 60%.

© 2011 SOPA PIRANHA Market Commentary, Wolf Asset Management International. All Rights Reserved.     3
Jewelry demand is a significant demand driver for both platinum and palladium. 31% of gross
platinum demand is jewelry related, second only to autocatalysts. Jewelry recycling is also
a significant source of supply (demand reduction). When looking at the Matthey data of
recycling to use ratios, we see that roughly 31% of total platinum jewelry demand needs
are met via recycling. Palladium jewelry is also becoming increasingly popular and falls
fourth behind autocatalysts, electronics and investments as a source of demand.
Platinum is also in the electronics industry where it is used in hard disc drive and LCD
monitors. Palladium is used in multi-layer ceramic capacitors, hybrid integrated circuits
and plating for connectors within computers. Platinum is used by the glass industry in flat
panel displays and mobile phones. Thin film transistor liquid crystal displays (TFT-LCD) are
on the rise and are a source of new demand. Platinum is used in the chemical industry as a
catalyst in the manufacture of fertilizers, explosives, polymers and in oil refining.
The pharmaceutical industry uses platinum in anti-cancer drugs, most notably cisplatin,
which is used in chemotherapy treatments. Platinum is also used in cardiac stents,
electrophysiology catheters, and neuromodulation devices. A source of increasing potential
demand for both platinum and palladium comes as a major use in fuel cells where electricity
is produced as a by-product of a chemical reaction between hydrogen and oxygen.
Industrial demand plays an important role in the price of platinum and traditional
supply/demand relationships tend to dominate price historically. Any significant uptick
in investment demand is expected to create imbalances in the supply/demand dynamic
and thereby price action. Please see below the overall demand statistics for Platinum in
2010. The demand picture alone is compelling for prices to rise but it is the supply side that
may provide us with the necessary catalyst to create the explosion we expect in Q4.
2010 Platinum Demand by Sector
UBS Macquarie Johnson Matthey Average
in ,000s ounces
Autocatalyst Gross 2,985 3,203 3,125 3,104
Autocatalyst Recycling (1,095) (1,095) (1,085) (1,092)
Autocatalyst (Net of Recycling) 1,890 2,108 2,040 2,013
Chemical 450 450 445 448
Electrical(Net of Recycling) 225 237 210 224
Glass 365 380 345 363
investment 435 488 650 524
Jewelry(Net of Recycling) 1,685 1,685 1,670 1,680
Petroleum 175 220 170 188
Other 505 461 510 492
Total Demand(Net of Recycling) 5,730 6,030 6,040 5,933
*Note: Jewelry recycling is the only major re-user of platinum other than autocatalysts. Roughly 31% of
gross jewelry demand is met with recycling according to Johnson Matthey. Roughly 35% of gross
autocatalyst demand is met by recycling. Electrical demand is only minimally mitigated by approximately 4-
5% of recycled material. Approximately 50% of the demand in category noted “other” is biomedical/medical
related.
**Data Sources: UBS, Macquarie, Johnson Matthey—2011
© 2011 SOPA PIRANHA Market Commentary, Wolf Asset Management International. All Rights Reserved. 4Section Two — Closer Look at Supply and Demand
Below we look at the primary industrial sectors of demand in closer detail, as well as investment
demand. We finish section two with supply and consider several factors that may prove to be
headwinds for production in the near and medium term, giving the market a catalyst to drive
platinum prices higher.
I. Autocatalysts play a key role in demand for platinum as the number one consumer of the
world‘s platinum. A typical passenger car contains 4-5 grams of platinum group metals on
average per catalyst. Diesel cars average closer to 8 grams per catalyst. The range is quite
large depending on engine size and type. For micro cars for instance, approximately 1 gram is
used, while for very large powerful vehicles, up to 15 grams is used per catalyst. The typical
ratio for a gasoline car catalyst is 1.5 grams of platinum to 4.5 grams of palladium.
For diesel cars the majority of loading in the autocatalyst is platinum given its superior
properties in reducing emissions. Diesel passenger cars typically contain 8 grams of
platinum. Catalysts generally require a high temperature to function and since diesel engines
operate at lower temperatures, there are fewer catalysts that are able to function properly
under those conditions; therefore, diesel engines are fairly dependent on a higher proportion of
platinum for use in their autocatalysts. Exact amounts of platinum and PGM in autocatalysts
are confidential information between the manufacturer of the catalyst and the car
manufacturer. From recent UBS literature, passenger car ratios of platinum to palladium are
near the 1.5/6 grams of platinum with 2.4/5 grams palladium. Johnson Matthey, BASF and
Umicore are the three major suppliers of autocatalysts together accounting for roughly 87% of
the global market split almost equally.
While the terrible earthquake in Japan caused sell off in the PGM space, the medium to long-
term impact on auto production is envisaged to be minimal. If anything, temporary reductions
in supply will create pent up demand in the medium term with continued global growth.
Prior to the events in Japan, for the week ending February 8, 2011 NYMEX platinum
speculative net long sat at 1.56 million ounces representing 69.2% of the total combined
open interest. Japan‘s earthquake and ensuing tsunami sent levels as far down as 945,000
ounces in the week ending March 22. This represented a 39+% reduction in net longs from
the February highs. For the week ending May 31st, speculative net longs sat at roughly 1.15
million ounces, some 26% below February‘s high with some recovery from the March lows.
This represented 59% of the total combined open interest in the NYMEX platinum market.
An overall reduction in net longs undoubtedly helps to mitigate downside with fewer sellers in
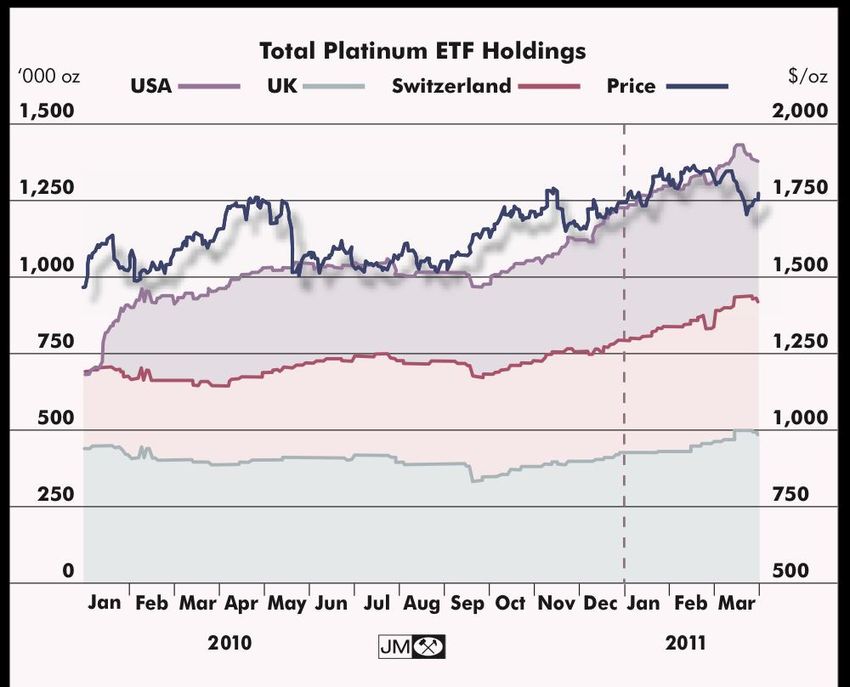
the market relative to levels earlier in the year. ETF ounce holdings for week ending May 31
represented some 1.25 million ounces which is near all time highs. ETFs first hit the 1.2
million ounce mark in 2010 but have since surpassed those levels. See the tables below and
figures depicting NYMEX interest statistics, ETF and price overview. Note the steadily
declining ratio of platinum to palladium prices, which are near an all-time low.
© 2011 SOPA PIRANHA Market Commentary, Wolf Asset Management International. All Rights Reserved. 5PLATINUM SPECULATIVE NET LONG AS A PERCENTAGE OF TOTAL(COMBINED) OPEN
INTEREST--WEEKLY DATA
3/95- 12/99- 12/04- 12/06- 12/08- 12/09- 12/04-12/07
HI 73.4% 73.4% 73.4% 72.1% 72.1% 72.1% 73.4%
LOW -35.4% -21.1% 5.3% 16.2% 32.2% 48.6% 5.3%
AVERAGE 34.6% 41.9% 49.9% 51.4% 55.1% 60.3% 47.9%
*Note: "-"=Current=May 31, 2011
Platinum and Palladium Prices & Ratios 2011
Sources: Source: **Source: CFTC, NYMEX, Johnson Matthey, Bloomberg
© 2011 SOPA PIRANHA Market Commentary, Wolf Asset Management International. All Rights Reserved. 6Despite the selloff in the futures market and milder selloff in the ETF space from an ounce
holdings perspective, the price risk is to the upside when looking at auto production.
Global auto production is still on track to increase barring any major global macro slow down.
Off the back of the events in Japan in April of this year, UBS estimated that 2011 global auto
production would be reduced by approximately 2.5% factoring a 14% reduction in Japanese
auto production, roughly the equivalent of 1.35 million vehicles. More recent data from the
Japanese Auto Manufacturers Association suggest that their estimates were too optimistic.
March and April declines in Japanese production of passenger cars, trucks and buses dropped
57% and 60% respectively year over year. Toyota announced they expect full production in
North American plants by September rather than their earlier estimates of November. Still,
more vehicle production will be foregone than originally thought. Already, the combined
loss of Japanese production over the two months ended April is 981,111 vehicles for 2011.
Estimates by UBS were 700,000 vehicles forgone by the end of 2012 with upticks in spare
capacity elsewhere in the world. It is unlikely that full production will be met until Q4 2011/ or
Q1 2012. A better estimate is to double UBS‘s estimate of production losses specific to Japan
for 2011 off the back of recent news of 2.7 - 3 million units of lost production and ultimately 1.4
million units of production foregone by 2012. While this is a significant figure, its impact should
be most felt following the March/April events. This is why we have seen some manufacturing
slow down already. However, in the medium to longer term, there is a developing scenario
of pent up demand and more production.
Japanese Auto Production 2010/2011
Source: Japanese Automobile Manufacturers Association, JAMA Active Matrix DB System
Platinum is less levered to auto production than is palladium with net demand attributable to
autocatalyst for platinum and palladium at 34% versus 53% respectively. Further, total
platinum demand as a percent of global world supplies, inclusive of recycling are 40% versus
the 60% of palladium (Johnson Matthey). Platinum is also more levered to diesel auto
production than is palladium so despite the events in Japan, platinum should not be as
significantly impacted relative to palladium and should outperform in the near to
© 2011 SOPA PIRANHA Market Commentary, Wolf Asset Management International. All Rights Reserved. 7medium term. The ratio charts above also show that in relation to palladium, platinum is near
all-time lows at 2.27x versus 2009 highs of 5.49x. Gasoline engines are driving demand in
emerging markets, still favorable for palladium in the medium to long term. See below the
regional platinum autocatalyst demand. The diesel demand component is evident with the
majority of platinum being consumed by European manufacturers. Diesel engine
penetration remains a key variable for platinum demand. By contrast, see comparative
palladium figures.
Source: Johnson Matthey
The long-term recovery of global auto production is not expected to be significantly impacted
by damage to Japanese auto production plants. Previous UBS estimates that overall impact
on global auto production is estimated to be a ‗loss‘ of 700,000 vehicles foregone by 2012
equate to an equivalent loss of 40,000 ounces of platinum and 60,000 ounces of palladium, or
800 platinum contracts and 600 palladium contracts on NYMEX. To put this into perspective,
for the week ending May 31, total combined open interest on platinum sat at 39,078 contracts.
It would seem more conservative based on recent data to double this number and its ensuing
impact on platinum and palladium but nevertheless we remain optimistic on platinum prices.
We believe the pent up demand for cars will suddenly show in the demand creating sudden
upside potential.
Moving to historical and forward looking production, in 2009, 47.5 million light passenger
vehicles were assembled globally. There were 56 million assembled in 2010. During the
month of May, Macquarie estimated 2011 levels will be up still again to 58 million despite the
events in Japan. Please see below charts for vehicle production.
© 2011 SOPA PIRANHA Market Commentary, Wolf Asset Management International. All Rights Reserved. 8Source: Macquarie, Autofacts—May 2011
Emerging markets continue to support demand, particularly the BRIC region. Despite the
recent fall in auto sales in China during the month of May, a second Chinese ―cash for
clunkers‖ program will further spur platinum and palladium demand given the fact that
many of the older vehicles being scrapped do not have catalysts. A general lack of catalysts
will mean no additions to platinum or palladium supply from recycled vehicles. A slowdown in
Chinese vehicle sales is to be expected from the previous decade‘s break-neck pace but
consensus forecasts going forward continue to predict low double digit growth for the region.
See below table of passenger vehicle sales (light vehicle) changes year over year with forward
looking estimates by Macquarie.
© 2011 SOPA PIRANHA Market Commentary, Wolf Asset Management International. All Rights Reserved. 9Increases in global auto production in the medium to longer term are bullish for both platinum
and palladium. Downside risks are ever present but fewer longs in the market are
encouraging. Increasingly stringent emissions legislation in the US and Europe and tougher
global standards going forward also bode well for PGM. Engine types and sizes will affect
platinum and palladium independently with diesel benefitting platinum more than palladium;
however, both are equally set to benefit from the overall picture of global auto
production/sales, as well as, the rise in combination with more stringent environmental
standards.
See below Macquarie‘s forward-looking model for PGM loadings per vehicle. The chart below
does not take into account legislation for heavy duty and off-road emissions which is
imminent in Europe and the US. This stringent legislation will be additionally beneficial
for platinum and palladium. Overall, autocatalysts are an increasing source of demand and
should benefit prices.
© 2011 SOPA PIRANHA Market Commentary, Wolf Asset Management International. All Rights Reserved. 10II. Jewelry, while not as significant as autocatalysts, represents a significant portion of demand.
For the year 2010, jewelry-related gross platinum demand was 2.42 million ounces which
represented a 14% decline from unusually high 2009 levels. Chinese demand represented
1.65 million of those ounces which was a 21% reduction in volumes compared to 2009.
Recent surveys indicate that the share of platinum as a percentage of total jewelry sales is on
the rise with over 40% of the total value of jewelry sales spent on platinum.
© 2011 SOPA PIRANHA Market Commentary, Wolf Asset Management International. All Rights Reserved. 11Jewelry makes up an important part of demand for platinum at 29% of net global demand.
Platinum jewelry spending is highly elastic with price and also correlated to GDP growth/GDP
per capita. Europe and North America are experiencing depressed volumes while Chinese
buying has been strong on price dips, evidenced in February and March as volumes on the
Shanghai Gold Exchange set record highs. China remains the largest consumer of platinum
jewelry. Strong volumes and buying for platinum on price dips in China is creating a floor on
demand levels.
Shanghai Gold Exchange Platinum Turnover
III. Industrial and other sector demand: Chemical sector demand increased by 53% in 2010 to
the highest levels since 1975, in sympathy with the overall restocking theme across the globe.
India and China were bright spots with an increasing need for lightweight polymers in the
automotive and packaging sectors. China‘s chemical manufacturing industry remained the
world‘s largest and fastest growing in 2010.
Petroleum refining demand was down from previous year‘s levels as spare capacity remained
in the sector and little new capacity was built out as was any corresponding need for platinum
catalysts. Electrical demand for platinum was up year over year by 30,000 ounces with
increases in consumer electronic devices and also business restocking of computer
equipment. Glass demand was up by 335,000 ounces for 2010 with an increase in new and
replacement glass manufacturing facilities. Increases in consumer demand for flat panel
displays and also a recovery in the construction sector helped demand for both glass and
glass fiber resulting in increased demand for platinum fabrications and components.
Medical and biomedical demand was slightly higher than 2009 continuing the upward trend
over the long term. New demand came from cardiac stents, electrophysiology catheters and
neuromodulation devices. Anti-cancer drug demand also remained robust (Johnson Matthey).
© 2011 SOPA PIRANHA Market Commentary, Wolf Asset Management International. All Rights Reserved. 12Fuel cell technology demand almost doubled in 2010. Stationary power systems where
electricity generation is combined with heat generation are the leading area of demand within
the fuel cell sector and a potentially increasing source of platinum demand which though
currently small has room to grow. Both Japan and Korea are subsidizing consumer purchases
of stationary power systems. Increasingly stringent emissions legislation and concerns over
the environment are expected to encourage broader attention to fuel cells as a source of clean
and efficient energy.
IV. Investment demand while near highs in the ETF market is not at previously seen levels in the
futures market. Please see below tables showing speculative net long interest in platinum
futures as well as platinum in relation to gold and silver in both ounces and dollar size of the
market. With ETF ounce holdings at 1.25 million for the week ending May 31, it is clear that
any significant uptick in investment demand would affect platinum prices where annual
net platinum demand is just over 6 million ounces.
PLATINUM SPECULATIVE NET LONG AS A PERCENTAGE OF TOTAL(COMBINED) OPEN
INTEREST--WEEKLY DATA
3/95- 12/99- 12/04- 12/06- 12/08- 12/09- 12/04-12/07
HI 73.4% 73.4% 73.4% 72.1% 72.1% 72.1% 73.4%
LOW -35.4% -21.1% 5.3% 16.2% 32.2% 48.6% 5.3%
AVERAGE 34.6% 41.9% 49.9% 51.4% 55.1% 60.3% 47.9%
*Note: "-"=Current=May 31, 2011
Total(Combined) Size of
Open Interest Platinum Market Relative to
,000s oz. other Precious
Platinum 1,953.9 100.00%
Gold 71,585.8 2.73%
Silver 936,505.0 0.21%
© 2011 SOPA PIRANHA Market Commentary, Wolf Asset Management International. All Rights Reserved. 13Source: CFTC, NYMEX, Standard Bank
V. We turn now to the supply side. It is important to address the question of world platinum
reserves and supply as well. Generally speaking, platinum ‗reserves‘ and ‗resources‘ numbers
shown by mining companies are smaller numbers than ‗identified‘ reserves estimated by
geologists. Reserves and resources have been quantified in the short to medium term by
mining companies, and identified deposits are generally unproven given the high cost of doing
so, yet geological evidence suggests they do exist. There is little need for mining companies
to go through the expenditure to prove those reserves given current proven reserves are
sufficient for the near/medium term to meet world demand.
In a 2010 report by Johnson Matthey, R. Grant Cawthorn more closely examines the reserves
and resources of the Bushveld Igneous Complex of South Africa. Among the four largest
© 2011 SOPA PIRANHA Market Commentary, Wolf Asset Management International. All Rights Reserved. 14mining companies in the region a rounded number of 800 million ounces of platinum is being
reported with nearly half – or 350 million of those ounces - having already been mined with
most from depths of less than 1km. It is geologically assumed that approximately 200 million
ounces remained in the upper 1 km of mining area and 350 million ounces in the second km
(2010). As mentioned previously, the Bushveld contains approximately 80% of world
reserves. The easy reserves have been mined and while not infeasible to mine at depths of
greater than 2km, doing so will encounter both high temperatures and also serious rock stress
according to Cawthorn. Such depths would also increase mining costs and subsequently
the cost of platinum.
In a recent May 9, 2011 release of interim results, Lonmin PLC CEO Ian Farmer posits that
given current South African Rand (ZAR) strength and a ZAR/USD exchange rate of R6.91,
incentive prices to bring new platinum production online will need to be above $2,100/oz or
$2,185/oz on a weighted average. He further mentioned that nearly all brownfield and
greenfield projects need higher prices than today‗s levels. Some new generation deep shafts
could require even higher prices to take into account significant capex inflation over the last
few years (Source: Lonmin Interim Results May 9, 2011). Supply side increases in mining
costs due to ZAR strength, wage inflation and increasing safety standards are on the rise.
Recall that current price levels are near the $1,750/oz range.
Further possible disruptions to the supply chain in the near term may come from labor
negotiations which typically occur in during the South African winter months. Labor unrest,
protests and strikes have been obstacles to maintaining production levels in the past and are
typically tumultuous events. Canadian miner, Eastern Platinum, lost 17% of PGM production
in the first three months of 2011 due mainly to labor unrest. On May 24, 2011, Lonmin served
9,000 workers with letters of dismissal because they had disrupted operations since the prior
week. Wage inflation is a cost of doing business with the increasing strength of South
Africa‘s National Union of Mineworkers. The union is pushing for 14% wage increases this
year. Production disruptions both in the form of striking workers or those non-union sanctioned
mining protests are likely. We have already seen this with Lonmin‗s recent dismissal of 9,000
workers. An increasing number of safety stoppages subsequent to a 20% rise in year over
year mining deaths for the first months of 2011 could further disrupt supply. South Africa‘s
Department of Mineral Resources is stepping up safety monitoring and an increased level of
safety standards are a possible outcome of recent events.
Further possible speed bumps to the supply side of the equation come from ZAR strength as
mentioned previously. Also, increasing shaft depths with resulting higher capex requirements
and power disruptions lie ahead of us. South African state utility Eskom is struggling to keep
up with power demand and projects, and this will be the case for at least the next several
years until additional power plants come online. In early 2008, the grid practically
collapsed and forced mines and smelters to shut down for days costing billions in lost output.
In May of 2011, Eskom has already disrupted power supplies to BHP‘s aluminum smelters.
Electricity demand typically peaks in South Africa from June through August, the winter
months.
© 2011 SOPA PIRANHA Market Commentary, Wolf Asset Management International. All Rights Reserved. 15Zimbabwe‘s 2011 Indigenization and Empowerment Act signed into law in March 2011 is also
worthy of mention. Under the terms of the act, foreign miners have until June 2011 to show
how they will divest 51% of their ownership to black Zimbabweans. The act compels all
foreign and white-owned companies to sell 51% of their shareholdings to black Zimbabweans
within five years and applies to all companies with assets over $500,000 (Latham, Bloomberg).
Mugabe‘s recent legislation combined with his volatile regime will serve to discourage further
foreign investment in the mining sector. Supplies could be disrupted, though there is talk
of China coming in and making purchases for reserves in the $3-4bn range prior to Mugabe‘s
upcoming election. It is unclear how and whether the China deal will transpire but China is
certainly known to be a friend of Zimbabwe and Mugabe in the past.
What we can say is there is probably a significant supply disruption coming in the near to
medium term. We believe this will be the catalyst that draws the world‘s attention to
platinum.
Section Three—Parting Thoughts
While recent news and worries of global macro growth certainly merit close attention, generally
speaking, we believe that in the medium to longer term, both platinum itself and those
equities where the carrying cost of reserves is not fully appreciated, will prove to be
good value. While the events in Japan have certainly impacted auto production in the near
term, medium to longer term auto production should be higher and resulting platinum and
palladium demand should increase late in the year and early next year. With global
demand fundamentals strongly in place in the automotive sector, prices should benefit.
There are many factors that could disrupt near term supply of PGM which would be cause for
concern. There are also new demand centers which are increasing their long term trend, most
especially medical/biomedical uses which are less tied to macro growth. Increasingly stringent
emissions legislation coming down the road in the form of heavy duty and off-road legislation
should further boost demand as will any further increase in the use of fuel cell technology in
the form of stationary power systems. Increasing diesel engine market share will be especially
beneficial for platinum. It is also worth noting that the ratio of platinum to palladium from a
price perspective is near an all time low. This should prove beneficial for platinum after
palladium’s almost 100% price run up for 2010 as switching may take place with platinum‘s
superior efficiency characteristics in autocatalysts.
Overall, we feel the long term trend is in place and pent up demand as a result of near term
auto production problems puts risk to the upside. Watch for your catalyst and while you are
at it post a guard on your garage.
Mari Kooi and D‘Artagnan Balink
June 2011
© 2011 SOPA PIRANHA Market Commentary, Wolf Asset Management International. All Rights Reserved. 16You can also read