Generation of honeycomb discharge assisted by micro-hollow surface dielectric barrier discharge
←
→
Page content transcription
If your browser does not render page correctly, please read the page content below
Int. J. Plasma Environ. Sci. Technol. 15 (2021) e01003 (13pp)

 Regular Paper                                                                          DOI: 10.34343/ijpest.2021.15.e01003

Generation of honeycomb discharge assisted by micro-
     hollow surface dielectric barrier discharge
                                          Richard Cimerman, Karol Hensel*

                   Division of Environmental Physics, Faculty of Mathematics, Physics and Informatics,
                          Comenius University, Mlynská Dolina F2, 842 48, Bratislava, Slovakia

 * Corresponding author: hensel2@uniba.sk (Karol Hensel)

 Received: 19 January 2021
 Revised: 20 February 2021
 Accepted: 23 February 2021
 Published online: 25 February 2021

Abstract
The combination of nonthermal plasma with honeycomb catalysts still represents one of the major challenges in plasma
catalysis from the technological point of view. The objective of this paper was to investigate a generation of stable
discharge inside the channels of honeycomb catalyst (honeycomb discharge) with the assistance of micro-hollow surface
dielectric barrier discharge generated by a perforated ceramic substrate. The surface discharge driven by AC high voltage
served as a source of nonthermal plasma and was coupled in series with DC high voltage applied across the honeycomb
channels. The honeycomb catalyst was emulated by a bundle of glass capillary tubes that enabled optical emission
spectroscopy of the discharge. We investigated the effect of applied AC and DC high voltages, air flow rate and relative
humidity on stability and light emission intensity of the honeycomb discharge. We found that generation of honeycomb
discharge is positively supported by an increase of air flow rate as well as air relative humidity. A chemical activity of
the honeycomb discharge in terms of ozone O3 production was also briefly examined. The results showed that O3
concentration increased with an increase of amplitude of both AC and DC high voltages and was found higher for positive
than for negative polarity of DC high voltage.

Keywords: Honeycomb catalyst, honeycomb discharge, micro-hollow surface dielectric barrier discharge, capillary
          discharge, optical emission spectroscopy.

1. Introduction

   Plasma catalysis provides a beneficial combination of nonthermal plasma (NTP) with catalysis that has
many potential applications. Environmental applications of air and water pollution control [1–5] benefit from
the combination of plasma with catalysis as it is often characterised by synergistic effects resulting in enhanced
efficiency of the process [6–9]. Nevertheless, plasma catalysis is still facing significant challenges in scalability,
energy efficiency, catalyst lifetime, understanding of surface processes, etc. In particular, the combination of
NTP with a honeycomb catalyst represents one of the major challenges in plasma catalysis from the
technological point of view. The honeycomb catalysts are of great importance in heterogeneous catalysis, as
they provide high surface-to-volume ratio, low pressure drop and high mass and heat transfer [10]. Moreover,
they are also employed in automotive catalytic converters for exhaust gas cleaning (oxidation of volatile
organic compounds VOCs and polycyclic aromatic hydrocarbons PAHs, oxidation of carbon monoxide CO
and reduction of nitrogen oxides NOx). However, their high activity is achieved only at elevated temperatures
(> 300 °C) [11, 12] what limits their efficiency especially during winter months. Other drawbacks of
automotive catalytic converters are limited lifetime in real conditions due to catalyst poisoning and
impossibility of NOx reduction in strong oxidative environments (i.e. diesel exhaust gases). To overcome these
drawbacks, it is necessary to search and investigate new methods, such as their coupling with the NTP. It seems
to be a promising idea, as it allows for low-temperature activation of honeycomb catalysts as well as their
lifetime enhancement.
   However, the combination of the NTP with honeycomb catalysts is still far from a practical use because of
the difficulty of stable discharge generation inside their long and narrow channels. Formation of a discharge

                                                                1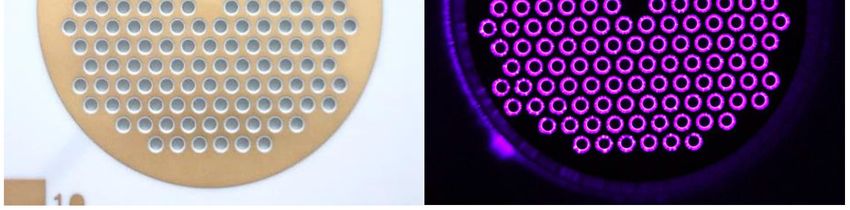
Int. J. Plasma Environ. Sci. Technol. 15 (2021) e01003                                           R. Cimerman et al.

in such geometry requires high ignition voltages due to losses of charged particles by interaction with the
channel walls [13]. Moreover, the discharge is often unstable and associated with frequent sparking that is
undesired due to possible mechanical damage of ceramic honeycomb monolith and also with a respect to some
applications [14]. In the recent years, the research in this area has progressed significantly both in the terms of
numerical simulations as well as experimental investigations.
   For numerical simulations, fluid or particle-in-cell/Monte Carlo collision models have been applied. Jánsky
et al. simulated a propagation of atmospheric pressure air discharge initiated at a needle anode inside a
dielectric capillary tube which emulated a single channel of honeycomb catalyst [15]. They studied the effect
of relative permittivity and inner radius of the capillary tube on the discharge structure and dynamics. They
found that discharge propagation velocity increases with the decrease of both the tube radius and relative
permittivity. In addition, Jánsky et al. also performed a comparative study of their results from numerical
modelling with the experimental results [16]. They reported a maximum discharge velocity in the tube with
radius less than 100 μm which was 3–4 times higher than the velocity obtained without a tube. Hence, a
confinement of the discharge in the tube showed significant change of the discharge dynamics, although
interaction between the plasma and dielectrics (i.e. catalyst support) was not examined. This interaction was
investigated by Zhang and Bogaerts who simulated the discharge propagation in honeycomb-like structures
[17]. Their simulations showed that the place where the discharge initiates significantly affects its dynamics
as it affects the plasma (i.e. electron) density. They found the discharge being much more enhanced when it
initiates at the dielectric surface than at the centre of honeycomb channel (capillary tube). This can be explained
by the surface charging process which plays a crucial role in discharge generation and propagation in confined
geometry of honeycomb channels. The charging of walls of the channels creates additional electric field along
their surface which sums up with applied (external) electric field. The enhanced total electric field pushes the
electrons in the direction of discharge propagation resulting in a higher electron density and, thus, discharge
enhancement.
   In addition to numerical simulations, many experimental investigations have been performed in various
geometrical configurations. The first approach utilises a single high voltage (HV) power supply to generate
the discharge inside the channels of honeycomb catalyst, i.e. honeycomb discharge [18–23]. Kim used two
different systems: the first one was based on inserting the wire electrodes inside the honeycomb channels
alternatively powered by HV or grounded, while the second one utilised several smaller elements (slices) of
honeycomb catalyst with mesh electrodes placed in parallel between them [22]. Despite promising results for
removal of NOx, the systems were characterised by unstable discharge and frequent sparking. Similar approach
was utilised by Nguyen et al., Saud et al. and Hossain et al., who placed a honeycomb catalyst between two
perforated electrodes, one powered by AC HV and the other one grounded [23–25]. They reported a generation
of stable corona discharge of relatively large volume inside the channels of honeycomb catalyst. Shimizu et al.
and Rajanikanth et al. utilised the dielectric barrier discharge (DBD) of cylindrical geometry inside glass tube
equipped with a small honeycomb catalyst [18, 26]. The discharge was generated in a coaxial geometry by
application of HV to the electrode placed inside the tube (in its axis), while the other electrode was wrapped
around the tube and grounded. Both groups investigated these systems in NOx removal process, however, the
detailed physical characteristics of the generated discharge are missing. Moreover, Ayrault et al. and Blin-
Simiand et al. generated the DBD in a plane-to-plane geometry in a slice of honeycomb catalyst, applied it for
2-heptanone removal process and visualised the discharge propagation perpendicularly to the axis of
honeycomb channels using a CCD camera [19, 20]. The authors reported that a development of plasma
filaments was randomly distributed inside the honeycomb channels following streamers propagation crossing
the channels walls or along their surface. Finally, a regeneration of diesel particulate filter of honeycomb shape
was also investigated by Graupner et al. using the pulsed discharge generated by a set of electrodes inserted
inside the filter channels from both sides [21].
   The second approach for generation of honeycomb discharge utilises the idea of the assistance of another
discharge [14, 27–35]. In these works, the auxiliary discharge (particularly DBD) was set/coupled in series
with a honeycomb monolith. Firstly, the plasma of auxiliary discharge was generated at one nozzle end of the
honeycomb monolith. Then, the DC electric field was applied across the monolith, so the generated plasma
was extended into the honeycomb channels. It should be noted that in order to simplify the problem, instead
of using a real honeycomb ceramic monolith, many authors used a bundle of glass capillary tubes that emulated
its shape [14, 27–29, 31, 34, 35]. This enabled visual observation and optical diagnostics of generated
honeycomb discharge.

                                                         2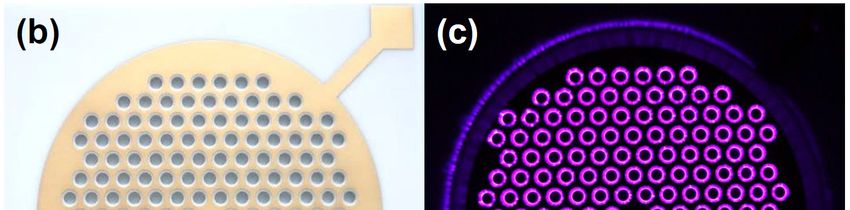
Int. J. Plasma Environ. Sci. Technol. 15 (2021) e01003 R. Cimerman et al.
One of the most studied configurations of honeycomb discharge generation utilised a pellet bed DBD [14,
29–31, 35]. Hensel et al. and Sato et al. generated the honeycomb discharge with the assistance of pellet bed
DBD using glass capillary tubes of 20 and 30 mm in length and 1 and 2 mm in diameter and performed its
electrical and optical characterisation [14, 29, 31]. Takashima et al. studied the effect of air humidity and
temperature on honeycomb discharge generation and properties and found their positive effect on discharge
stability [35]. The chemical activity of the honeycomb discharge assisted by pellet bed DBD was investigated
by Sato & Mizuno [30]. They studied NOx removal in the selective catalytic reduction (SCR) process using
Fe-zeolite-supported honeycomb catalyst and NH3 as a reduction agent. In addition to a pellet bed DBD,
various types of surface dielectric barrier discharges (SDBDs) were also employed as auxiliary discharges for
honeycomb discharge generation [27, 28, 36]. Hensel et al. used a diffuse coplanar surface barrier discharge
(DCSBD) with both electrodes embedded inside the Al2O3 ceramics [28, 36]. Mizuno utilised a micro-hollow
SDBD generated by a perforated ceramic substrate consisting of one electrode printed on the ceramic surface
and the other one embedded inside the ceramic [27]. Furthermore, Takashima et al. reported honeycomb
discharge generation by using two ceramic substrates generating the micro-hollow SDBD placed at the
opposite nozzle ends of a bundle of glass capillary tubes [35]. In addition, the applications of honeycomb
discharge generated with the assistance of SDBDs have been studied, too. Seiyama et al. and Mizuno &
Takashima studied the utilisation of honeycomb discharge for regeneration of diesel particulate filter of
honeycomb shape [33, 34].
The works mentioned above demonstrated and described the possibility of plasma generation inside the
honeycomb catalyst by using various discharge geometries. The authors demonstrated that a common system
of plasma and honeycomb catalyst can be successfully used, although there are still issues that must be resolved
and improved. One of them is that the total volume of generated plasma is often unknown, i.e. it is not clear
whether the plasma can be generated inside every channel of honeycomb catalyst or only inside some of them.
Another uncertainty comes with a lack of data of discharge stability: many authors did not clearly report
whether the honeycomb discharge was operated in a stable streamer mode (regime) or in an unstable spark
mode, what is crucial in respect to eventual applications. In addition, many studies focused only on a particular
application of the honeycomb discharge without presenting detailed electrical and optical characterisation of
the generated discharge. Therefore, underlying mechanisms of honeycomb discharge generation are still not
yet fully resolved and require further research.
The objective of this paper is to build on our previous works [14, 28, 29, 31, 36] and the works of other
authors from recent years and to further investigate alternative methods of honeycomb discharge generation
and its basic electrical and optical properties. More specifically, the honeycomb discharge generation was
investigated with an assistance of the micro-hollow SDBD generated by a perforated ceramic substrate in
configuration with the air-exposed electrode. The honeycomb shape was emulated by a bundle of glass
capillary tubes. The effects of the applied voltage, air relative humidity and air flow rate were studied on
electrical and optical characteristics of generated discharge. Moreover, the effect of the polarity of DC HV
applied across the capillary tubes was investigated on quality (stability) and homogeneity of the honeycomb
discharge. Finally, plasma chemical effects of the discharge were briefly examined and evaluated in terms of
ozone O3 production.
A substitution of a ceramic honeycomb monolith by a glass capillary tubes was made to visually observe
the discharge inside the tubes and to perform its optical diagnostics. A choice of a material affects the electrical
and optical properties of the discharge as well as the chemical effects of the discharge, therefore the results
obtained with glass capillary tubes may be slightly different that would be those in a ceramic honeycomb
monolith. This is a very important issue to consider with respect to eventual applications and system
optimisation, although in the presented study and at this early stage of the research this issue has not been
explicitly addressed.
2. Methods
The experimental setup is depicted in Fig. 1 (a). The micro-hollow SDBD served as an auxiliary (assisting)
discharge and was generated by a perforated ceramic substrate (KD-EB2B10, Kyocera) with the dimensions
of 50 50 1 mm and perforated by 170 holes with an inner diameter of 1.5 mm (Fig. 1 (b, c)). The electrodes
were made of Ni/Au alloy; one was embedded inside the ceramic and the other one was printed on the ceramic
surface (air-exposed electrode).
3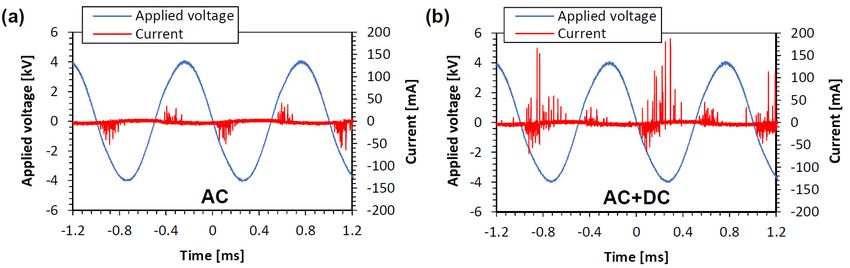
Int. J. Plasma Environ. Sci. Technol. 15 (2021) e01003 R. Cimerman et al.
Fig. 1. (a) Experimental setup and photographs of the (b) perforated ceramic substrate and
(c) micro-hollow SDBD [Exposure time 3 s, f/5.6, ISO 400].
The substrate was powered by AC HV power supply consisting of a function generator (GwInstek SFG-
1013), signal amplifier (Omnitronic PAP-350) and high voltage transformer. The micro-hollow SDBD was
generated by applying AC HV to the air-exposed electrode, while the other one was grounded. The maximum
amplitude of the applied voltage was 3–6 kV (i.e. 6–12 kVpk-pk) and a frequency was 1 kHz. The bundle of
glass capillary tubes made of borosilicate glass was placed inside the quartz glass tube perpendicularly to the
ceramic substrate on the top of air-exposed electrode, while a metal mesh serving as a remote electrode was
placed on the top of capillary tubes and connected to a DC HV power supply (Technix SR20-R-1200) through
ballasting resistors (9.4 MΩ). The bundle consisted of 48 capillary tubes (Ø 2.8 mm (i. d.) Ø 4 mm (o. d.)
20 mm (length)). The waveforms of the applied AC and DC voltages were measured by HV probes (Tektronix
P6015A) and the discharge current was measured by a current probe (Pearson Electronics 2877) connected to
a digital oscilloscope (Tektronix TBS2000). The power consumption of the micro-hollow SDBD was
evaluated using the Lissajous figure method with an 82 nF capacitor and a voltage probe (Tektronix P2220).
The power consumption corresponding to pulsed current component of the honeycomb discharge was
estimated from the recorded current waveforms by calculating an area enclosed by current pulses, each of them
sampled with a sufficient number of data points. An optical emission spectroscopy (OES) system consisted of
dual-fibre optic spectrometer (Ocean Optics SD2000), optic fibre, two diaphragms, parabolic mirror and
cylindrical lens. The OES system was adjusted to collect light signal from a plane perpendicular to the axis of
4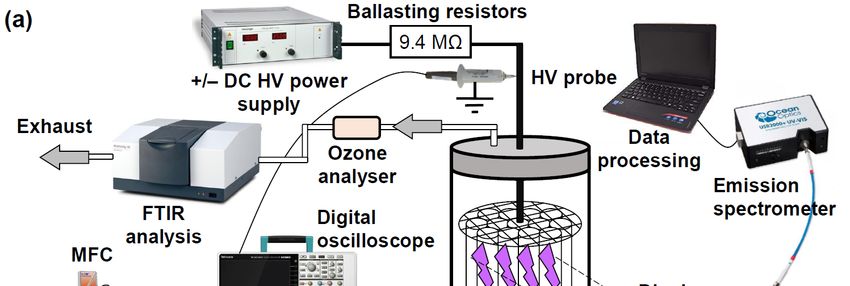
Int. J. Plasma Environ. Sci. Technol. 15 (2021) e01003 R. Cimerman et al.
capillary tubes approximately 3 mm below the top of the tubes. This enabled to collect light emitted by the
honeycomb discharge formed in several capillary tubes integrated over 8 s. Photographs of the discharge were
taken with a digital camera (Sony Alpha DSLR-A230) with manually adjustable aperture and exposure. Dry
synthetic air (purity 5.0) supplied from a pressure tank was used as the carrier gas and its flow rate (0.5, 1 and
2.4 L min−1) was controlled by mass flow controllers (MFC) (Bronkhorst El-Flow Prestige FG-201CV). The
air was alternatively enriched with water vapours by passing it through a water cell. The air relative humidity
(RH) was monitored (0–80%) by an electrochemical probe (Arduino). Then the air was led into the reactor
from the bottom side of the ceramic substrate, it passed through the perforated substrate, then capillary tubes
and, finally, it exited the reactor. Chemical effects induced by the discharge in the gas phase, i.e. production
of ozone O3, nitrous oxide N2O and nitric acid HNO3, were evaluated by means of FTIR spectroscopy
(Shimadzu IR-Affinity 1S) using a 10 cm gas cell equipped with CaF2 windows. Ozone production was also
evaluated by a homemade ozone analyser based on UV absorption at 254 nm.
3. Results and discussion
3.1 Discharge characterisation
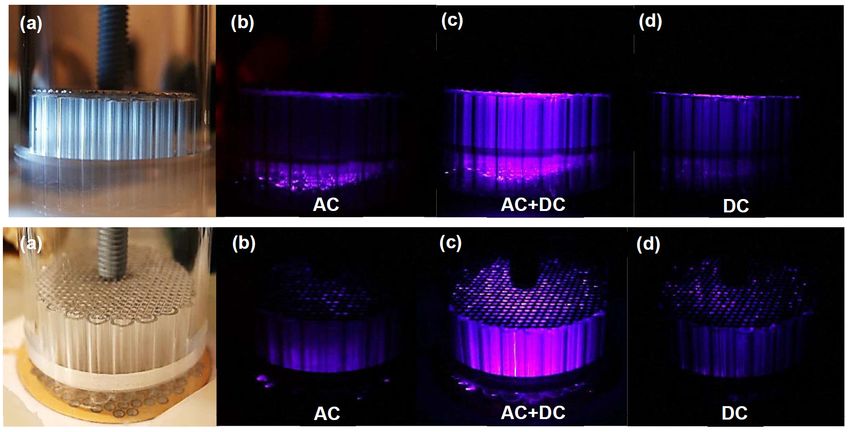
Fig. 2 shows side and perspective view of the reactor with ceramic substrate and bundle of glass capillary tubes
in different conditions: (a) without any applied HV; (b) with only AC HV applied, (c) with both AC and DC
HVs applied, and (d) with only DC HV applied. When only AC HV was used, the light was emitted only by
the auxiliary micro-hollow SDBD at the bottom of the reactor (Fig. 2 (b)). When both AC and DC HVs were
applied, the streamers occurred and propagated inside the capillary tubes and formed homogeneous
honeycomb discharge (Fig. 2 (c)). When only DC HV without the assistance of the surface discharge was
applied, the honeycomb discharge did not form. Light was emitted only by a corona discharge generated in the
vicinity of the DC powered mesh electrode (Fig. 2 (d)). Based on these observations we might conclude that
generation of stable and homogeneous streamer discharge inside glass capillary tubes benefits from an
assistance of the auxiliary micro-hollow SDBD and application of DC HV applied across the tubes. The
mechanism governing honeycomb discharge generation can be explained by a superposition of the AC
powered surface discharge and the DC powered corona discharge. The first one serves as an ioniser producing
charged particles while the latter one produces and maintains ionic wind toward the DC electrode, thus forming
streamers inside the capillary tubes [14].
Fig. 2. The ceramic substrate with glass capillary tubes – side and perspective view: (a)
without discharge; (b) with applied AC HV only (amplitude 4 kV at 1 kHz); (c) with applied
both AC and DC HVs (4 kV at 1 kHz; +14 kV, respectively); (d) with applied DC HV only
(+14 kV) (RH ~ 60%; 2.4 L min−1) [Exposure time 8 s, f/5.6, ISO 400].
5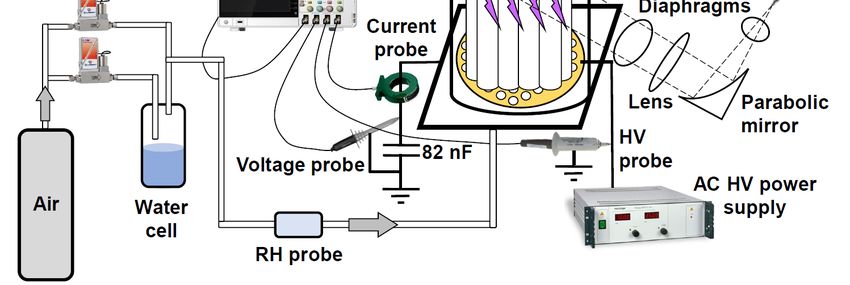
Int. J. Plasma Environ. Sci. Technol. 15 (2021) e01003                                           R. Cimerman et al.

   Fig. 3 shows a comparison of voltage and current waveforms of micro-hollow SDBD and honeycomb
discharge for positive polarity of DC HV. The waveform of micro-hollow SDBD contains a typical DBD
current record (Fig. 3 (a)). However, when a positive DC HV was applied to the remote mesh electrode,
relatively high current pulses with amplitudes up to 200 mA occurred in the current waveform (Fig. 3 (b)).
These pulses were attributed to the honeycomb discharge formed inside the capillary tubes. When positive DC
HV was used, the current pulses of honeycomb discharge appeared only during the negative half-period of the
applied AC HV. On the contrary, with negative DC HV the pulses were observed only during the positive half-
period of the applied AC HV. Explanation can be given as follows: the pulses, i.e. honeycomb discharge,
appeared when an electric field strength applied across the capillary tubes reached the highest values. In a case
of positive DC HV, it happens at the peak voltage during the negative half-period of the applied AC HV, and
vice-versa. Thus, the voltage across the capillary tubes was changing in time with a frequency of the AC HV
(e.g. for DC amplitude +16 kV and AC amplitude 4 kV, the net voltage applied across the capillary tubes
changed in a range of 12–20 kV). The DC corona discharge that developed within this range of the applied
voltages passed through several discharge modes, some of them being pulsed (streamer mode corresponding
to current pulses visible on the waveform in Fig. 3 (b)), other being unipolar (glow mode). The transition
between the modes happened during each period of the applied AC HV. To evaluate the honeycomb discharge
power consisting of the power of SDBD and the power induced by DC HV, one must measure both pulsed and
unipolar (continuous) components of the discharge current. Although we did not measure the unipolar
component of the current, we tried at least to estimate the power consumption corresponding to pulsed current
component from the recorded current waveforms. The power was found higher for positive than negative
polarity of DC HV and the maximum values were in a range of 0.4–0.6 W (+DC, RH 60%, 2.4 L min−1). For
a comparison, the power of micro-hollow SDBD was in a range of 0.3–4.3 W depending on the amplitude of
AC HV in a range of 3–6 kV, respectively. Therefore, we can hypothesize that the total power of honeycomb
discharge is probably not higher than 10 W.

               Fig. 3. Voltage and current waveforms of (a) micro-hollow SDBD (AC HV amplitude 4 kV
               at 1 kHz; ~ 1.8 W) in comparison with (b) honeycomb discharge (AC HV amplitude 4 kV at
               1 kHz; DC HV +16 kV; RH ~ 60%; 2.4 L min−1).

3.2 The effect of the air flow rate

Evaluation of the honeycomb discharge quality (stability, homogeneity) was performed by measuring its light
emission intensity in various conditions. In the measured emission spectra, N2 second positive system was
dominant. As the capillary tubes were made of borosilicate glass, strong attenuation of the light emission
intensity occurred below 350 nm. For this reason, the discharge emission intensity was further evaluated based
on the 0–1 spectral band (357 nm) of N2 second positive system instead of 0–0 spectral band (337 nm).
   In general, a higher signal of integrated emission intensity corresponds to higher number of stable discharges
maintained in the streamer discharge mode. Possible instability of the discharge is associated with a transition
from the streamer to the spark mode, what is usually undesirable. The emission intensity is also a measure of
discharge activity, i.e. concentration of reactive species generated by the discharge. Hensel investigated the
configuration with an auxiliary pellet bed DBD and reported an excessive sparking when operating honeycomb
discharge in dry gas mixtures [14]. He further reported that the streamer-like behaviour of the discharge was

                                                         6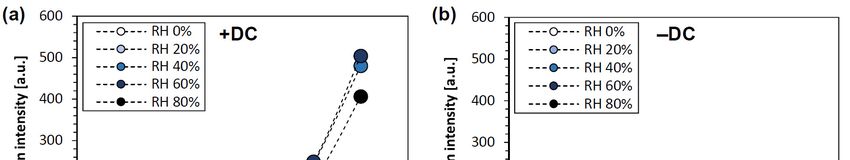
Int. J. Plasma Environ. Sci. Technol. 15 (2021) e01003                                                R. Cimerman et al.

supported with an increase of the gas humidity, but details of discharge behaviour with a gas humidity were
not examined. Therefore, we investigated the effect of air RH on stability and quality of honeycomb discharge.
Besides, the effects of air flow rate and polarity of applied DC HV were also examined.
   Fig. 4 shows light emission intensity of the honeycomb discharge as a function of amplitude of applied DC
HV (11–16 kV) for various air flow rates and both DC HV polarities. When amplitude of AC HV was set to 4
kV, the honeycomb discharge started to occur for DC HV amplitudes in a range of 12–14 kV (i.e. ignition
voltage). Then, an average ignition electric field strength for honeycomb discharge generation was found to be
in a range of 8–9 kV/cm which is slightly lower than 10 kV/cm reported by Sato et al. who used the assistance
of pellet bed DBD [29]. The maximum amplitude of DC HV (i.e. sparking voltage) was found to be in a range
of 16–17 kV. When this value was exceeded, a permanent sparking inside the capillary tubes occurred. From
the ignition to the sparking voltage (i.e. in a range of 12–16 kV), the discharge was maintained in a stable
streamer discharge mode. Fig. 4 further shows an increase of light emission intensity of the honeycomb
discharge with an increase of air flow rate. Thus, the air flow rate positively supported the honeycomb
discharge generation and this effect was stronger for positive polarity of DC HV.
   The air residence time inside the capillary tubes was 0.74, 0.37 and 0.15 s corresponding to air flow rate of
0.5, 1 and 2.4 L min−1, respectively. Due to different time scales of the mechanisms of discharge formation (ps
to μs) and gas flow dynamics (ms to s), the gas flow cannot directly affect an ignition and propagation of
individual discharge filaments [37]. However, it can affect the conditions prior to the ignition by changing the
level of pre-ionisation what may subsequently affect the ignition voltage or peak current [37]. Indeed, the
effect of gas flow rate on discharge dynamics is particularly important for plasma jets [38–40]. In our
configuration, the air flow passed first through the perforated ceramic substrate and then through the capillary
tubes. Thus, the air flow enhanced a transport of charged particles from the surface “seeding” discharge into
the tubes. Consequently, a higher air flow rate resulted in higher number of seeding particles inside the
capillary tubes what enhanced a honeycomb discharge generation and its emission intensity. The effect of the
air flow on honeycomb discharge was also studied by Nguyen et al. and they reported an increase in the
discharge current with an increase of the air flow rate [23]. Similarly, Saud et al. reported a gas flow rate as
one of the key parameters affecting the honeycomb discharge performance [24].

               Fig. 4. Emission intensity of the honeycomb discharge as a function of applied (a) positive
               and (b) negative DC HV for various air flow rates (AC HV amplitude 4 kV at 1 kHz; RH ~
               55%).

3.3 The effect of the air relative humidity

In addition to the air flow, the positive effect on the honeycomb discharge quality was also observed with the
increase of the air RH. When dry air was used as a carrier gas, the auxiliary micro-hollow SDBD showed the
highest stability and light emission intensity. On the contrary, in dry air the honeycomb discharge did not form
at all regardless of air flow rate and amplitude and polarity of the DC HV. When the air RH was increased, the
honeycomb discharge in capillary tubes started to form and its higher emission intensity was always observed
when using positive DC HV. On the contrary, when negative DC HV was applied, the honeycomb discharge
was less stable and sparking voltage was found to be slightly lower (~15–16 kV). Therefore, we hypothesise,
the positive DC HV caused that negatively charged electrons produced by the micro-hollow SDBD were

                                                           7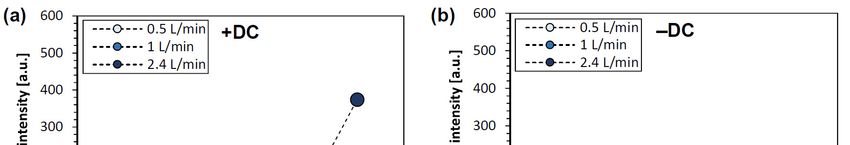
Int. J. Plasma Environ. Sci. Technol. 15 (2021) e01003                                                R. Cimerman et al.

intensively driven into the capillary tubes what in turn resulted in more efficient discharge formation inside
them and, thus, higher discharge emission intensity. The effect of polarity of DC HV was also tested by Hensel
using an auxiliary pellet bed DBD [14]. Even though he did not compare an emission intensity of the discharge
for both DC HV polarities, he observed a bigger range between ignition and sparking voltage for stable
discharge operation without sparking for negative polarity. However, this effect was not observed in our
experiment.
   Fig. 5 shows light emission intensity of the honeycomb discharge as a function of amplitude of DC HV and
various air RHs. For positive DC HV, the emission intensity increased with an increase of air RH from 0 to
60% and subsequently with further increase of air RH to 80%, it decreased below values with air RH of 40 and
60% (Fig. 5 (a)). On the contrary, when negative DC HV was used, the emission intensity monotonously
increased with air RH from 0 to 80% (Fig. 5 (b)). However, the overall emission intensity of the discharge was
lower with negative than positive DC HV. In general, the humidity has a substantial effect on electric
discharges as it affects a distribution of electric field [41, 42], a mobility of charge carriers [43], plasma
chemistry [44], etc. Its exact effect also depends on working conditions (composition of gas mixture, gas
pressure, etc.) and the type of electric discharge. Therefore, the humidity effect is generally very complex and
must be investigated carefully with respect to other working conditions. In our case we hypothesise that
enhancement of honeycomb discharge formation with increasing air RH may be attributed to an enhancement
of surface electrical conductivity of glass capillary tubes. As already mentioned, when a discharge is initiated
along the capillary tubes surface, its propagation is enhanced due to surface charging phenomenon [17]. The
discharge propagation along the capillary tubes surface could be further enhanced as a result of enhanced
surface electrical conductivity provided by water adsorption onto capillary tubes surface. Such explanation
was also given by Nguyen et al. [23]. Our hypothesis is further supported by findings of Falkenstein and
Coogan who investigated a behaviour of DBD microdischarges in humid air mixtures [45]. They reported that
a dominant effect of air humidity on DBD is not the electronegativity of water molecules, but rather its
influence on surface resistance of the dielectric. In the presence of water vapours in air, the water molecules
can adsorb onto dielectric, thus reduce surface dielectric resistance, and increase the effective dielectric
capacity. Consequently, the authors reported that the discharge spread over a wider area when humid air was
used. In addition to the effect of water adsorption, the type of material of capillary tubes may also affect the
discharge propagation. As it is well known, the use of various materials in the reactor can induce substantial
changes in equivalent electrical circuits, what may further influence the discharge characteristics, formation,
and propagation and also its chemical activity [46]. Thus, this point must be considered especially in case when
glass capillary tubes are replaced with other materials, for example ceramic honeycomb monolith.
   An influence of air RH on honeycomb discharge generation assisted by pellet bed DBD was also studied by
Takashima et al. [35]. They also reported a positive role of air humidity on the discharge generation and
stability: below air RH of 30%, the discharge did not form, while above 30%, a stable DC voltage region
increased with an increase of air humidity regardless of DC HV polarity. This observation approximately
corresponds to our findings.

               Fig. 5. Emission intensity of the honeycomb discharge as a function of applied (a) positive
               and (b) negative DC HV at various air RHs (AC HV amplitude 4 kV at 1 kHz; 2.4 L min−1).

                                                           8
Int. J. Plasma Environ. Sci. Technol. 15 (2021) e01003 R. Cimerman et al.
3.4 Chemical activity
A brief evaluation of honeycomb discharge chemical activity in terms of various reactive species production
(O3, N2O, NO, NO2, HNO3) was carried out by FTIR spectroscopy. Fig. 6 shows the infrared absorption
spectrum of gaseous products of the honeycomb discharge in air with RH of 40%. In the spectrum, we
positively identified ozone O3 (1055 and 2125 cm−1), nitrous oxide N2O (2236 cm−1) and nitric acid HNO3
(1325 and 1711 cm−1) whose concentrations increased with an increase of amplitudes of both AC and DC HVs
and reached maximum levels of approx. 320 ppm, 10 ppm and 40 ppm, respectively. The O3 is formed by a
reaction of O radicals with O2 molecules, whereas N2O production depends on a presence of nitrogen and
oxygen species, such as N2 (A), N(2D), N and O(1D) [46–51]. While O3 and N2O represent basic gaseous
products of atmospheric pressure air electric discharges in general, HNO3 represents the highest oxidation level
of nitrogen oxides NOx produced by the discharge. Basically, it is formed in a presence of water molecules in
air via gradual oxidation of NOx by O, OH and HO2 radicals or eventually by H2O2 [53]. On the other hand,
nitric oxide NO and nitrogen dioxide NO2 were not detected in the spectra at all implying their fast oxidation
towards HNO3.
Fig. 6. Infrared absorption spectrum of gaseous products of the honeycomb discharge in air
(AC HV amplitude 5 kV at 1 kHz; ~ 2.9 W; DC +17 kV; RH ~ 40%; 2.4 L min−1).
A production of O3 was further evaluated by means of absorption analyser (at 254 nm) as a function of
applied AC and positive DC HV amplitudes and air RHs. Fig. 7 compares O3 concentration obtained with
various discharge regimes: (a) when AC HV was applied (amplitude 3–5 kV at 1 kHz) without application of
DC HV (0 kV), the O3 production relates to the auxiliary micro-hollow SDBD; (b) when both AC and positive
DC HV were applied (amplitude 3–5 kV at 1 kHz, 13–17 kV, respectively), the O3 production relates to a
combination of surface and honeycomb discharge; (c) when only positive DC HV was applied (13–17 kV),
the O3 production relates to a corona discharge generated in a vicinity of the remote mesh electrode. As it is
generally known, the O3 production decreases with an increase of air RH. It can be attributed to higher
consumption of O radicals via reaction with H2O molecules or HO2 and OH radicals [49, 53]. As O radicals
are essential for O3 production, their loss leads to lower O3 production. Further, a decomposition of O3 is also
different for dry and humid air: while in dry air the main O3 decomposition pathway is governed by NO, in
humid air it is primarily by OH radicals [44]. However, our results showed that for AC HV amplitude of 5 kV,
the O3 production was slightly higher at RH of 60% than at RH of 40% (Fig. 7). It is due to the fact described
in section 3.3 that at higher air RH, the honeycomb discharge is more enhanced, stable, and intense, leading to
higher O3 production. Note that the error bars in Fig. 7 represent standard deviations of the data.
Further, O3 production increased with amplitude of DC HV and it was always higher when both AC and DC
HVs were applied than when AC HV was used alone. Indeed, the honeycomb discharge was formed inside the
capillary tubes only upon application of both AC and DC HVs. The honeycomb discharge is characterised by
a higher chemical activity than auxiliary micro-hollow SDBD alone due to a larger volume of generated plasma
and, thus, higher O3 production. A comparison of O3 production by honeycomb discharge for both DC HV
polarities was also examined and showed a higher O3 production for positive polarity. Pekárek and also Abdel-
Salam et al. studied the effect of polarity of DC streamer corona discharge on O3 production and reported
higher O3 concentration for positive polarity [54, 55]. The same effect was also experimentally investigated
9Int. J. Plasma Environ. Sci. Technol. 15 (2021) e01003 R. Cimerman et al.
by Brandvold et al. and by numerical modelling by Chen and Davidson, however, they reported the opposite
results with higher O3 production for negative polarity [56, 57]. Therefore, the dependence of O3 production
on polarity of applied DC HV is not straightforward as it generally depends on several factors, including
discharge current, size of plasma region, distribution and density of electrons, gas temperature and gas flow
rate [54–56, 58]. Moreover, the discharge mode (regime) seems to be one of the critical parameters determining
O3 production by positive and negative DC corona discharges: in a glow mode, a negative corona discharge
produces more O3 than a positive corona discharge. The situation is reversed in a streamer discharge mode,
when higher O3 production was reported with a positive corona discharge [60]. This fact can explain the
observed higher O3 production by using positive DC HV, as the honeycomb discharge in our study was
maintained in a stable streamer mode.
Fig. 7. Concentration of O3 produced by auxiliary micro-hollow SDBD (when DC HV = 0
kV) and honeycomb discharge as a function of various combinations of applied AC and
positive DC HV amplitudes and various air RHs (2.4 L min−1).
4. Conclusion
The combination of nonthermal plasma with honeycomb catalysts is a very promising method for the
environmental applications particularly for gas cleaning applications. However, a coupling of the plasma with
honeycomb catalysts still represents one of the major challenges in plasma catalysis. The presented research
was built on our previous works and the works of other authors and its objective was to further investigate
electrical, optical, and chemical properties of honeycomb discharge and to find its optimal operating conditions.
Our results demonstrated that generation and sustaining a stable discharge inside the honeycomb catalyst
emulated by a bundle of glass capillary tubes is possible with an assistance of surface barrier discharge coupled
in series with DC electric field applied across the tubes. The auxiliary micro-hollow surface dielectric barrier
discharge (SDBD) was generated by a perforated ceramic substrate. A bundle of capillary tubes was placed
perpendicularly on the ceramic substrate and DC high voltage (HV) was applied to a remote mesh electrode
placed at the other nozzle ends of the tubes. Then, DC electric field extended plasma streamers formed by the
auxiliary micro-hollow SDBD into the capillary tubes what resulted in honeycomb discharge generation.
The results showed that the honeycomb discharge did not form in dry air. Its stability as well as light
emission intensity was positively supported by an increase of both air flow rate and air relative humidity. We
consider that air flow supported a transport of charged particles from the surface barrier discharge into the
capillary tubes and, thus, pre-ionisation processes, while humidity supported an enhancement of surface
electrical conductivity of the glass capillary tubes and, thus, honeycomb discharge generation. Furthermore,
light emission intensity of the discharge was higher for positive DC HV when comparing to negative DC HV.
A brief evaluation of chemical activity of the honeycomb discharge in terms of particularly ozone O3
production was also carried out. It showed that O3 concentration increased with an increase of amplitude of
both AC and DC HVs and was higher for positive than for negative polarity of DC HV.
10Int. J. Plasma Environ. Sci. Technol. 15 (2021) e01003 R. Cimerman et al.
Finally, we may conclude that our work may serve as a good starting point for future experimental
investigations in real ceramic monoliths. Here the generated plasma pattern and its chemical activity can be
slightly different than the plasma in the glass capillary tubes. Under a proper design the plasma activity can be
further enhanced and if successfully scaled-up it may become of a huge interest with a respect to the practical
applications.
Acknowledgment
This research was funded by Slovak Research and Development Agency grant APVV-17-0382, Slovak Grant
Agency VEGA 1/0822/21 and Comenius University grant UK/222/2020.
References
[1] Magureanu M., Bradu C., and Parvulescu V. I., Plasma processes for the treatment of water contaminated with
harmful organic compounds, J. Phys. D. Appl. Phys., Vol. 51 (31), pp. 313002, 2018.
[2] Parvulescu V. I., Magureanu M., and Lukeš P., Plasma Chemistry and Catalysis in Gases and Liquids. Wiley-
VCH Verlag GmbH and Co., 2012.
[3] Van Durme J., Dewulf J., Leys C., and Van Langenhove H., Combining non-thermal plasma with heterogeneous
catalysis in waste gas treatment: A review, Appl. Catal. B Environ., Vol. 78 (3–4), pp. 324–333, 2008.
[4] Vandenbroucke A. M., Morent R., De Geyter N., and Leys C., Non-thermal plasmas for non-catalytic and
catalytic VOC abatement, J. Hazard. Mater., Vol. 195, pp. 30–54, 2011.
[5] Whitehead J. C., Plasma catalysis: A solution for environmental problems, Pure Appl. Chem., Vol. 82 (6), pp.
1329–1336, 2010.
[6] Whitehead J. C., Plasma-catalysis: The known knowns, the known unknowns and the unknown unknowns, J.
Phys. D. Appl. Phys., Vol. 49 (24), pp. 243001, 2016.
[7] Mei D., Zhu X., Wu C., Ashford B., Williams P. T., and Tu X., Plasma-photocatalytic conversion of CO2 at low
temperatures: Understanding the synergistic effect of plasma-catalysis, Appl. Catal. B Environ., Vol. 182, pp.
525–532, 2016.
[8] Tu X. and Whitehead J. C., Plasma-catalytic dry reforming of methane in an atmospheric dielectric barrier
discharge: Understanding the synergistic effect at low temperature, Appl. Catal. B Environ., Vol. 125, pp. 439–
448, 2012.
[9] Bogaerts A., Tu, X., Whitehead, J. C., Centi, G., Lefferts, L., Guaitella, O., Azzolina-Jury, F., Kim, H.-H.,
Murphy, A. B., Schneider, W. F., Nozaki, T., Hicks, J. C., Rousseau, A., Thevenet, F., Khacef, A., and Carreon,
M., The 2020 plasma catalysis roadmap, J. Phys. D. Appl. Phys., Vol. 53 (44), pp. 443001, 2020.
[10] Williams J. L., Monolith structures, materials, properties and uses, Catal. Today, Vol. 69, pp. 3–9, 2001.
[11] Hagen J., Industrial Catalysis: A Practical Approach. Wiley-VCH Verlag GmbH and Co., 2006.
[12] Ertl G., Knozinger H., and Weitkamp J., Environmental catalysis. Wiley-VCH Verlag GmbH and Co., 2005.
[13] Cheng H., Lu X., and Liu D., The Effect of Tube Diameter on an Atmospheric-Pressure Micro-Plasma Jet,
Plasma Process. Polym., Vol. 12, pp. 1343–1347, 2015.
[14] Hensel K., Microdischarges in ceramic foams and honeycombs, Eur. Phys. J. D, Vol. 54 (2), pp. 141–148,
2009.
[15] Jánský J., Tholin F., Bonaventura Z., and Bourdon A., Simulation of the discharge propagation in a capillary
glass tube in air at atmospheric pressure, J. Phys. D. Appl. Phys., Vol. 43 (39), pp. 173–177, 2010.
[16] Jánský J., Le Delliou P., Tholin F., Tardiveau P., Bourdon A., and Pasquiers S., Experimental and numerical
study of the propagation of a discharge in a capillary tube in air at atmospheric pressure, J. Phys. D. Appl.
Phys., Vol. 44 (33), pp. 335201, 2011.
[17] Zhang Q. Z. and Bogaerts A., Plasma streamer propagation in structured catalysts, Plasma Sources Sci.
Technol., Vol. 27 (10), pp. 105013, 2018.
[18] Rajanikanth B. S., Kumar P. K. S., and Ravi V., Non-Conventional Plasma Assisted Catalysts for Diesel
Exhaust Treatment: A Case Study, Plasma Sci. Technol., Vol. 4 (1), pp. 1119–1126, 2002.
[19] Ayrault C., Barrault, J., Blin-Simiand, N., Jorand, F., Pasquiers, S., Rousseau, A., Tatibouët, J.M., Oxidation
of 2-heptanone in air by a DBD-type plasma generated within a honeycomb monolith supported Pt-based
catalyst, Catal. Today, Vol. 89 (1–2), pp. 75–81, 2004.
[20] Blin-Simiand N., Tardiveau P., Risacher A., Jorand F., and Pasquiers S., Removal of 2-heptanone by dielectric
barrier discharges - The effect of a catalyst support, Plasma Process. Polym., Vol. 2 (3), pp. 256–262, 2005.
11Int. J. Plasma Environ. Sci. Technol. 15 (2021) e01003 R. Cimerman et al.
[21] Graupner K., et al., Pulsed discharge regeneration of diesel particulate filters, Plasma Chem. Plasma Process.,
Vol. 33 (2), pp. 467–477, 2013.
[22] Kim H.-H., Application of Non-thermal Plasma in Environmental Protection, Ph.D. Thesis, Toyohashi
University of Technology, Toyohashi, Japan, 2000.
[23] Nguyen D. B., Shirjana S., Hossain M. M., Heo I., and Mok Y. S., Effective generation of atmospheric pressure
plasma in a sandwich-type honeycomb monolith reactor by humidity control, Chem. Eng. J., Vol. 401, pp.
125970, 2020.
[24] Saud S., Nguyen, D.B., Bhattarai R.M., Matyakubov N., Heo, I., Kim, S.J., Kim, Y.J., Lee, J.H., Mok, Y.S.,
Dependence of humidified air plasma discharge performance in commercial honeycomb monoliths on the
configuration and key parameters of the reactor, J. Hazard. Mater., Vol. 404, pp. 124024, 2021.
[25] Hossain M., Mok, Y.S., Nguyen, D.B., Kim, S.J., Kim, Y.J., Lee, J.H., Heo, I., Nonthermal plasma in practical-
scale honeycomb catalysts for the removal of toluene, J. Hazard. Mater., Vol. 404, pp. 123958, 2021.
[26] Shimizu K., Hirano T., and Oda T., Effect of water vapor and hydrocarbons in removing NOx by using
nonthermal plasma and catalyst, IEEE Trans. Ind. Appl., Vol. 37 (2), pp. 464–471, 2001.
[27] Mizuno A., Generation of non-thermal plasma combined with catalysts and their application in environmental
technology, Catal. Today, Vol. 211, pp. 2–8, 2013.
[28] Hensel K., Janda M., and Ráheľ J., Generation of discharges inside the honeycomb monolith assisted by diffuse
coplanar surface barrier discharge, 19th International Symposium on Plasma Chemistry, Bochum, 2009.
[29] Sato S., Hensel K., Hayashi H., Takashima K., and Mizuno A., Honeycomb discharge for diesel exhaust
cleaning, J. Electrostat., Vol. 67 (2–3), pp. 77–83, 2009.
[30] Sato S. and Mizuno A., NOx removal of simulated diesel exhaust with honeycomb discharge, Int. J. Plasma
Environ. Sci. Technol., Vol. 4 (1), pp. 18–23, 2010.
[31] Hensel K., Sato S., and Mizuno A., Sliding discharge inside glass capillaries, IEEE Trans. Plasma Sci., Vol.
36, pp. 1282–1283, 2008.
[32] Hayashi H., Sakiyama D., Takashima K., and Mizuno A., Collection of diesel exhaust particles using
electrostatic charging prior to DPF and regeneration of DPF using sliding discharge, Int. J. Plasma Environ.
Sci. Technol., Vol. 6 (2), pp. 160–165, 2012.
[33] Seiyama R., Yamaji T., Hayashi H., Takashima K., and Mizuno A., Regeneration of diesel particulate filter
using sliding discharge, IEEE Ind. Appl. Soc. Annu. Meet., 2013.
[34] Mizuno A. and Takashima K., Non-thermal plasma combined with catalysts for environmental technology,
HAKONE XV, pp. 34–37, 2016.
[35] Takashima K., et al., Honeycomb discharge generated with a single high voltage power supply for activating
catalyst, Int. J. Plasma Environ. Sci. Technol., Vol. 7 (2), pp. 142–147, 2013.
[36] Hensel K., Leštinský M., Homola T., and Ráheľ J., Coplanar surface barrier discharge assisted generation of
discharges inside the honeycomb monolith, 17th Symposium on Applications of Plasma Processes, pp. 163–
164, 2009.
[37] Höft H., Becker M. M., and Kettlitz M., Impact of gas flow rate on breakdown of filamentary dielectric barrier
discharges, Phys. Plasmas, Vol. 23 (3), pp. 033504, 2016.
[38] Kim H.-H., Takeuchi N., Teramoto Y., Ogata A., and Abdelaziz A. A., Plasma candle: A new type of scaled-
up plasma jet device, Int. J. Plasma Environ. Sci. Technol., Vol. 14 (1), pp. e01004, 2020.
[39] Xian Y. B.,Xu, H.T., Lu, X.P., Pei, X.K., Gong W.W., Lu, Y., Liu D.W., and Yang Y., Plasma bullets behavior
in a tube covered by a conductor, Phys. Plasmas, Vol. 22 (6), pp. 063507, 2015.
[40] Nguyen D. B., Mok Y. S., and Lee W. G., Enhanced atmospheric pressure plasma jet performance by an
alternative dielectric barrier discharge configuration, IEEE Trans. Plasma Sci., Vol. 47 (11), pp. 4795–4801,
2019.
[41] Bian X., Meng X., Wang L., MacAlpine J. M. K., Guan Z., and Hui J., Negative corona inception voltages in
rod-plane gaps at various air pressures and humidities, IEEE Trans. Dielectr. Electr. Insul., Vol. 18 (2), pp.
613–619, 2011.
[42] Bian X., He Z., Zhu J., Pi X., Wan S., and Qi L., Effects of humidity on variation of negative corona-generated
space charge in rod to plane electrode, J. Eng., Vol. 2019 (16), pp. 2869–2872, 2019.
[43] Ryzko H., Drift velocity of electrons and ions in dry and humid air and in water vapour, Proc. Phys. Soc., Vol.
85 (6), pp. 1283–1295, 1965.
[44] Chen J. and Wang P., Effect of relative humidity on electron distribution and ozone production by DC coronas
in air, IEEE Trans. Plasma Sci., Vol. 33 (2), pp. 808–812, 2005.
[45] Falkenstein Z. and Coogan J. J., Microdischarge behaviour in the silent discharge of nitrogen-oxygen and
water-air mixtures, J. Phys. D. Appl. Phys., Vol. 30 (5), pp. 817–825, 1997.
[46] Kim H.-H., Teramoto Y., Negishi N., and Ogata A., A multidisciplinary approach to understand the interactions
12Int. J. Plasma Environ. Sci. Technol. 15 (2021) e01003 R. Cimerman et al.
of nonthermal plasma and catalyst: A review, Catal. Today, Vol. 256, pp. 13–22, 2015.
[47] Fan X., Kang S., Li J., and Zhu T., Formation of nitrogen oxides (N2O, NO, and NO2) in typical plasma and
plasma-catalytic processes for air pollution control, Water. Air. Soil Pollut., Vol. 229 (11), pp. 351, 2018.
[48] Zhao G. B., Hu X., Argyle M. D., and Radosz M., N atom radicals and N2 (A3Σu+) found to be responsible for
nitrogen oxides conversion in non-thermal nitrogen plasma, Ind. Eng. Chem. Res., Vol. 43 (17), pp. 5077–
5088, 2004.
[49] Tang X., Wang, J., Yi, H., Zhao, S., Gao, F., Huang, Y., Zhang, R., and Yang, Z., N2O formation characteristics
in dielectric barrier discharge reactor for environmental application: Effect of operating parameters, Energy
and Fuels, Vol. 31 (12), pp. 13901–13908, 2017.
[50] Abdelaziz A. A., Ishijima T., Osawa N., and Seto T., Quantitative analysis of ozone and nitrogen oxides
produced by a low power miniaturized surface dielectric barrier discharge: effect of oxygen content and
humidity level, Plasma Chem. Plasma Process., Vol. 39 (1), pp. 165–185, 2019.
[51] Kučerová K., Machala Z., and Hensel K., Transient spark discharge generated in various N2/O2 gas mixtures:
reactive species in the gas and water and their antibacterial effects, Plasma Chem. Plasma Process., Vol. 40
(3), pp. 749–773, 2020.
[52] Peyrous R., The Effect of relative humidity on ozone production by corona discharge in oxygen or air - a
numerical simulation - Part II: Air, Ozone Sci. Eng., Vol. 12 (1), pp. 41–64, 1990.
[53] Pinart J., Smirdec, M., Pinart, M.E., Aaron, J.N., Benmansour, Z., Goldman, M., Goldman, A., Quantitative
study of the formation of inorganic chemical species following corona discharge - I. Production of HNO2 and
HNO3 in a composition-controlled, humid atmosphere, Atmos. Environ., Vol. 30 (1), pp. 129–132, 1996.
[54] Zhang X., Lee B. J., Im H. G., and Cha M. S., Ozone production with dielectric barrier discharge: effects of
power source and humidity, IEEE Trans. Plasma Sci., Vol. 44 (10), pp. 2288–2296, 2016.
[55] Pekárek S., Effect of polarity on ozone production of DC corona discharge with and without photocatalyst,
19th International Symposium on Plasma Chemistry, 2009.
[56] Abdel-Salam M., Mizuno A., and Shimizu K., Ozone generation as influenced by gas flow in corona reactors,
J. Phys. D. Appl. Phys., Vol. 30 (5), pp. 864–870, 1997.
[57] Chen J. and Davidson J. H., Ozone production in the negative DC corona: The dependence of discharge polarity,
Plasma Chem. Plasma Process., Vol. 23 (3), pp. 501–518, 2003.
[58] Brandvold D. K., Martinez P., and Dogruel D., Polarity dependence of N2O formation from corona discharge,
Atmos. Environ., Vol. 23 (9), pp. 1881–1883, 1989.
[59] Chen J. and Davidson J. H., Ozone production in the positive DC corona discharge: model and comparison to
experiments, Plasma Chem. Plasma Process., Vol. 22 (4), pp. 495–522, 2002.
[60] Kim H.-H., Nonthermal plasma processing for air-pollution control: A historical review, current issues, and
future prospects, Plasma Process. Polym., Vol. 1 (2), pp. 91–110, 2004.
13You can also read


