Cover Presentation on Far East Hospitality Trust - May 2018 - Far East Hospitality Trust ...
←
→
Page content transcription
If your browser does not render page correctly, please read the page content below
Cover

        Presentation on
        Far East Hospitality Trust

        May 2018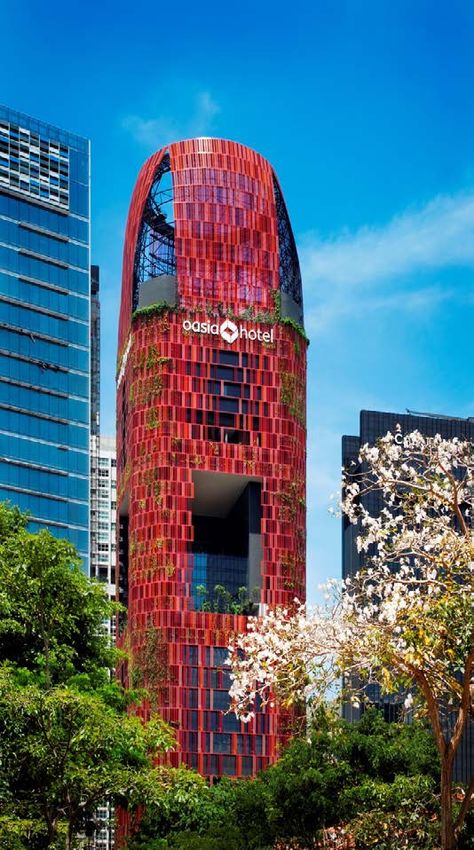
Important Notice

Information contained in this presentation is intended solely for your personal reference and is strictly confidential. The information and opinions in this presentation are subject to change without notice, its accuracy
is not guaranteed and it may not contain all material information concerning Far East Hospitality Trust (the “Trust”), a stapled group comprising Far East Hospitality Real Estate Investment Trust and Far East
Hospitality Business Trust. Neither FEO Hospitality Asset Management Pte. Ltd. (the “Manager”), FEO Hospitality Trust Management Pte. Ltd. (the “Trustee-Manager”, and together with the Manager, the
“Managers”), the Trust nor any of their respective affiliates, advisors and representatives make any representation regarding, and assumes no responsibility or liability whatsoever (in negligence or otherwise) for,
the accuracy or completeness of, or any errors or omissions in, any information contained herein nor for any loss howsoever arising from any use of these materials. By attending or viewing all or part of this
presentation, you are agreeing to maintain confidentiality regarding the information disclosed in this presentation and to be bound by the restrictions set out below. Any failure to comply with these restrictions may
constitute a violation of applicable securities laws.

The information contained in these materials has not been independently verified. No representation or warranty, expressed or implied, is made as to, and no reliance should be placed on, the fairness, accuracy,
completeness or correctness of, the information or opinions contained herein. None of the Trust, the Managers, DBS Trustee Limited (as trustee of Far East Hospitality Real Estate Investment Trust), Far East
Organization, controlling persons or affiliates, nor any of their respective directors, officers, partners, employees, agents, advisers or representatives shall have any liability whatsoever (in negligence or otherwise)
for any loss howsoever arising, whether directly or indirectly, from any use, reliance or distribution of this presentation or its contents or otherwise arising in connection with this presentation. It is not the intention to
provide, and you may not rely on these materials as providing a complete or comprehensive analysis of the Trust's financial or trading position or prospects. The information and opinions contained in these
materials are provided as at the date of this presentation and are subject to change without notice. Nothing contained herein or therein is, or shall be relied upon as, a promise or representation, whether as to the
past or the future and no reliance, in whole or in part, should be placed on the fairness, accuracy, completeness or correctness of the information contained herein. Further, nothing in this document should be
construed as constituting legal, business, tax or financial advice. None of the Joint Bookrunners or their subsidiaries or affiliates has independently verified, approved or endorsed the material herein.

Nothing in this presentation constitutes an offer of securities for sale in Singapore, United States or any other jurisdiction where it is unlawful to do so.

The information in this presentation may not be forwarded or distributed to any other person and may not be reproduced in any manner whatsoever. Any forwarding, distribution or reproduction of this information in
whole or in part is unauthorised. Failure to comply with this directive may result in a violation of the Securities Act or the applicable laws of other jurisdictions.

This presentation contains forward-looking statements that may be identified by their use of words like “plans,” “expects,” “will,” “anticipates,” “believes,” “intends,” “depends,” “projects,” “estimates” or other words of
similar meaning and that involve assumptions, risks and uncertainties. All statements that address expectations or projections about the future and all statements other than statements of historical facts included in
this presentation, including, but not limited to, statements about the strategy for growth, product development, market position, expenditures, and financial results, are forward-looking statements. Such forward-
looking statements are based on certain assumptions and expectations of future events regarding the Trust's present and future business strategies and the environment in which the Trust will operate, and must be
read together with those assumptions. The Managers do not guarantee that these assumptions and expectations are accurate or will be realized. Actual future performance, outcomes and results may differ
materially from those expressed in forward-looking statements as a result of a number of risks, uncertainties and assumptions. Although the Managers believe that such forward-looking statements are based on
reasonable assumptions, it can give no assurance that such expectations will be met. Representative examples of these risks, uncertainties and assumptions include (without limitation) general industry and
economic conditions, interest rate trends, cost of capital and capital availability, competition from other companies, shifts in customer demands, customers and partners, changes in operating expenses including
employee wages, benefits and training, governmental and public policy changes and the continued availability of financing in the amounts and the terms necessary to support future business. Predictions,
projections or forecasts of the economy or economic trends of the markets are not necessarily indicative of the future or likely performance of the Trust. Past performance is not necessarily indicative of future
performance. The forecast financial performance of the Trust is not guaranteed. You are cautioned not to place undue reliance on these forward-looking statements, which are based on the Managers’ current view
of future events. The Managers do not assume any responsibility to amend, modify or revise any forward-looking statements, on the basis of any subsequent developments, information or events, or otherwise.

This presentation is for information purposes only and does not constitute or form part of an offer, solicitation or invitation of any offer, to buy or subscribe for any securities, nor should it or any part of it form the
basis of, or be relied in any connection with, any contract or commitment whatsoever. Any decision to invest in any securities issued by the Trust or its affiliates should be made solely on the basis of information
contained in the prospectus to be registered with the Monetary Authority of Singapore (the “MAS”) after seeking appropriate professional advice, and you should not rely on any information other than that contained
in the prospectus to be registered with the MAS.

These materials may not be taken or transmitted into the United States, Canada or Japan and are not for distribution, directly or indirectly, in or into the United States, Canada or Japan.

These materials are not an offer of securities for sale into the United States, Canada or Japan. The securities have not been and will not be registered under the Securities Act and, subject to certain exceptions,
may not be offered or sold within the United States. The securities are being offered and sold outside of the United States in reliance on Regulation S under the United States Securities Act of 1933, as amended.
There will be no public offer of securities in the United States and the Managers do not intend to register any part of the proposed offering in the United States.

This presentation has not been and will not be registered as a prospectus with the MAS under the Securities and Futures Act, Chapter 289 of Singapore and accordingly, this document may not be distributed,
either directly or indirectly, to the public or any member of the public in Singapore.

                                                                                                                                                                                                                                    1
I. Overview of Far East Hospitality Trust
Overview of Far East H-Trust

Issuer                        Far East Hospitality Trust
                                                                                            Public                              Far East

                                                                                                40.5%                                 59.5%
Sponsor                       Far East Organization group of companies

                                                                                                              Far East
                                                                                                              H-Trust
REIT Manager                  FEO Hospitality Asset Management Pte. Ltd.
                                                                                                                                       Business
                                                                                REIT                                                     Trust1

Investment                    Hospitality and hospitality-related assets in
Mandate                       Singapore                                           REIT             Far East          Far East       Trustee-
                                                                                 Manager            H-REIT            H-BT          Manager
                              13 properties valued at approximately
                              S$2.59 billion
Portfolio                                                                                                                   REIT
                              9 hotel properties (“Hotels”) and 4 serviced                  Hotel          SR
                                                                                                                         Commercial
                              residences (“SR” or “Serviced Residences”)                   Portfolio     Portfolio
                                                                                                                          Premises

Hotel and SR
                              Far East Hospitality Management (S) Pte Ltd
Operator
                                                                                              Master Lessees
Retail & Office
Space Property                Jones Lang LaSalle Property Consultants Pte Ltd
Manager
                                                                                             Hotel & Serviced        Retail & Office
                              Sponsor companies, part of the Far East                          Residence             Space Property
Master Lessees                                                                                  Operator                Manager
                              Organization group of companies

(1)      Dormant at Listing Date and master lessee of last resort

                                                                                                                                               3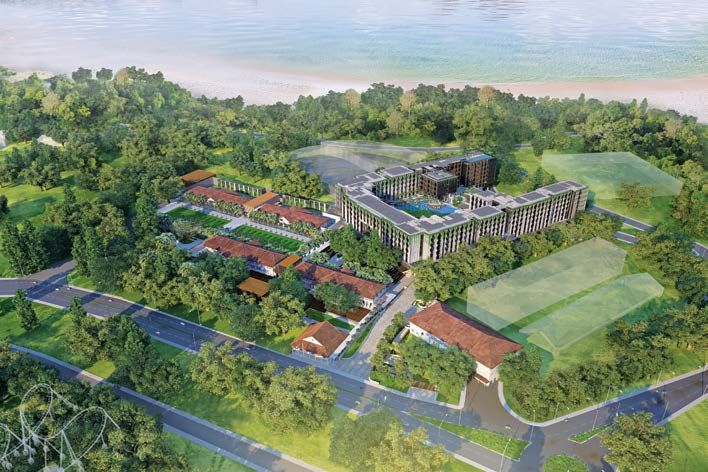
Singapore-Focused Portfolio with High Quality Assets

                           13 Properties, totalling 3,143 hotel rooms and apartment units, valued at ~S$2.59 bn¹
1   Oasia Hotel Novena              2        Orchard Parade Hotel        3      Rendezvous Hotel       4     The Elizabeth Hotel                The Quincy Hotel       6 Village Hotel Albert Court
                                                                                                                                          5
       (428 rooms)                               (388 rooms)                  Singapore (298 rooms)             (256 rooms)                       (108 rooms)                   (210 rooms)

                                                                                                                                                                       7     Village Hotel Bugis
                                                                                                                                                                                 (393 rooms)
                                           1
                                   Novena Medical Hub
                                                   Civic and Cultural
                                                         District
                  2        4
                               5                                                                                                       12          8      Changi
                                                        6     7                                                                                        International
                                        10                                                                                                                Airport

                                                   3                                                                                                                         Village Hotel Changi
                                                                                                                                                Central Region         8
                                     13                                                                                                                                           (380 rooms)
                                                                                                   Portfolio Hotel                              Expressways
                                             11                                                    Portfolio Serviced Residences
                                               9                                                   Key Areas of Interest
                                                                                                   Medical Facility
                                                                                                   MICE Facility
                                                               Marina Bay
                                                              Cruise Centre

                        Village Residence                          Village Residence                   Village Residence                                                    Oasia Hotel Downtown
                13                                           12                                11 Clarke Quay (128 units)             10 Regency House (90 units)       9
                     Robertson Quay (72 units)                     Hougang (78 units)                                                                                            (314 rooms)

    Hotels 1-8 were valued by Colliers and serviced residences 10-13 were valued by Savills on 31 December 2017; Hotel 9 was acquired on 2 April 2018                                                 4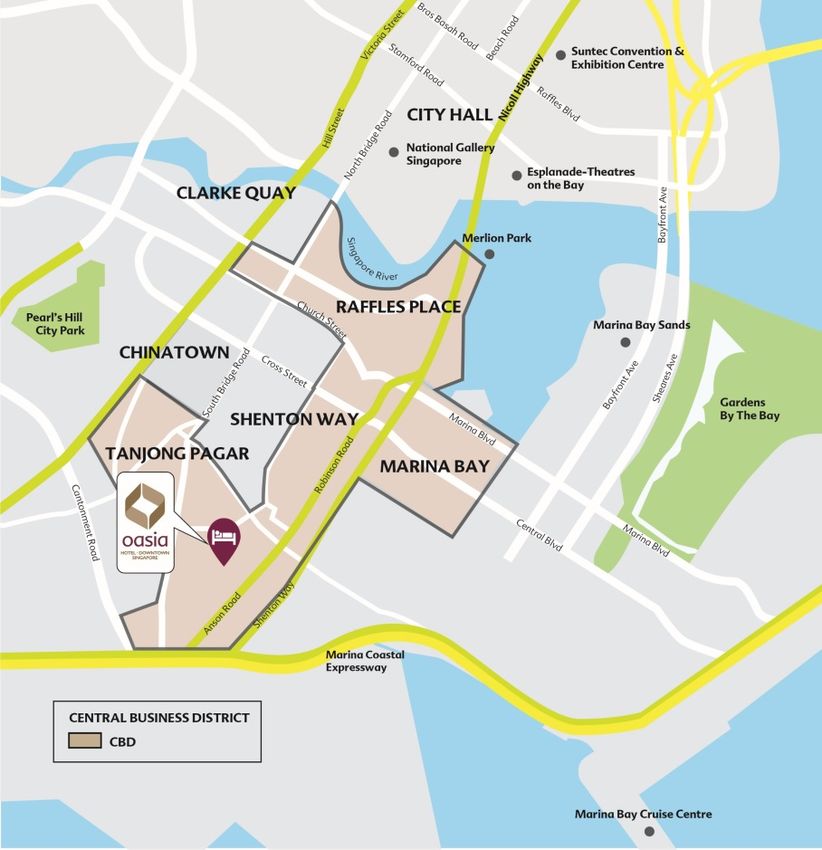
Sponsor & Master Lessee:
FEO – Singapore’s Largest Private Real Estate Developer
Active developer with a track record
of more than 50 years
Bid and won >60 land sites1 since 2010
Active Developer — Totalling >13.0 m sqft of NLA
— Valued at >S$6.0bn2
“Best Developer in South East Asia and
Singapore” at the South East Asia
Awards Received Awards in 2011 and 2015
Winner of 10 FIABCI Prix d’Excellence
awards
#1 Market Share in Mid-Tier Hotels and
Serviced Residences3:
Hospitality
Business — ~12% market share in Mid-Tier Hotels
— ~21% market share in SRs
FEO’s >55% stake in Far East H-Trust is a strong demonstration
of its ongoing support and confidence in the trust
(1) In Singapore and overseas, including property acquisitions
(2) Including bids entered into through joint ventures
(3) IPO Prospectus 5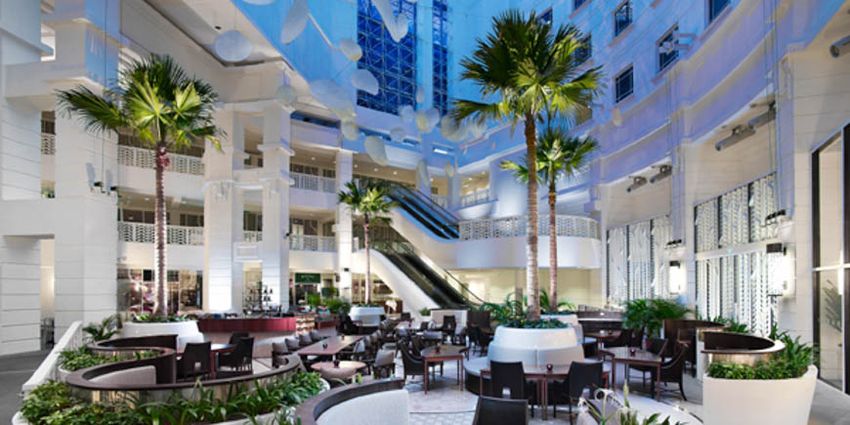
Attractive Master Lease Structure: Upside Sharing with
Downside Protection
Key Terms of the Master Lease Agreement Composition of the Master Lease Rental 2
20 years with the option to renew for
Tenure
an additional 20 years
FFE Reserve 2.5% of GOR1
25.4%
30.9%
Total rent =
33% of GOR (Hotels and SRs)
74.6% 69.1%
+
Lease Terms
23 – 37% of GOP2 (Hotels)
38 – 41% of GOP (SRs)
Fixed rent Variable rent % of GOR % of GOP
Variable rent = Total rent – Fixed rent
Sponsor companies, part of the
Master Lessees Far East Organization group of
companies
% of GOR component contributes > 60% of Far East H-Trust’s Gross Revenue,
ensuring less sensitivity to cost increases
(1) GOR refers to the Gross Operating Revenue of the Property
(2) GOP refers to the Gross Operating Profit of the Property
6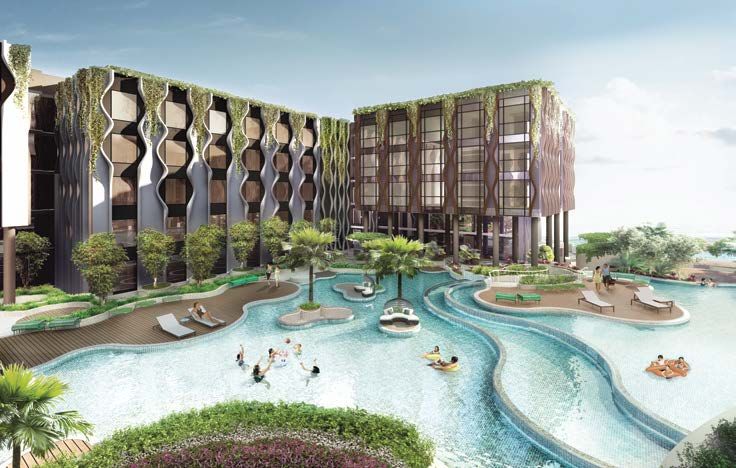
REIT Commercial Premises

                  As at 31 December 2017

 Types of
 Commercial         Retail, office and serviced offices
 Space

 No. of Units /     286 units housed in 9 properties
 Tenants            162 tenants

                    Retail – 14,065 sqm                     Rendezvous Gallery (Rendezvous Hotel Singapore)
 Total NLA
                    Office – 7,101 sqm

 Ave.               Retail – 92.9%
 Occupancy
 (FY 2017)          Office – 85.1%

                    $22.7 million in FY 2017
 Revenue            (decrease of 1.6% year-on-year)
 Contribution       21.8% of total Far East H-Trust gross
                    revenue in FY 2017

                                                            Central Square Serviced Offices (Village Residence Clarke Quay)

                                                                                                                              7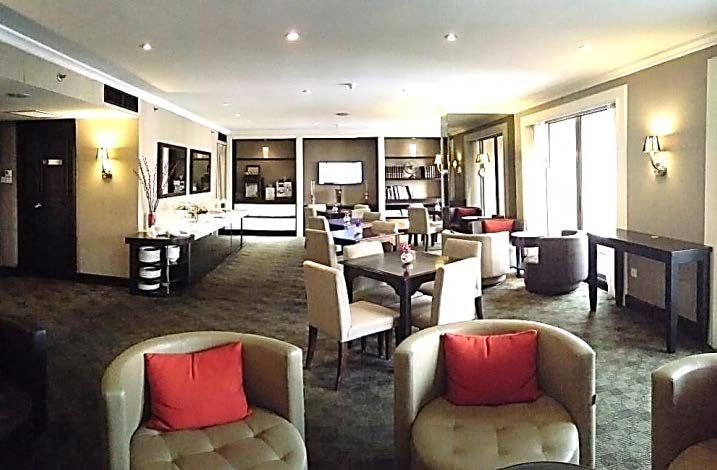
II. Financial Highlights
Executive Summary – Performance vs LY

                                                         1Q 2018          1Q 2017         Variance
                                                             $              $                 %

 Gross Revenue ($’000)                                           25,724         24,775               3.8

 Net Property Income ($’000)                                     23,007         22,124               4.0

 Income Available for Distribution ($’000)                       17,645         16,931               4.2

 Distribution per Stapled Security (cents)                         0.94           0.93               1.1

 •   Gross Revenue increased 3.8% in 1Q 2018. Master Lease Rental increased 6.2% and Retail and
     Office Revenue decreased 3.9% mainly due to lower rental rates.

 •   Net Property Income and Income Available for Distribution were 4.0% and 4.2% higher respectively.

 •   Distribution per Stapled Security was 1.1% higher at 0.94 cents.

                                                                                                           9
Portfolio Performance 1Q 2018 - Hotels
Average Occupancy Average Daily Rate (ADR) Revenue Per Available Room (RevPAR)
% $ $
100.0 200 200
88.1 1.5pp 89.6
1.6% 155
80.0 160 152 160
3.3% 139
134
60.0 120 120
40.0 80 80
20.0 40 40
0.0 0 0
1Q 2017 1Q 2018 1Q 2017 1Q 2018 1Q 2017 1Q 2018
• Revenue per available room (“RevPAR”) grew 3.3% to $139 in 1Q 2018 due to an increase in average
occupancy and average daily rate (“ADR”) of 1.5pp and 1.6% respectively.
• Despite the ongoing room renovation at Orchard Parade Hotel, the performance of the hotel portfolio
improved due to a pick-up in overall demand.
• In addition, there was some uplift from the biennial Singapore Airshow in February 2018.
10Portfolio Performance 1Q 2018 – Serviced Residences
Revenue Per Available Unit
% Average Occupancy $ Average Daily Rate (ADR) (RevPAU)
$
100.0
240 227 -5.8% 240
214
10.1pp 81.3
80.0 200 200
71.2 7.6% 174
162
160 160
60.0
120 120
40.0
80 80
20.0
40 40
0.0 0 0
1Q 2017 1Q 2018 1Q 2017 1Q 2018 1Q 2017 1Q 2018
• The serviced residences (“SRs”) showed a year-on-year improvement in performance in 1Q 2018.
• The average occupancy of the SRs improved 10.1pp and the ADR was 5.8% lower.
• Correspondingly, revenue per available unit (“RevPAU”) of the SR portfolio grew 7.6% to $174 in 1Q
2018.
• Although there was an increase in group bookings, corporate demand remained subdued.
11Breakdown of Gross Revenue 1Q 2018 – Total Portfolio
1Q 2018 1Q 2017
Commercial Commercial
21.4% 23.1%
Serviced
Residences
12.3% Hotels Serviced
Residences Hotels
66.3%
11.7% 65.2%
12Market Segmentation 1Q 2018 - Hotels
Hotels (by Revenue) Hotels (by Region)
Others
N America 3.6%
6.0%
Oceania
8.9%
Corporate N Asia
33.1% 25.9%
S Asia
11.0%
Leisure/
Independent
66.9% SE Asia
Europe
23.7%
20.9%
• Leisure segment contributed 66.9% of hotel revenue in 1Q 2018, compared to 65.3% a year ago.
• Growth in revenue contribution from South Asia and North Asia offset the decline from Oceania.
13Market Segmentation 1Q 2018 – Serviced Residences
Serviced Residences (by Revenue) Serviced Residences (by Industry)
Others
Leisure/
26.2% Banking &
Independent
Finance
23.9%
22.0%
FMCG
3.1%
Logistics
3.2% Services
18.7%
Corporate
76.1% Elect &
Manufact
11.1%
Oil & Gas
15.7%
• Revenue contribution from the Corporate segment was 76.1% in 1Q 2018, compared to 76.5% a year ago.
• Higher revenue contribution from Banking & Finance and Oil & Gas offset the decline in Logistics.
14Capital Management
As at 31 March 2018 Debt Maturity Profile
$263.9m
$67.2m
$225m
Total debt $813.9m
(1) $100m
$65m
$125m
Available revolving facility $168.3m $100m $100m
$100m
$125m
Gearing ratio 35.1% $31.7m
2018 2019 2020 2021 2022 2023 2024 2025
Unencumbered asset Interest Rate Profile
100% (1) The REIT Manager has
as % total asset refinanced $65.0m and $67.2m
Fixed,
term loans ahead of their maturity
$332.2m,
40.8% in August 2018 with new five and
seven-year term loans
Proportion of fixed rate(2) 40.8% respectively. These term loans
were drawn down in April 2018.
(2) The REIT Manager has
entered into $150m of interest rate
Weighted average debt swap contracts in April 2018.
2.7 years
maturity Together with the new loans
drawn down for the acquisition of
Oasia Hotel Downtown, the
Floating,
$481.7m,
proportion of fixed rate borrowings
would increase to about 47%.
Average cost of debt 2.5% 59.2%
15III. Industry Outlook & Prospects
Historical and Forecast Visitor Arrivals in Singapore

            Sep 11 and SARS                                                  Sub-Prime                                                                     17,600
                                                                                                                                                          – 18,100
                                                                                                                                                 17,423
                                                                                                                                       16,403
                                                                                                           15,568            15,231
                                                                                                                    15,087
                                                                                                  14,496
                                                                                        13,169

                                                                               11,640
                                                    10,285 10,116
                                            9,751                 9,681
                                 8,943
                        8,329
    7,567
              6,127

    2002      2003      2004      2005      2006    2007     2008     2009     2010      2011     2012      2013     2014     2015      2016     2017     2018E

    Visitor arrival numbers are in ‘000s.

      •      Visitor arrivals grew at a CAGR of 2.9% from 2013 to 2017, and are projected to increase by 1% to
             4% in 2018. Visitor arrivals increased 6.2% year-on-year in 2017.

  Sources : IPO Prospectus dated 16 August 2012 (2002 to 2011 visitor arrivals)
            Singapore Tourism Board, “Singapore tourism sector performance breaks record for the second year running in 2017”, 14 February 2018 (2018E visitor arrivals)
            Singapore Tourism Board, International Visitor Arrivals Statistics, 12 February 2018
                                                                                                                                                                           17
Estimated Hotel Room Supply in Singapore
753
2,665 (+1.1%)
2,559 (+4.2%)
4,266 (+4.1%)
(+7.5%)
2,010
3,230 (+3.7%)
(+6.2%)
2013 2014 2015 2016 2017 2018 (projected)
Existing Supply New Supply
• Hotel supply is expected to increase by about 750 rooms (an increase of 1.1%) in 2018
• No hotel sites introduced in Government Land Sales (GLS) programme since 2014
• Urban Redevelopment Authority (URA) has tightened approval for applications for new hotels,
backpackers’ hostels or boarding houses on sites that are not zoned for hotel use
Note: The above chart does not take into account the following closures for renovations and re-openings
Sources: CBRE report issued as at February 2018 and Far East H-Trust compilation
Urban Redevelopment Authority, Second Half 2014 Government Land Sales (GLS) Programme, 10 June 2014
Channel News Asia, “New hotels cannot be built on non-designated sites: URA”, 7 July 2014
18Transformation of Tourism Landscape –
Upcoming Developments & Events
Changi Airport Terminal 4 and Major MICE and biennial events (2018) New Attractions at Sentosa (2017-
Project Jewel (2017-2019) Singapore’s Chairmanship of ASEAN, 2030)
Augmenting Changi Airport’s status as MICE and biennial events including AJ-Hackett bungee jump, Skyline Luge
a leading air hub serving 8 million Singapore Airshow and Food & Hotel Asia expansion, Merlion Gateway revamp,
passengers annually and provision of to attract regional attendees new outdoor attraction and SDC’s
world-class retail experience “Sentosa day to night” destination
masterplan
Tapping Regional Secondary Cities More land, sea and air connections Mandai Makeover (2023*)
Continued efforts by the Singapore Greater connectivity between the Wildlife and nature heritage project,
Tourism Board to promote Tier 2 regional airport and ferry terminal, and the integrating new attractions with the
cities to drive visitor arrivals introduction of new European flight Singapore Zoo, Night Safari and River
destinations Safari
*Opening Dates may be subject to change
Images from Changi Airport Group, Singapore Tourism Board, Sentosa, Today Online, Food & Hotel Asia, Straits Times, URA and Temasek
19Outlook & Prospects
• Performance of Far East H-Trust’s hotel portfolio expected to stabilise
• Demand and supply to balance out
• International visitor arrivals projected to grow 1% to 4% in 2018
• Supply expected to register a moderate increase of 1.1% (750 new rooms)1 in 2018
• Some uplift from major MICE and biennial events
• Completion of renovation of Orchard Parade Hotel ahead of schedule
• Demand for SRs expected to lag behind that of hotels
• Operating environment remains competitive in near term
• Muted corporate and relocation activities
• Operating environment for retail and office leasing expected to be competitive
• Oasia Hotel Downtown to contribute to the portfolio from 2 April 2018
(1) CBRE report issued as at February 2018 and Far East H-Trust compilation
20IV. Growth Strategy
Key Engines of Growth
A B C
Executing Asset
Driving Organic Growth Enhancement Initiatives Growing the Portfolio
Optimising the performance Implementing refurbishment Acquiring completed
of hospitality assets programmes to refresh and Sponsor ROFR properties
upgrade the properties
Growing contribution from Seeking suitable 3rd party
commercial spaces Optimizing plant and acquisitions
equipment for greater
+ energy efficiency and cost + Developing a new hotel with
Sponsor
savings
Key initiatives to drive both immediate and long-term growth
22Asset Enhancement Initiatives – Orchard Parade Hotel
Orchard Parade Hotel Upgrading of swimming pool, pool deck, gym and meeting room
(Phase 1, completed in 2016)
Swimming pool
After
Before
23Asset Enhancement Initiatives – Orchard Parade Hotel
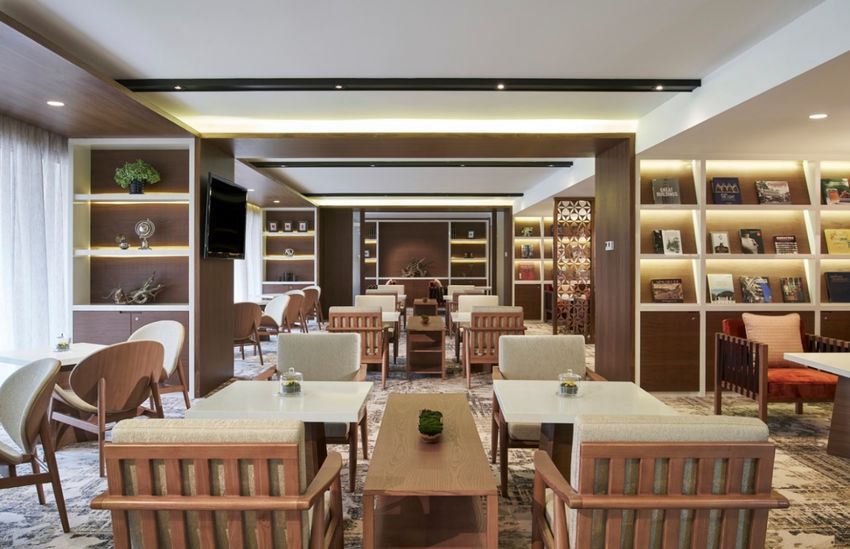
Orchard Parade Hotel Renovation of reception, lobby bar, function rooms and
(Phase 2, completed in 2016) pre-function areas
Lobby bar
After
Before
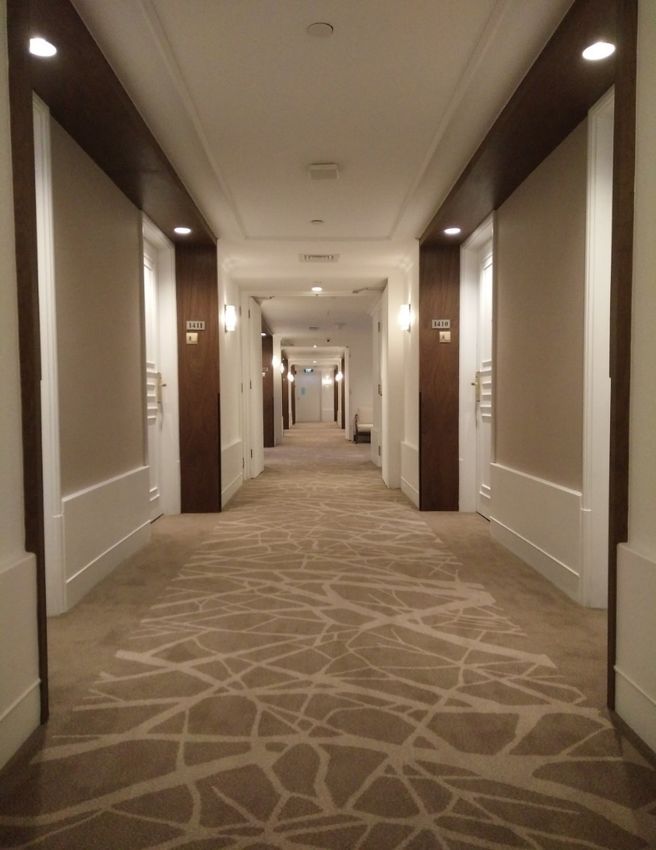
24Asset Enhancement Initiatives – Orchard Parade Hotel
Orchard Parade Hotel Refurbishment of Superior, Deluxe Plus and Club guest rooms,
(Phase 3, completed in 1Q 2018)
suites and club lounge
Club guest room
After
Before
25Asset Enhancement Initiatives – Orchard Parade Hotel
Orchard Parade Hotel Refurbishment of Superior, Deluxe Plus and Club guest rooms,
(Phase 3, completed in 1Q 2018)
suites and club lounge
Guest room corridor
After Before
26Asset Enhancement Initiatives – Orchard Parade Hotel
Orchard Parade Hotel Refurbishment of Superior, Deluxe Plus and Club guest rooms,
(Phase 3, completed in 1Q 2018)
suites and club lounge
Club lounge
After
Before
27Potential Pipeline Projects from the Sponsor
1 Orchard Scotts Residences 2 Orchard Parksuites Village Residence
3 4 AMOY Hotel
West Coast
Number of Units: 207 Number of Units: 225 Number of Units: 51 Number of Rooms: 37
Expected Est. No of
Name of ROFR Property Completion Date Rooms / Units
Completed
1 Orchard Scotts Residences Completed 207
2 Orchard Parksuites Completed 225
3 Village Residence West Coast Completed 51
Completed 4 AMOY Hotel Completed 37
4,910 5 Oasia West Residences Completed 116
Under Development 1,767
Completed Subtotal 636
Central Region 56.2%
growth
Under Development
3,143 6 Village Hotel, The Outpost
Hotel and The Barracks Hotel 2019 839
at Sentosa
5 3 7 The Clan 2020 292
1 Under Development Subtotal 1,131
2
Total
4
7 Hotel Rooms 1,168
3
Serviced Residence Units 599
Existing Portfolio ROFR Properties Enlarged Portfolio
6 Grand Total 1,767
Village Hotel, The Outpost Hotel
5 Oasia West Residences1 6 7 The Clan1
and The Barracks Hotel1
Number of Units: 116 Number of Rooms: 839 Number of Rooms: 292
(1) This picture is an artist’s impression of the property and may differ from the actual view of the property
28Acquisition of Oasia Hotel Downtown – Overview
Location 100 Peck Seah Street, Singapore 079333
Tier Upscale
Leasehold Tenure(1) 65 years commencing from the Completion Date
Number of Guest Rooms 314
Food & Beverage Outlets 3
Independent Valuation by
S$210.0m (as at 5 January 2018)
Knight Frank
Independent Valuation by
S$226.0m (as at 29 December 2017)
Savills
Purchase Consideration
S$210.0m
Amount
Price per Key S$668,789
Vendor and Master Lessee Far East SOHO Pte. Ltd.
Annualised 9M2017 Net
S$9.6m(2)
Property Income (“NPI”)
Issuance of S$15.0m worth of Stapled Securities to
Earn-out Agreement
Vendor if the Earn-out Event Condition is satisfied
Oasia Hotel Downtown
(1) The Vendor currently owns a leasehold interest of 99 years commencing from 13 April 2011. As the leasehold tenure in the Property to be acquired by the REIT Trustee is in respect of a
shorter leasehold period than the length of the leasehold title held by the Vendor, upon expiry of the leasehold tenure held by the REIT Trustee, the title to the Property will revert back to the
Vendor.
(2) Based on the NPI of the Property for the nine-month period ended 30 September 2017 (“9M2017”) and annualised to full year.
29Acquisition of Oasia Hotel Downtown – Valuations & Funding
Purchase Price Relative to Valuation Funding Sources and Uses of Proceeds
(in S$m) (in S$m)
220.1 220.1
1.6 1.6 Acquisition fee
Equity
8.5
7.1% 22.7 Stamp duty,
disc. 3.7%
15.0(1) Distribution
Reinvestment professional and
disc.
Plan (“DRP”) other fees and
proceeds expenses
226.0
218.0 195.8 210.0 Purchase
210.0 210.0 Debt Consideration
Amount
Knight Frank Savills Average Purchase Sources Uses
Valuation Valuation Valuation Consideration
Amount
(1) Issuance of S$15.0m worth of Stapled Securities to Vendor if the Earn-out Event Condition is satisfied, pursuant to the Earn-out Agreement.
30Acquisition of Oasia Hotel Downtown –
Rationale for and Key Benefits of the Acquisition
High Quality Property with Strategic Location to
Yield Accretion Increase Exposure to Upscale Segment and
Growth in Corporate Contribution
Distribution per Stapled Security for 9M2017
(in Singapore cents)
3.09
+ 4.0%
2.97(1)
Before Acquisition After Acquisition
Stapled Securityholders would have enjoyed an increase in Oasia Hotel Downtown’s proximity to the CBD appeals to
distribution per Stapled Security as a result of the business travellers, to drive mid-week corporate business
Acquisition, assuming that the Property was acquired on
1 January 2017 Its upscale positioning also creates a better balance between
mid-tier and upscale hotel assets in the portfolio
(1) Based on the distributable income divided by the number of Stapled Securities in issue, adjusted for the interest savings from the repayment of the revolving credit facilities (“RCF”) using the
DRP proceeds. The proceeds were temporarily utilised to repay the RCF pending the intended use to finance the Acquisition. The number of Stapled Securities in issue and issuable as at 30
September 2017 was adjusted for the approximately 36.5 million Stapled Securities issued under the DRP. 31Hotel Development on Sentosa with Sponsor –
Expected Completion 2019
A 30% stake in a joint venture with Far East Organization
Integrated development comprising 3 hotels and 839 rooms – Village Hotel, The Outpost Hotel and
The Barracks Hotel
60-year leasehold interest from 7 March 2014
Far East H-REIT’s agreed proportion of investment is approx $133.1 million (of a total estimated cost of
$443.8 million)
Far East H-REIT entitled to purchase remaining 70% of the development should a sale be contemplated by
the Sponsor
Note: The pictures are artist’s impressions and may differ from the actual view
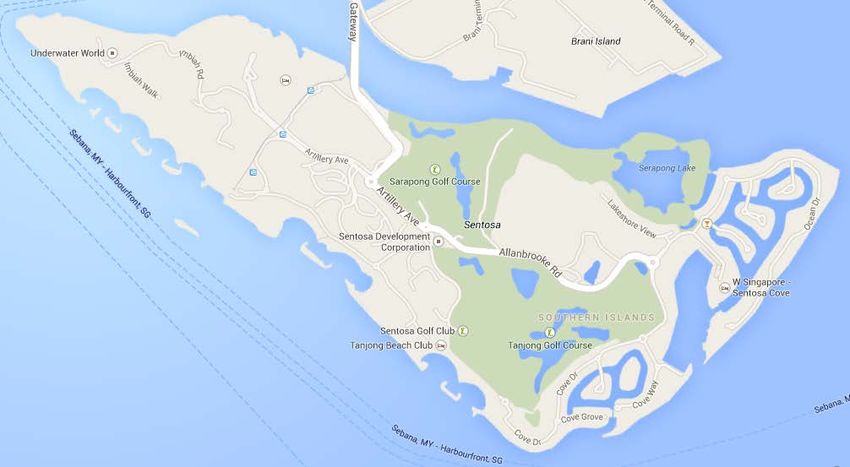
32Hotel Development on Sentosa with Sponsor –
Village Hotel, The Outpost Hotel and The Barracks Hotel
1 Amara Sanctuary Resort Sentosa
(140 keys)
2 Capella Singapore
5 (112 keys)
9
3 3 Costa Sands Resort
(49 keys)
6
4 4 Le Meridien Singapore
(191 keys)
5 Shangri-La’s Rasa Sentosa
1
Village Hotel, (454 keys)
The Outpost and 2 6 Siloso Beach Resort
The Barracks Hotel at (196 keys)
Sentosa The Singapore Resort & Spa
7
Sentosa
8
7 (215 keys)
8 W Singapore Sentosa Cove
(240 keys)
9 Resorts World Sentosa
• Festive Hotel (387 keys)
• Hard Rock Hotel (364 keys)
• Hotel Michael (476 keys)
• Equarius Hotel (183 keys)
• Crockfords Tower (by invite only)
• Beach Villas (22 keys)
Map of Sentosa Existing Heritage Hotels on Sentosa
Source: Google Maps Existing Hotels on Sentosa • Ocean Suites (11 keys)
• TreeTop Lofts (2 keys)
33Hotel Development on Sentosa with Sponsor –
Construction Progress
Construction of the 839-room hotel project is expected to complete in 2019
Note: Photos are as at February 2018
34Thank You
Key Contacts:
Gerald Lee Regina Yap
Chief Executive Officer Chief Financial Officer
Tel: +65 6833 6600 Tel: +65 6833 6677
Email: geraldlee@fareast.com.sg Email: reginayap@fareast.com.sgAppendix
Far East H-Trust Asset Portfolio Overview

                                                                                                           Hotels

                                           Village                                   The                             Oasia        Orchard           The       Rendezvous   Oasia             Total /
                                                      Village Hotel                         Village Hotel
                                         Hotel Albert                             Elizabeth                          Hotel        Parade           Quincy       Hotel &    Hotel            Weighted
                                                         Changi                                 Bugis
                                           Court                                    Hotel                           Novena         Hotel            Hotel       Gallery  Downtown           Average
                                                                                                                    Mid-tier /    Mid-tier /
Market Segment                               Mid-tier           Mid-tier            Mid-tier           Mid-tier                                    Upscale       Upscale       Upscale         NA
                                                                                                                    Upscale       Upscale
                                                                                                                                                 22 Mount
                                           180 Albert 1 Netheravon    24 Mount     390 Victoria   8 Sinaran                       1 Tanglin                  9 Bras Basah   100 Peck
                                                                                                                                                 Elizabeth
Address                                     Street,       Road,       Elizabeth,  Street, S’pore Drive, S’pore                   Road, S’pore                Road, S’pore Seah Street,
                                                                                                                                                Road, S’pore
                                         S’pore189971 S’pore 508502 S’pore 228518    188061         307470                         247905                       189559    S’pore 079333
                                                                                                                                                  228517

Date of Completion                         3 Oct 1994        30 Jan 19902        3 May 1993          19 Oct 1988   2 June 2011 20 June 19872 27 Nov 2008      5 June 20002    30 Dec 2015

# of Rooms                                     210                380                 256               393           428            388             108           298           314         2,775

Lease Tenure1                               70 years            60 years           70 years           61 years      87 years       45 years       70 years       66 years      65 years        NA

GFA/Strata Area (sq m)                       11,426              22,826             11,723             21,676        22,457        34,072           4,810        19,720         11,863

Retail NLA (sq m)                             1,003               805                 583              1,166           NA           3,778            NA           2,799           NA         10,134

Office NLA (sq m)                              NA                  NA                 NA                 NA            NA           2,509            NA            NA             NA         2,509

                                          First Choice    Far East          Golden                    Golden       Transurban      Far East         Golden                     Far East
                                                                                                                                                                Serene Land
Master Lessee / Vendor                     Properties   Organization Development                     Landmark      Properties      Orchard       Development                    SOHO
                                                                                                                                                                  Pte Ltd
                                             Pte Ltd   Centre Pte. Ltd. Private Limited               Pte. Ltd.     Pte. Ltd.      Limited      Private Limited                Pte. Ltd.

Valuation (S$ ‘mil)1                          123.3              216.0               162.6             232.0         330.0          421.5           81.4          275.9          210.0       2,052.7

     1 As  at 31 December 2017, except for Oasia Hotel Downtown which was acquired on 2 April 2018
     2   Date of acquisition by Sponsor, as property was not developed by Sponsor

                                                                                                                                                                                                       37
Far East H-Trust Asset Portfolio Overview
Serviced Residences
Village Residence Village Residence Village Residence Regency Total /
Clarke Quay Hougang Robertson Quay House Weighted Average
Market Segment Mid-tier Mid-tier Mid-tier Upscale NA
20 Havelock Road, 1 Hougang Street 91, 30 Robertson Quay, 121 Penang House,
Address
S’pore 059765 S’pore 538692 S’pore 238251 S’pore 238464
Date of Completion 19 Feb 1998 30 Dec 1999 12 July 1996 24 Oct 2000
# of Rooms 128 78 72 90 368
Lease Tenure1 75 years 76 years 73 years 76 years NA
GFA/Strata Area (sq m) 17,858 14,257 10,570 10,723 53,408
Retail NLA (sq m) 2,213 NA 1,179 539 3,931
Office: 1,474
Office NLA (sq m) NA NA 2,295 4,592
Serviced Office: 823
Master Lessee / Vendor Oxley Hill Properties Pte
OPH Riverside Pte Ltd Serene Land Pte Ltd Riverland Pte Ltd
Ltd
Valuation (S$ ‘mil) 1 197.4 64.5 107.7 168.5 538.1
1 As at 31 December 2017
38You can also read