Two Centuries-Long Streamflow Reconstruction Inferred from Tree Rings for the Middle Reaches of the Weihe River in Central China - MDPI
←
→
Page content transcription
If your browser does not render page correctly, please read the page content below
Article
Two Centuries-Long Streamflow Reconstruction
Inferred from Tree Rings for the Middle Reaches of
the Weihe River in Central China
Na Liu 1,2 , Guang Bao 1,2, *, Yu Liu 2 and Hans W. Linderholm 3
 1    Shaanxi Key Laboratory of Disaster Monitoring and Mechanism Simulating,
      College of Geography and Environment, Baoji University of Arts and Sciences, Baoji 721013, China;
      liuna_2000@163.com
 2    State Key Laboratory of Loess and Quaternary Geology, Institute of Earth Environment,
      Chinese Academy of Sciences, Xi’an 710061, China; liuyu@loess.llqg.ac.cn
 3    Regional Climate Group, Department of Earth Sciences, University of Gothenburg, Box 460,
      405 30 Gothenburg, Sweden; hans.linderholm@gvc.gu.se
 *    Correspondence: baoguang@bjwlxy.edu.cn

 Received: 20 January 2019; Accepted: 25 February 2019; Published: 26 February 2019

 Abstract: Water source is one of the most important concerns for regional society and economy
 development, especially in the Weihe River basin which is located in the marginal zone of the
 Asian summer monsoon. Due to the weakness of short instrumental records, the variations of
 streamflow during the long-term natural background are difficult to access. Herein, the average
 June–July streamflow variability in the middle reaches of the Weihe River was identified based on
 tree-ring width indices of Chines pine (Pinus tabulaeformis Carr.) from the northern slope of the
 Qinling Mountains in central China. Our model could explain the variance of 39.3% in the observed
 streamflow period from 1940 to 1970 AD. There were 30 extremely low years and 26 high years which
 occurred in our reconstruction for the effective span of 1820 to 2005. Several common dryness and
 wetness periods appeared in this reconstructed streamflow, and other tree-ring precipitation series
 suggested the coherence of hydroclimate fluctuation over the Weihe River basin. Some significant
 peaks in cycles implied the linkages of natural forcing on the average June–July streamflow of
 the Weihe River, such as the Pacific Decadal Oscillation (PDO) and El Niño-Southern Oscillation
 (ENSO) activities. Spatial correlation results between streamflow and sea surface temperature in
 the northern Pacific Ocean, as well as extremely low/high years responding to the El Niño/La
 Nina events, supported the teleconnections. The current 186-year streamflow reconstruction placed
 regional twentieth-century drought and moisture events in a long-term perspective in the Weihe River
 basin, and provided useful information for regional water resource safety and forest management,
 particularly under climate warming conditions.

 Keywords: tree rings; Weihe River; streamflow variability; reconstruction

1. Introduction
     Weihe River is the largest tributary of the Yellow River, China, with a basin area of 134,800 km2 .
The length of the Weihe River is 818 km, crossing three provinces of Gansu, Ningxia, and Shaanxi
in the eastern part of the Northwest China [1,2]. The upper reaches locate in the semi-arid region of
eastern Gansu and southern Ningxia, and the middle and down reaches locate in the semi-humid
region of Shaanxi. Hydroclimate in the Weihe River basin is mainly influenced by the Asian summer
monsoon, and is sensitive to climate anomalies [3,4]. Total annual precipitation over the basin is about
573 mm, and most precipitation occurs in the summer rainy season. The mean natural discharge is

Forests 2019, 10, 208; doi:10.3390/f10030208                                     www.mdpi.com/journal/forests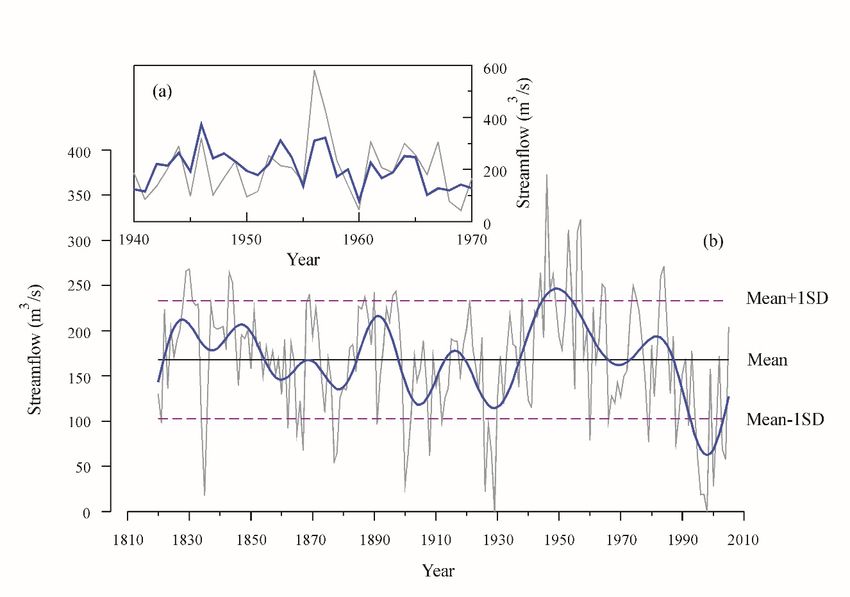
Forests 2019, 10, 208                                                                              2 of 14

10.4 × 10⁹ m3 , accounting for 17.3% of total annual runoff of the Yellow River. As the major water
source utilized for the middle and down reaches, the most important region of industrial–agricultural
production and ecosystem protection in Northwest China, the Weihe River plays an important role in
the sustainable development of Shaanxi province. The average water resources of the Weihe River
basin accounts for 17.4% of the total amount in Shaanxi, but it supports 63.6% of the population,
53% of the cultivated land area, 63.4% of the grain output and 64.8% of the gross domestic product
(GDP) of Shaanxi [5]. Compared to industrial water and domestic water consumption, the rate of
agricultural water is more than 60% of the total economic water consumption in the Weihe River in
Shaanxi Province based on the period of 1997 to 2013 [6]. However, due to the influences of human
activity and climate warming, water source availability has become a major limitation for regional
sustainability during the last decades [2]. The Weihe River runoff is mainly dominated by precipitation
which is strongly affected by the variations of the East Asian summer monsoon. The fluctuation
of runoff is consistent with variability in precipitation during dry and wet seasons on the annual
scale. Therefore, 415 reservoirs have been built in the middle and down reaches of the Weihe River
to effectively utilize water resources, with a total storage capacity of 2.202 × 10⁹ m3 [7]. There are
274 irrigation divisions, including the areas of facilities irrigation and water-saving irrigation which
are 11.32 × 10⁹ m2 and 71.95 × 10⁹ m2 , respectively [7]. In addition, previous study shows that the
synergistic effect of decreasing precipitation, increasing temperature, and increasing evaporation in
the Weihe River basin during the past decades has a negative influence on the runoff variations [8].
Therefore, human activities and climatic conditions mentioned above have significantly changed the
characteristics of runoff in the Weihe River.
     Enhancing the understanding of regional hydroclimatical change mechanisms and runoff
evolution characteristics is an urgent requirement for assessing current water resources security
and future planning. However, relative shorter hydrological observations limit us in identifying
hydrological variability during long historical periods. Tree-rings have proved to be one of the
effective proxies for hydroclimatical changes study prior to the measured period, due to its wide
spatial distribution, high resolution with an exact calendar, and sensitivity to hydroclimate [9].
     Several hydroclimatical studies based on tree rings have been performed in the Weihe River basin,
including seasonal precipitation reconstructions for the Huashan Mountain in the down reaches [10,11]
and Tianshui in the upper reaches of the river [3], as well as the drought variability estimation for the
Guiqing Mountain in Gansu province [12].
     However, runoff or streamflow tree-ring reconstructions conducted in the Weihe River have not
been reported. In this research, the variations of streamflow in the middle reaches were studied using
tree-ring samples of Chinese pine collected from the Nanwutai area (NWT), northern slope of the
Qinling Mountains. The relationships between the radial growth of pines, streamflow, and climatic
factors are discussed. The driving mechanisms of hydroclimatical variability in the Weihe River basin
need to be explored in the context of climatic circulation systems on the regional or global scale.
Spatial correlation patterns between streamflow and sea surface temperature anomalies in key ocean
areas is an effective method to establish remote linkages. Knowledge of atmospheric–ocean–land
teleconnections could be of benefit in the assessment and prediction of hydrological and climate change
over the Weihe River basin. Therefore, the features of the extreme streamflow event and teleconnection
with remote climate forcing were also analyzed.
     Our results provide the first hydrological reconstruction inferred from tree rings for the Weihe
River, which will be valuable for water resources management and planning in the future.

2. Materials and Methods

2.1. Tree-ring Data
   Increment cores from Chinese pine (Pinus tabulaeformis) were collected at the Nanwutai area
(NWT) (33◦ 580 –34◦ 020 N, 108◦ 570 –108◦ 590 E, elevation 1500 m–1600 m), northern slope of the Qinling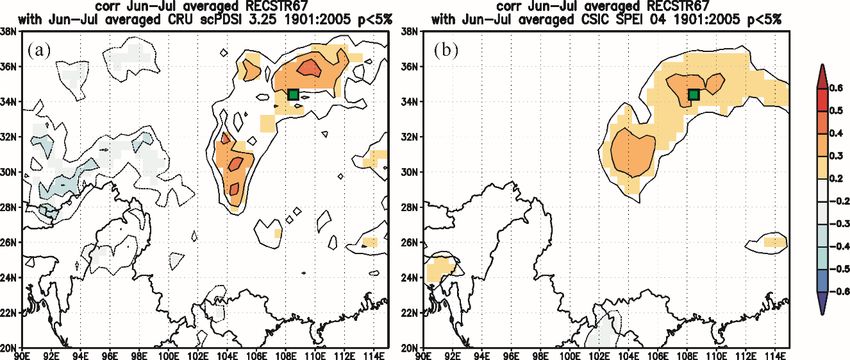
Forests 2019, 10, 208 3 of 14
Mountains [13]. To reveal the representativeness of the tree growth–climate response, we collected
the cores at three sampling sites where old trees concentrated. A total of 94 samples were from
three groups,
Forests 2019, 10, i.e.,
208 NWTa, NWTb, NWTc, 30 cores/17trees, 31 cores/18trees, and 33 cores/18trees, 3 of 14
respectively (Figure 1). All the samples were treated following the standard dendrochronological
procedures
procedures [14].The
[14]. Thering-width
ring-widthwas was measured
measured using
using the
theLintab
Lintabsystem
systemwithwitha precision
a precision of of
0.01 mm
0.01 mm
(www.rinntech.de), then each tree-ring
(www.rinntech.de), then each tree-ring series series were given an accurate calendar year after cross-dating
given an accurate calendar year after cross-dating
process
process performedby
performed by the
the output
outputofofCOFECHA
COFECHA software
software [15]. ThenThen
[15]. each each
dateddated
ring-width series was
ring-width series
detrended and standardized to tree-ring width indices utilizing the ARSTAN
was detrended and standardized to tree-ring width indices utilizing the ARSTAN software [16]. software [16]. Negative
exponential
Negative or linear regressions
exponential were applied
or linear regressions to remove
were appliedthe to age-related
remove thegrowth trends growth
age-related for 91 cores,
trends
and 3 cores from two trees were treated by cubic smoothing splines. Standard
for 91 cores, and 3 cores from two trees were treated by cubic smoothing splines. Standard tree-ring tree-ring width
chronologies were established for NWTa, NWTb, NWTc and the variation and the sample depth are
width chronologies were established for NWTa, NWTb, NWTc and the variation and the sample depth
shown in Figure 2. Similar variability features were displayed by three groups, and significant
are shown in Figure 2. Similar variability features were displayed by three groups, and significant
correlation coefficients existed between three chronologies, i.e., 0.657 (p < 0.001, 1816–2005 for NWTa
correlation coefficients existed between three chronologies, i.e., 0.657 (p < 0.001, 1816–2005 for NWTa
and NWTb), 0.666 (p < 0.001, 1765–2005 for NWTa and NWTc) and 0.724 (p < 0.001, 1816–2005 for
and NWTb), 0.666 (p < 0.001, 1765–2005 for NWTa and NWTc) and 0.724 (p < 0.001, 1816–2005 for
NWTb and NWTc). Therefore, the regional standard chronology NWTabc were built based on 94
NWTb and NWTc). Therefore, the regional standard chronology NWTabc were built based on 94 cores
cores from 53 trees for the study area (Figure 2). The full length of NWTabc covered the period of
from
176053totrees for the
2005AD. Thestudy
meanarea (Figureand
sensitivity 2). The full length
all series of NWTabc
correlation covered
were 0.193 the period
and 0.448, of 1760 to
respectively.
2005AD. The mean sensitivity and all series correlation were 0.193 and 0.448,
Statistical characteristics of the common span from 1880 to 2005 as follows, expressed population respectively. Statistical
characteristics of the common span from 1880 to 2005 as follows, expressed population
signal (EPS) was 0.948, signal-to-noise ratio (SNR) was 18.146, and variance in the first eigenvector signal (EPS)
waswas0.948,
30.6%.signal-to-noise
To make sureratio (SNR) was
the reliability 18.146,
of the and variance
reconstruction, in the first
subsample eigenvector
signal was was
strength (SSS) 30.6%.
Toused
maketosure the reliability
identify the adequacyof theofreconstruction, subsample
replication of NWTabc signal strength
chronology [17]. We(SSS) was used
restricted theto identify
further
theanalysis
adequacy to of
thereplication
period from of NWTabc
1820 to 2005chronology
with the [17].
SSSWe restricted
value greaterthe further
than 0.80,analysis
and thetofirst
the year
period
from 1820 to9 cores
included 2005 withfrom the SSS value greater than 0.80, and the first year included 9 cores from 5 trees.
5 trees.
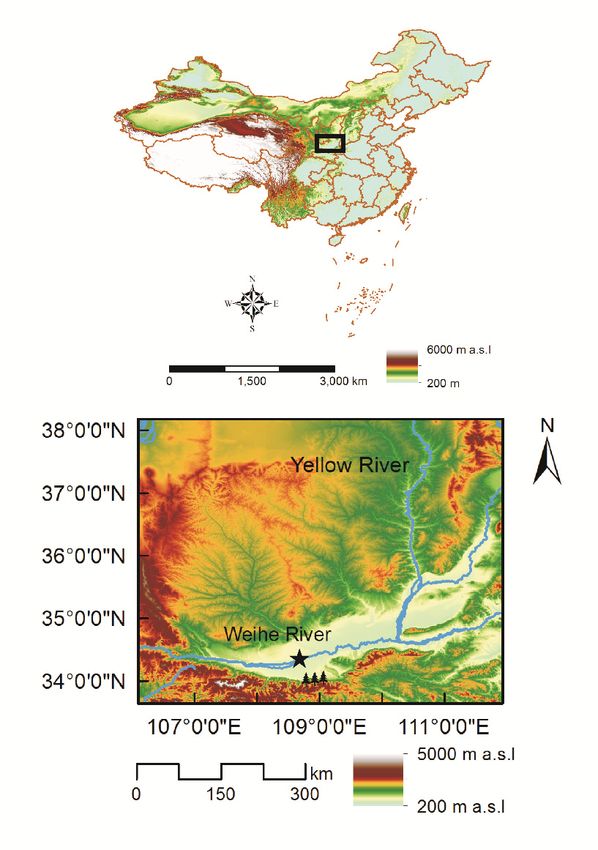
Figure 1. Map of the study area (black rectangle) and locations of the sample site (black tree) and
Xianyang
Figure 1.hydrological
Map of the station (black
study area star).
(black rectangle) and locations of the sample site (black tree) and
Xianyang hydrological station (black star).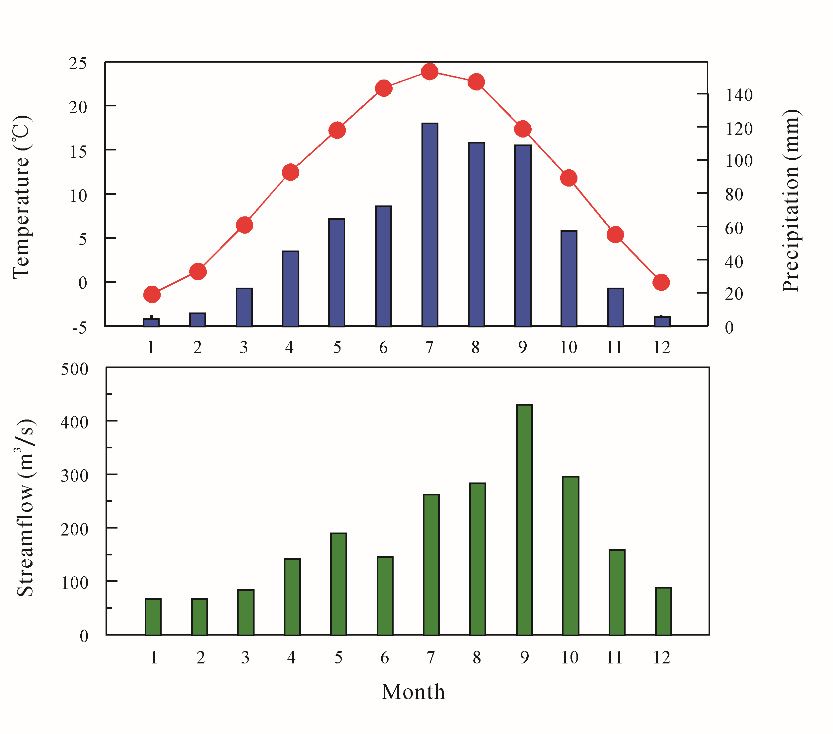
Forests 2019, 10, 208                                                                                            4 of 14

     Forests 2019, 10, 208                                                                                   4 of 14

           Figure 2. Single groups and composited regional tree-ring width standard chronologies (NWTa, NWTb,
     Figure   2. Single
          NWTc,         groups and
                  and NWTabc),  andnumbers
                                     composited  regional
                                           of sample cores. tree-ring width standard chronologies (NWTa,
     NWTb, NWTc, and NWTabc), and numbers of sample cores.
     2.2. Climatic and Hydrological Data
         Regional
2.2. Climatic     monthly average
              and Hydrological Datatemperature and precipitation from CRU (Climate Reach Unit) TS4.01
     grid data within the range of 34◦ –35◦ N and 107◦ –109◦ E [18], and monthly streamflow data of
      Regional
     the Xianyangmonthly    averagestation
                    hydrological      temperature      and precipitation
                                             in the middle                 from
                                                              reaches of the      CRU
                                                                              Weihe     (Climate
                                                                                      River        Reach
                                                                                            (108◦ 42       Unit)
                                                                                                     0 E, 34       TS4.01
                                                                                                             ◦ 190 N,
grid with
      dataa within  thearea
            catchment     range   of 34°–35°N
                              46,827               and by
                                      km2 ) provided     107°–109°E
                                                           Hydrology[18],    andof monthly
                                                                        Bureau     the Yellowstreamflow     data of the
                                                                                               River Conservancy
Xianyang    hydrological
     Commission              stationtoinexplore
                   were selected          the middle     reaches
                                                the response       of the Weihe
                                                                relationships      Rivertrees’
                                                                              between     (108°42'E,   34°19'N,and
                                                                                               radial growth       with a
catchment
     climatic area 46,827 elements
              hydrological   km2) provided
                                        (Figure 1).byThe
                                                       Hydrology      Bureaushowed
                                                         calculation results   of thethat
                                                                                        Yellow   River
                                                                                          the study  area Conservancy
                                                                                                           was cold
     and dry inwere
Commission       winterselected
                        while hot toand  wet inthe
                                     explore    summer,    indicating
                                                      response        East Asianbetween
                                                                 relationships    monsoon trees’
                                                                                            climateradial
                                                                                                    characteristics
                                                                                                           growth and
climatic hydrological elements (Figure 1). The calculation results showed that the study area was cold
and dry in winter while hot and wet in summer, indicating East Asian monsoon climate
characteristics (Figure 3). The average annual precipitation in the region was 642.59 mm, the
maximum precipitation 121.97 mm occurred in July, and the minimum amount of precipitation in
Forests 2019, 10, 208
Forests 2019, 10, 208 5 of 14
5 of 14
January was 4.25mm over the period 1940 to 2005. The annual average temperature was 11.63°C, the
(Figure 3). The average annual precipitation in the region was 642.59 mm, the maximum precipitation
highest and lowest monthly average temperatures appeared in July (23.95°C) and January (−1.38°C),
121.97 mm occurred in July, and the minimum amount of precipitation in January was 4.25 mm
respectively. Many
over the periodwater
1940 toconservancy
2005. The annualprojects
averagehave been developed
temperature was 11.63 ◦ C,since the 1970s
the highest in the upper
and lowest
reaches monthly
of the Weihe
averageRiver, and natural
temperatures runoff
appeared changes
in July ◦
(23.95 C) have
andbeen
Januarysignificantly
◦ affected by human
(−1.38 C), respectively.
activities [2,19]. Therefore, monthly streamflow during the period from 1940 to 1970 was
Many water conservancy projects have been developed since the 1970s in the upper reaches selected for
of the
Weihe River, and natural runoff changes have been significantly affected
subsequent analysis. The high-value period of the streamflow appeared from July to Septemberby human activities [2,19].
Therefore, monthly streamflow during the period from 1940 to 1970 was selected for subsequent
during the monsoon rain season (Figure 3). The maximum flow occurred in September, but not in
analysis. The high-value period of the streamflow appeared from July to September during the
July, indicated
monsoonthatrain there
seasonwas a lag
(Figure effect
3). The in the river
maximum basin convergence
flow occurred in September, but process. It should
not in July, be pointed
indicated
out thatthat
the there
streamflow
was a lagineffect
Juneinwas the smallest
the river one during
basin convergence the growing
process. period
It should be from
pointed outMay to October.
that the
The main possibleinreason
streamflow June was could be due
the smallest toduring
one moretheevaporation
growing period lossfrom
relating
May totoOctober.
higherThe temperatures
main in
possible reason could
June, resulting in less runoff. be due to more evaporation loss relating to higher temperatures in June, resulting
in less runoff.
Figure 3. Monthly total precipitation (blue bar) and mean temperature (red circle) from CRU TS4.01
Figure 3. Monthly
grid total
data within range of 34◦ –35◦(blue
theprecipitation 107◦ –109
N andbar) and◦ Emean temperature
(1940–2005), and mean(red circle) (green
streamflow from bar)
CRU TS4.01
of Xianyang hydrological station (1940–1970).
grid data within the range of 34°-35°N and 107°–109°E (1940–2005), and mean streamflow (green bar)
of Xianyang hydrological
2.3. Statistical Methods station (1940–1970).
The relationships between climate/streamflow factors and tree-ring width index were performed
2.3. Statistical Methodscorrelation analysis in this study [14]. Considering tree growth is affected by
using Pearson
Theenvironmental
relationshipsconditions
betweeninclimate/streamflow
the present growing season, as well as by factors in the previous
factors and tree-ring width index were performed
year [14], previous October to current September data were selected for growth response analysis.
using Pearson correlation analysis in this study [14]. Considering tree growth is affected by
The linear regression model and split calibration–verification were employed to identify the reliability
environmental conditions
of streamflow in the present
reconstruction growingstatistics
[16]. Verification season,as well asofby
of reduction factors
error (RE), in the previous
coefficient of year
[14], previous
efficiencyOctober
(CE), andtothe
current
sign testSeptember
(ST) were givendata[16].
were selected
Positive forof growth
values RE and CEresponse
suggested analysis.
the The
regression model was valid and skillful for reconstruction. The ST demonstrated the
linear regression model and split calibration–verification were employed to identify the reliability of numbers of
agreements and disagreements between the estimated and measured streamflow data [14]. All the
streamflow reconstruction [16]. Verification statistics of reduction of error (RE), coefficient of
statistical results were performed using the software of Statistical Program for Social Sciences 19.
efficiency (CE), and the sign test (ST) were given [16]. Positive values of RE and CE suggested the
Cycles of the dominant oscillation signals in streamflow series were done by spectral analysis of the
regression model method
multi-taper was valid
(MTM) and skillful
[20]. The MTM for analysis
reconstruction. Thereveal
could exactly ST demonstrated the numbers of
the signals of oscillation
agreements and disagreements between the estimated and measured streamflow data [14]. All the
statistical results were performed using the software of Statistical Program for Social Sciences 19.
Cycles of the dominant oscillation signals in streamflow series were done by spectral analysis of the
multi-taper method (MTM) [20]. The MTM analysis could exactly reveal the signals of oscillationForests 2019, 10, 208 6 of 14
modes in reconstructed streamflow series based on a couple of tapers reducing the variance of spectral
estimates. Parameters including red noise background estimation with the resolution of 2 and taper
numbers of 3 were performed in this study [20]. To explore regional hydroclimatical variations and
teleconnections reflected by current streamflow reconstruction, spatial correlations of our reconstructed
streamflow with the gridded data including Standard precipitation evapotranspiration Index (SPEI)
on the four-month scale [21], self-calibrating Palmer Drought Severity Index (scPDSI) [22] and sea
surface temperature (SST) dataset of ERSST (Extended Reconstructed Sea Surface Temperature) v5 [23]
were conducted for the period 1901 to 2005 through the online tool of KNMI (The Royal Netherlands
Meteorological Institute) climate explorer (http://climexp.knmi.nl).
3. Results and Discussion
3.1. Climate/Streamflow-Growth Response
The responses of tree radial growth to climatic factors showed that the NWTabc chronology was
significantly positively correlated with precipitation in June (r = 0.572, n = 31, 1940–1970, p < 0.01),
significantly negatively correlated with temperature in June (r = −0.401, n = 31, 1940–1970, p < 0.05),
and not correlated with precipitation and temperature in July, indicating that the growth of Pinus
tabulaeformis was very sensitive to humidity conditions before the East Asian monsoon season started
in July. Due to the river basin convergence process which mainly includes precipitation, surface
infiltration, soil saturation, slope convergence, and river network convergence, a lag effect existed
in the response of river runoff forming to precipitation. Therefore, the regional tree-ring chronology
significantly correlated with the average June–July streamflow of the Weihe River, which inevitably
reflected the hysteresis effect. Significant correlations occurred between June–July streamflow, June
precipitation (r = 0.753, n = 31, p < 0.01) and June temperature (r = −0.568, n = 31, p < 0.05),
while no responses existed in July precipitation and temperature. Runoff reflected the combined
effects of climatic factors, such as temperature and precipitation, in the basin. Therefore, using the
tree-ring chronology to reconstruct the average June–July streamflow of the Weihe River had a reliable
physiological significance and physical basis (Figure 4).
3.2. Streamflow Reconstruction
Based on the analyses results mentioned above, the average June–July streamflow was
reconstructed following the transfer function: Qs = 309.208 × NWTabc − 140.02 (r = 0.627, n = 31,
F = 18.779, p < 0.0001), where Qs means the average June–July streamflow in the Weihe River.
The Durbin–Watson value 1.341 (p < 0.05) suggests no significant first-order autocorrelation in the
residuals of the regression model [14]. This function could explain the variance of 39.3% over
the observed streamflow period 1940 to 1970 (37.2% considering the loss of degrees of freedom).
The variations between reconstructed and observed streamflow agree quite well (Figure 5).
The reconstructed sequence reveals hydrological variability during the last 196 years in the Weihe
River. Reduction of error (RE) and Coefficient of efficiency (CE) were used to identify shared variance
between observation and reconstruction series, and both statistics had a theoretical range from −∞ to
+1. Positive RE and CE values demonstrated that the model was skillful and acceptable for streamflow
reconstruction. Statistics results indicate that RE (0.191, 0.271) and CE (0.142, 0.243) were positive in
both verification periods of 1960 to 1970 and 1940 to 1959, confirming our model is acceptable and
skillful for streamflow reconstruction (Table 1). The ST was applied to check the numbers of agreement
or disagreement signs between the paired observed and estimated departures from the series mean.
The ST in the calibration spans 1940 to 1959 (15+/5−), and 1960 to 1970 (9+/1−) were at the 0.05
significant level, and, particularly, the ST result (24+/7−) in the full span 1940 to 1970 was at the 0.01
significant level.Forests 2019, 10, 208 7 of 14
Forests 2019, 10, 208 7 of 14
Figure 4. Correlations of tree-ring standard chronology with monthly average streamflow (grey bar)
Figure 4. Correlations
of Xianyang of tree-ring
hydrological standard chronology
station (1940–1970) with monthly
from the previous average
October (P10)streamflow (grey bar)
to current September
of Xianyang
(C9) hydrological
at the 95% confidencestation (1940–1970)
level (triangle) andfrom the previous
99% confidence October
level (P10)
(cross). to current
P indicates September
previous year,
(C9) at the 95%
C indicates confidence
current year andlevel
C67(triangle)
indicatesand
the99% confidence
average level
June–July (cross). P indicates
streamflow previous
in the current year.year,
C indicates current year and C67 indicates the average June–July streamflow in the current year.
Table 1. Statistics of split calibration-verification for June–July streamflow reconstruction model.
3.2. Streamflow Reconstruction
Calibration Verification
Based
Periodon the analyses
r R2
results mentioned
ST Period above, the r average R2 June–July
RE streamflow
CE ST was
reconstructed
1940–1959 following
0.647 ** the transfer
0.419 function:
15 * Qs =
1960–1970 309.208 × NWTabc
0.672 * −
0.451 140.02 (r =
0.191 0.1420.627, n =
9 *31, F =
18.779, p < 0.0001),0.672
1960–1970 where * Qs0.451 means 9the* average
1940–1959 June–July
0.647 **streamflow
0.419 in0.271the Weihe
0.243 River.11 The
1940–1970 0.627 ** 0.393 24 **
Durbin–Watson value 1.341 (p < 0.05) suggests no significant first-order autocorrelation in the
residuals *of the pregression
means < 0.05, ** p < model [14]. This
0.01. RE means function
reduction of error;could explainofthe
CE, coefficient variance
efficiency, ofsign
and ST, 39.3%
test. over theForests 2019, 10, 208 8 of 14
observed streamflow period 1940 to 1970 (37.2% considering the loss of degrees of freedom). The
variations between reconstructed and observed streamflow agree quite well (Figure 5).
Forests 2019, 10, 208 8 of 14
Figure 5. Comparisons (a) between reconstructed (bold line) and observed (thin line) average June–July
Figure 5. Comparisons
streamflow (a) between
during the period reconstructed
of 1940 to 1970, and (bold line) and observed
(b) variations (thin line)reconstruction
of the streamflow average June–
July streamflow during the period of 1940 to 1970, and (b) variations of the streamflow reconstruction
during the entire span of 1820 to 2005 for the middle reaches of the Weihe River (the bold line indicates
during
the the entire
20-year spandata,
low pass of 1820
theto 2005 for the
horizontal linemiddle reaches
indicates of the Weihe
the mean River
value and (the boldhigh
extremely line indicates
and low
the 20-year
values with low pass data,deviation).
one standard the horizontal line indicates the mean value and extremely high and low
values with one standard deviation).
3.3. Variation Features of Streamflow of the Weihe River
The estimated
The reconstructedmeansequence
June–Julyreveals hydrological
streamflow was 168.01 variability
m3 /s, and during the of
the value last 196 years
standard in the
deviation
Weihe River. Reduction of error (RE) and Coefficient of efficiency (CE) were used
(SD) was 65.22 m3 /s over the period of 1820 to 2005 AD. Extreme high and low years were determined to identify shared
variance
when thebetween observation
reconstructed valuesandwere reconstruction
higher or lowerseries,
oneandSD both
than statistics had amean
the long-term theoretical range
streamflow.
from −∞ to +1. Positive RE and CE values demonstrated that the model was
Based on these criteria, 30 extremely low years and 26 high years occurred in our reconstruction,skillful and acceptable
for streamflow
and they accounted reconstruction.
for 16.13% and Statistics
13.98%results
of the indicate that of
entire period REthe(0.191, 0.271)respectively
186 years, and CE (0.142, 0.243)
(Figure 5).
were positive in both verification periods of 1960 to 1970 and 1940 to 1959,
It should be noted that negative values were found in the two extremely lowest years of 1929 confirming our model is
acceptable and skillful for streamflow reconstruction (Table 1). The ST was
and 1998, suggesting the extremely dry conditions beyond the range of the calibration variations. applied to check the
numbers
A similar of agreement
situation or disagreement
occurred signs between
in the reconstruction the pairedstreamflow
of seasonal observed and estimated
inferred fromdepartures
tree rings
in the Mongolian plateau [24]. We modified the negative values with zero in Table to
from the series mean. The ST in the calibration spans 1940 to 1959 (15+/5−), and 1960 2. 1970 (9+/1−)
The lowest
were at the 0.05 significant level, and ,particularly, the ST result (24+/7−) in the
values appeared in eight years, including 1929 (Forests 2019, 10, 208 9 of 14
Table 2. Extreme events of reconstructed June–July streamflow of the Weihe River.
Extreme Low Extreme High Value
Year Year
Value (m3 /s) (m3 /s)
1821 98.07 1829 265.97
1834 101.78 1830 268.13
1835 17.68 1831 233.50
1862 91.89 1843 264.11 b
1865 86.01a 1844 253.29
1867 67.46 1869 240.31
1877 55.40 a 1887 237.52 b
1878 64.68 a 1890 242.78 b
1891 96.21 a 1896 239.07 b
1900 29.12 a 1897 243.71
1901 63.44 a 1921 233.81 b
1908 61.89 1938 235.67
1912 98.38 a 1944 264.11
1926 22.00 a 1946 372.65 b
1927 96.83 1947 242.47
1928 65.91 1948 262.26
1929 0.00 1953 311.42 b
1960 78.59 1954 247.11
1966 100.85 a 1956 309.26 b
1979 77.04 a 1957 322.86 b
1988 76.43 1964 251.13
1992 95.29 a 1965 246.80
1995 58.49 1974 249.58 b
1996 18.91 1975 237.83 b
1997 19.22 a 1983 259.79
1998 0.00 1984 271.23 b
2000 28.19
2001 84.77
2003 69.00
2004 57.56
Note: a indicates the El Niño year; b indicates La Nina year.
Standard precipitation evapotranspiration Index (SPEI) and self-calibrating Palmer Drought
Severity Index (scPDSI) are widely used for dry and wet change studies in different regions and
time-scales around the world [25,26]. Considering the time lag effect of runoff to precipitation
and the multi-time scale properties of SPEI, four-month scale SPEI data were selected for analysis.
The spatial correlation results showed that the reconstructed June–July streamflow was significantly
positively correlated with both drought indices in the middle reaches of the Weihe River, indicating that
different indicators had a similar ability to capturing hydroclimatical variations (Figure 6). Therefore,
the reconstructed streamflow sequence could be proved to reflect regional hydrological variability in
the study area within the Weihe River basin. Less precipitation tended to result in lower streamflow.
Several extremely low values years (Several extremely low values years (
Forests 2019, 10, 208                                                                                            11 of 14

     Significant spectrum peaks of June–July streamflow at 78.74a (p < 0.1), 72.99a (p < 0.1), 68.49a
(p < 0.1), 64.10a (p < 0.1), 60.24a (p < 0.1), 35.34a (p < 0.1), 34.13a (p < 0.1), 27.70a (p < 0.1), 26.95a
(p < 0.1), Figure
            26.25a 7.
                    (pSpatial
                       < 0.1), correlations
                               25.58a (p < between     reconstructed
                                            0.1), falling            June–July
                                                          in the range  of 50 tostreamflow
                                                                                 70a as wellfor
                                                                                              asthe
                                                                                                 20 Weihe
                                                                                                    to 30a River  and
                                                                                                           variability
of the PDO, supported the close linkages between of the Weihe River and north Pacific ocean on(pthe
           the average   May–July   sea surface temperature   of NCDC   ERSSTv5    during the period 1940 to 2005   <
           0.1). All
multi-decadal        trends in the data were removed. The sampling site marked by a green rectangle.
                  scales.

      Figure 8. Cycles results of multi-taper spectrum (MTM) analyses for reconstructed June–July
      streamflow   forCycles
           Figure 8.  the period  1820oftomulti-taper
                              results      2005. The confidence   intervalanalyses
                                                      spectrum (MTM)        at 99%, 95%, and 90% for peaks
                                                                                    for reconstructed June–July
      in the power  spectrum  was  indicated by the red, green, and blue lines.
           streamflow for the period 1820 to 2005. The confidence interval at 99%, 95%, and 90% for peaks in the
           power spectrum was indicated by the red, green, and blue lines.
      Significant short cycles were also identified at 10.24a (p < 0.05), 10.14a (p < 0.05), ~8.98–9.66a
(p < 0.01),Significantly
             ~3.75a (p < negative
                           0.01), ~2.62   a (p < 0.01),
                                      correlation    areasand  ~2.09ain
                                                           occurred    (pthe
                                                                           < 0.01).  Particularly,
                                                                              SST over              thePacific
                                                                                          the eastern   ~2–3aOcean
                                                                                                                periodsalong
suggested
    the North the America
                   strong teleconnections      between streamflow
                             west coast. Meanwhile,                      variations
                                                           positive correlation       in the Weihe
                                                                                  occurred     in the River and ENSO.
                                                                                                      central-north   Pacific
TheOcean
     similar(Figure
               frequency    cycles hadthe
                       7) suggesting      been  revealed in
                                             streamflow       other precipitation
                                                            variability               reconstructions
                                                                          may be modulated       by the obtained
                                                                                                         PDO. In thefromPDO
treewarm
     rings phase,
             in Tianshui    [3] and  Huashan      [10], two  studies  conducted     in the  upper   reaches
                      negative precipitation abnormality causing more droughts occurred in North China due   and  down
reaches  ofweak
    to the    the Weihe
                     summer River,  respectively.
                                monsoon     and theThe     PDSI
                                                       strong     variationshigh
                                                               subtropical     overwith
                                                                                      central   and southern
                                                                                           its position        parts
                                                                                                        locating       of the
                                                                                                                   far to
Shaanxi  province     and  the  southeastern    Gansu    province, i.e., the Weihe   River   basin,
    south and west [31], whereas positive precipitation abnormality occurred in the middle and down showed   an inverse
relationship
    reaches with
               of thethe Niño 3.4River
                        Yangtze     indexandin the  period
                                                 South      1960 associating
                                                         China   to 2009 [35].with
                                                                                Reconstructed
                                                                                       more flood events of the El[27,32,33].
                                                                                                     conditions     Niño
andDuring
     La Ninathe  forcold
                     the phase,
                         period the
                                  from   1525  to  2002AD    provide
                                      situations were opposite [34].  another   evidence     that the extreme  dryness
(lower streamflow value) or wetness (higher streamflow value) conditions reflected the positive or
negative phase of ENSO (Rable 2) [36]. Twelve El Niño and 12 La Nina events occurred in the estimated
June–July streamflow series, accounting for 40% of the extreme dryness years and 46.15% of the extreme
wetness years, respectively. Several lower streamflows in our reconstruction also were also consistent
with the El Niño events identified for eastern Northwest China based on the Niño 3.4 index mentioned
above, including 1966, 1992, 1997, and 2003. Two higher streamflow years coincided with the La Nina
events in 1974 and 1975 [35].
      The close relationships between hydroclimatical fluctuations in proximity to the Weihe River
basin and remote oceans driving, such as the PDO and ENSO, have been demonstrated from several
dendrohydrologial studies in the main tributaries of the Jinghe River, i.e., Kongtong Moutain [37] and
Luohe River, i.e., Huanglong [38] within the Weihe River basin.
Forests 2019, 10, 208 12 of 14
4. Conclusions
A robust regional tree-ring width chronology with the period from 1760 to 2005 AD was developed
based on three groups samples of Chinese pine for the middle reaches of the Weihe River, in Central
China. The highest significant correlation existed between regional chronology and average June–July
streamflow. Therefore, a simple regression model was designed, and 39.3% of the actual variance
for the calibration 1940 to 1970 AD was explained. Verification statistics proved the regression
model was reliable and skillful to hydrology study for the confidence span from 1820 to 2005 AD.
During the past 186 years, extremely low and high flow events occurred in 30 years and 26 years,
respectively. The higher streamflow periods of 1820s–1840s, 1890s, 1940s–1960s, and the lower periods
of 1860s–1870s, 1900s, 1920s–1930s, 1990s–2000s were identified. The significant decreasing trend
occurred in the form moisture epoch in 1950s to the drought epoch in 1990s during the second half
of the 20th century. Commonly, regional drought and moisture intervals captured in our streamflow
reconstruction suggested it is representative of regional hydroclimate conditions over the Weihe
River basin area. Significant spectral peaks were found on the multi-decadal and inter-annual scales,
in the range of the bandwidths for natural climate oscillations, such as the PDO and ENSO. Spatial
correlation patterns between streamflow and northern Pacific sea surface temperature, in addition to
extreme streamflow events coinciding with the phase of ENSO activity, demonstrated the opposite
relationships of regional streamflow variability with large-scale circulation systems mentioned above.
This is the first hydrological reconstruction obtained from tree rings for the Weihe River. Our results
demonstrate that there is great potential for recovering the characteristics and mechanisms of long-term
hydrological changes in the Weihe River basin based on the relationships between the radial growth
of trees and hydrological climatic factors. The reconstructed June–July streamflow results provide a
new perspective for regional water resource assessment and forest protection in the Weihe River basin,
which is useful to improve the adverse impacts of regional water cycles caused by global warming.
Author Contributions: Conceptualization, G.B. and N.L.; Data curation, G.B. and N.L.; Formal analysis, G.B.
and N.L.; Funding acquisition, G.B., N.L. and Y.L.; Investigation, G.B. and N.L.; Methodology, G.B., N.L. and
Y.L.; Project administration, G.B. and N.L.; Supervision, Y.L. and H.W.L; Writing-original draft, G.B. and N.L.;
Writing-review and editing, G.B., N.L., Y.L. and H.W.L.
Funding: This work is supported by the Natural Science Basic Research Plan in Shaanxi Province of China
(2018JQ4022); Shaanxi Key Laboratory of Disaster Monitoring and Mechanism Modeling (17JS005), Key program of
the Baoji University of Arts and Sciences (ZK2018047), Second Outstanding Young Talents of Shaanxi Universities
(2018), State Key Laboratory of Loess and Quaternary Geology (SKLLQG1711, SKLLQG1801) and the Young
Scientist Project of Shaanxi Province (2016KJXX-41).
Acknowledgments: We thank B.F. Shen, R.Y. Wang, and W.P. Wang for their great assistance in the fieldwork.
We also acknowledge the reviewers for their constructive comments to improve the manuscript.
Conflicts of Interest: The authors declare no conflict of interest.
References
1. Song, J.X.; Wang, L.P.; Dou, X.Y.; Wang, F.J.; Guo, H.T.; Zhang, J.L.; Zhang, G.T.; Liu, Q.; Zhang, B.
Spatial and depth variability of streambed vertical hydraulic conductivity under the regional flow regimes.
Hydrol. Process. 2018, 32, 3006–3018. [CrossRef]
2. Du, J.; Shi, C.X. Effects of climatic factors and human activities on runoff of the Weihe River in recent decades.
Quat. Int. 2012, 282, 58–65. [CrossRef]
3. Chen, F.; Yuan, Y.J.; Wei, W.S.; Fan, Z.A.; Yu, S.L.; Zhang, T.W.; Zhang, R.B.; Shang, H.M.; Qin, L.
Reconstructed precipitation for the north-central China over the past 380 years and its linkages to East Asian
summer monsoon variability. Quat. Int. 2013, 283, 36–45. [CrossRef]
4. Fang, K.; Guo, Z.; Chen, D.; Linderholm, H.W.; Li, J.; Zhou, F.; Gou, G.; Dong, Z.; Li, Y. Drought variation
of western Chinese Loess Plateau since 1568 and its linkages with droughts in western North America.
Clim. Dyn. 2017, 49, 3839–3850. [CrossRef]
5. Luo, W.G.; Guo, Z.Z.; Kou, X.M. Status Assessment and Improvement Measures Study on Ecological Water
Volume in Wei River. Northwest Hydropower 2018, 6, 99–103.Forests 2019, 10, 208 13 of 14
6. Li, X.J.; Zhang, J.L.; Song, J.X.; Yang, X.G. Response of runoff to economic water consumptions of the Weihe
River in Shaanxi Province. Arid Land Geogr. 2016, 39, 265–274.
7. Li, S.W.; Jin, l.P.; Zhang, J.; Jiang, T. Several advices on developments of water resources in Guanzhong
region. Shaanxi Water Resour. 2018, 2, 197–200.
8. Sun, Y.; Li, D.L.; Zhu, Y.J. Advances in study about runoff variation of the Weihe River and its response to
climate change and human activities. J. Arid Meteor. 2013, 31, 396–405.
9. Zhang, Z. Tree-rings, a key ecological indicator of environment and climate change. Ecol. Indic. 2015, 51,
107–116. [CrossRef]
10. Hughes, M.K.; Wu, X.; Shao, X.; Garfin, G. A preliminary reconstruction of rainfall in north-central China
since A.D. 1600 from tree-ring density and width. Quat. Res. 1994, 42, 88–99. [CrossRef]
11. Chen, F.; Zhang, R.; Wang, H.; Qin, L.; Yuan, Y. Updated precipitation reconstruction (AD 1482–2012) for
Huashan, north-central China. Theor. Appl. Climatol. 2016, 123, 723–732. [CrossRef]
12. Fang, K.; Gou, X.; Chen, F.; D’Arrigo, R.; Li, J. Tree-ring based drought reconstruction for the Guiqing
Mountain (China): linkages to the Indian and Pacific Oceans. Int. J. Climatol. 2010, 30, 1137–1145. [CrossRef]
13. Liu, N. The dendroclimatology study on the northern slope of the Qinling Mountains. Master’s Thesis, Xi’an
Jiaotong University, Xi’an, China, May 2009.
14. Fritts, H.C. Tree-Rings and Climate; Academic Press: London, UK, 1976.
15. Holmes, R.L. Computer-assisted quality control in tree-ring dating and measurement. Tree-Ring Bull. 1983, 43,
69–95.
16. Cook, E.R.; Kairiukstis, L.A. Methods of Dendrochronology: Applications in the Environmental Sciences; Kluwer
Academic Publishers: Boston, MA, USA, 1990.
17. Wigley, T.; Briffa, K.R.; Jones, P.D. On the average value of correlated time series, with applications in
dendroclimatology and hydrometeorology. J. Appl. Meteorol. Climatol. 1984, 23, 201–213. [CrossRef]
18. Mitchell, T.D.; Jones, P.D. An improved method of constructing a database of monthly climate observations
and associated high-resolution grids. Int. J. Climatol. 2005, 25, 693–712. [CrossRef]
19. Li, B.; Xie, J.C.; Hu, Y.H.; Jiang, R.G. Analysis of variation and abruption of annual runoff in middle and
lower Weihe River. Hydro-Sci. Eng. 2016, 3, 61–69.
20. Mann, M.E.; Lees, J. Robust estimation of background noise and signal detection in climatic time series.
Clim. Chang. 1996, 33, 409–445. [CrossRef]
21. Vicente-Serrano, S.M.; Beguería, S.; López-Moreno, J.I. A multiscalar drought index sensitive to global
warming: the standardized precipitation evapotranspiration index-SPEI. J. Clim. 2010, 23, 1696–1718.
[CrossRef]
22. Wells, N.; Goddard, S.; Hayes, M.J. A self–calibrating Palmer Drought Severity Index. J. Clim. 2004, 17,
2335–2351. [CrossRef]
23. Smith, T.M.; Reynolds, R.W.; Peterson, T.C.; Lawrimore, J. Improvements to NOAA’s historical merged
land-ocean surface temperature analysis (1880–2006). J. Clim. 2008, 21, 2283–2296. [CrossRef]
24. Pederson, N.; Lealand, C.; Nachin, B.; Hessl, A.E.; Bell, A.R.; Martin-Benito, D.; Saladyga, T.; Suran, B.;
Brown, P.M.; Davi, N. Three centuries of shifting hydroclimatic regimes across the Mongolian Breadbasket.
Agric. For. Meteorol. 2013, 178–179, 10–20. [CrossRef]
25. Dai, A.G. Drought under global warming: a review. Interdiscip. Rev. Clim. Chang. 2011, 2, 45–65. [CrossRef]
26. Vicente-Serrano, S.M.; Beguería, S.; López-Moreno, J.I.; Angulo, M.; Kenawy, A.E. A new global 0.5◦ gridded
dataset (1901–2006) of a multiscalar drought index: comparison with current drought index datasets based
on the Palmer Drought Severity Index. J. Hydrometeorol. 2010, 11, 1033–1043. [CrossRef]
27. Qian, C.; Zhou, T. Multidecadal Variability of North China Aridity and Its Relationship to PDO during
1900–2010. J. Clim. 2014, 27, 1210–1222. [CrossRef]
28. Bao, G.; Liu, Y.; Liu, N.; Linderholm, H.W. Drought variability in eastern Mongolian Plateau and its linkages
to the large-scale climate forcing. Clim. Dyn. 2015, 44, 717–733. [CrossRef]
29. Zhang, Y.; Tian, Q.; Guillet, S.; Stoffel, M. 500-yr. precipitation variability in Southern Taihang Mountains,
China, and its linkages to ENSO and PDO. Clim. Chang. 2017, 144, 419–432. [CrossRef]
30. Yang, Q.; Ma, Z.G.; Fan, X.G.; Yang, Z.L.; Xu, Z.F.; Wu, P.L. Decadal modulation of precipitation patterns
over eastern China by sea surface temperature anomalies. J. Clim. 2017, 30, 7017–7033. [CrossRef]
31. Shen, C.; Wang, W.C.; Gong, W.; Hao, Z. A Pacific decadal oscillation record since 1470 AD reconstructed
from proxy data of summer rainfall over eastern China. Geophys. Res. Lett. 2006, 33, L03702. [CrossRef]Forests 2019, 10, 208 14 of 14
32. Ma, Z.; Fu, C. Some evidence of drying trend over Northern China from 1951 to 2004. Chin. Sci. Bull. 2006, 51,
2913–2925. [CrossRef]
33. Zhou, T.; Song, F.; Lin, R.; Chen, X.; Chen, X. The 2012 North China floods: explaining an extreme rainfall
event in the context of a longer-term drying tendency. B. Am. Meteorol. Soc. 2013, 94, S49–S51.
34. Gu, W.; Li, C.; Yang, H. Analysis on interdecadal variations of summer rainfall and its trend in East China.
Acta. Meteorol. Sin. 2005, 63, 728–739.
35. Liu, Z.; Menzel, L.; Dong, C.; Fang, R. Temporal dynamics and spatial patterns of drought and the relation to
ENSO: a case study in Northwest China. Int. J. Climatol. 2016, 36, 2886–2898. [CrossRef]
36. Gergis, J.L.; Fowler, A.M. A history of ENSO events since A.D. 1525: implications for future climate change.
Clim. Chang. 2009, 92, 343–387. [CrossRef]
37. Fang, K.; Gou, X.; Chen, F.; Liu, C.; Davi, N.; Li, J.; Zhao, Z.; Li, Y. Tree-ring based reconstruction of drought
variability (1615–2009) in the Kongtong Mountain area, northern China. Glob. Planet Chang. 2012, 80–81,
190–197. [CrossRef]
38. Chen, F.; Yuan, Y.; Zhang, R.; Qin, L. A tree-ring based drought reconstruction (AD 1760–2010) for the Loess
Plateau and its possible driving mechanisms. Glob. Planet Chang. 2014, 122, 82–88. [CrossRef]
© 2019 by the authors. Licensee MDPI, Basel, Switzerland. This article is an open access
article distributed under the terms and conditions of the Creative Commons Attribution
(CC BY) license (http://creativecommons.org/licenses/by/4.0/).You can also read