TWITTER SENTIMENT ANALYSIS: WHAT DOES SOCIAL MEDIA TELL US ABOUT CORONAVIRUS CONCERNS IN THE UK? - DATA SCIENCE WORKING PARTY / IFOA COVID-19 ...
←
→
Page content transcription
If your browser does not render page correctly, please read the page content below

Twitter Sentiment Analysis:
 What does Social Media tell us about
 coronavirus concerns in the UK?
Data Science Working Party /
IFoA COVID-19 Action Taskforce

Melanie Zhang, FIA
John Ng, FIA

24 July 2020

Speakers’ Biography

Melanie is Head of Property Innovation at AXIS Capital, John is Senior Data Scientist at Reinsurance Group of America
having previously worked in actuarial pricing, reserving and (RGA), where he provides predictive modelling solutions for internal
business planning roles in the London insurance market and external clients on mortality, morbidity, biometrics and digital
since 2011. Melanie has recently completed her Master’s distribution. In his previous roles he developed end-to-end Automated
degree at UCL in Computational Statistics and Machine Machine Learning (AutoML) platform for a range of product lines and
Learning. deployed advanced pricing optimisation frameworks.

She is a member of the IFoA Data Science Managing John is a Fellow of Institute of Actuaries, an experienced pharmacist,
Committee, Data science WP Education Workstream Lead IFoA Data Science Research Workstream Chair, Data Science
and the IFoA Data Science Certificate Committee. Managing Committee member and Deputy Chair of IFoA Health and
 Care Research sub-committee.

July 2020
Data Science WP – Managing Committee
 The overall objective of the Data Science Working Party (WP) is to be a platform of delivering Case Studies, Webinars, Events, GIRO
 sessions and integrating data science applications within our IFoA educational system, in order to supply actuaries and data
 practitioners with credible techniques that can be used within industry.

 • Asif John (Chair)

 New
 COVID-19

• Matthew Byrne • Alex Labram Managing
 • Biren Dhir • Melanie Zhang • John Ng
 • Stelio Passaris Committee
 • Alexis Iglauer • David Tudor-
 Griffith
 • Ankush Agarwal
 • Alex Hanks

 July 2020 3

Agenda

• Introduction

• Data Preparation

• Sentiment Analysis Models

• Sentiment Analysis on Historical UK Tweets

• Limitations and Summary

• Appendix

July 2020
Introduction
What is Sentiment Analysis?
 Sentiment analysis, also known as opinion mining or emotion AI, refer to the use of Natural
 Language Processing (NLP) and text analytics to automatically determine the overall feeling a writer
 is expressing in a piece of text.

 Sentiment classification is often framed as binary (positive/negative), ternary
 (positive/neutral/negative) or multi-class (for example neutral, happy, sad, anger, hate).

 Sentiment analysis is used in many applications:

 ● Monitor and analyse online and social media content around a specific topic
 ● Evaluating survey response
 ● Voice of the customer analysis, leading to value proposition
 ● Product analytics: e.g. categorising product reviews
 ● Improve Customer Support and feedback analysis
 ● Reputation and Brand management
 ● Market Research, Competitor Analysis

July 2020
Research Aims
In this work, we consider the problem of classifying sentiment of UK Twitter messages on COVID-
19 using Natural Language Processing (NLP) and supervised Machine Learning techniques

Our research considers the following:

• Labelling sentiments using emoticons (a noisy method)
• Data enrichment using a non-COVID Twitter dataset (sentiment140)
• NLP pipeline for pre-processing Twitter data
• Encoding methods: Bag-of-words (BoW),Term Frequency-Inverse Document Frequency (TF-IDF),
 GLoVE (Global Vectors for Word Representation)
• Comparison of ‘out-of-the-box sentiment classifier’ vs Machine Learning predictive models: Random
 Forest, Logistic Regression, Support Vector Machines, Naive Bayes, XGBoost
• Visualisation of time-series results for overall UK Twitter sentiment, and for Tweets relating to key
 words, such as ‘nhs’ ‘stayathome’, ‘work’, ‘government’

July 2020
Data Preparation

Data Source
 We chose the “COVID-19 Twitter chatter dataset for scientific use” published by Georgia State
 University’s Panacea Lab
 • 1st January – 11th March 2020: tweets containing key words coronavirus, 2019nCoV
 • 11th March – 25th April 2020: tweets containing more COVID-related key words, such as:
 COVD19, CoronavirusPandemic, COVID-19, 2019nCoV, CoronaOutbreak,coronavirus, covid19,
 coronaviruspandemic, covid-19, 2019ncov, coronaoutbreak,
 • New tweets are added on a daily basis, and there are weekly updates released with the full
 history (versions 1.0, 2.0, 3.0, ….)

 We used Version 7.0 from this dataset, which contains relevant twitter IDs from 1st January 2020 to
 26th April 2020:
 • Cleaned version with no retweets: 52,026,197 unique twitter IDs
 • In line with Twitter’s terms of use, only the twitter IDs are provided and these need to be
 hydrated to extract the original tweets and metadata from the IDs, example:

 Twitter ID Hydrated Data

 {‘created_at’: ‘2020-04-26’, ‘favourite_count’: 1, ‘lang’:
 1254259095701520385 ‘en,’ ‘text’: ‘Local man confused here again oh,guys help
 me…’, ‘place’: …}

July 2020
Data Extraction
 Twitter applies a rate limit on hydrating IDs – i.e. it restricts the number of IDs that can be hydrated within
 a 15 minute window
 • To limit the required time for Twitter hydration, we took a random 25% sub-sample of the full dataset:
 13,006,549 of 52,026,197 unique twitter IDs
 • Hydration took around 4 days for this 25% sample, and we were able to hydrate 11,406,801 Twitter
 IDs, as we couldn’t get results for Tweets that have since been deleted
 • Filtered for English language tweets only to obtain 6,458,776 Tweets

July 2020
Country Classification
 There are 3 data fields in the hydrated metadata that provide information about user location, with
 differing levels of fill rate for the English Tweets dataset:
 • “coordinates”: latitude-longitude of user location (0.1% filled)
 • “place”: semi-structured field of user location, usually “city, state”, or “state, country” or “country” (3.4%
 filled) – with around 20k unique entries
 • “user_location”: free text field filled in by user (74.0% filled) – this is the noisiest field with >400k
 unique entries

 We considered 3 methods of extracting country location for each Tweet (with the aim to avoid any
 manual mapping methods):
 1. Look for key location words in “place” and “user_location”, e.g. US state names, abbreviations, and
 various country name representations for US, UK and India (the top 3 countries for COVID Tweet
 volumes according to Georgia State University’s Panacea Lab)
 2. Used the semi-structure field “place” to find mappings from low-level places to high-level places (e.g.
 Los Angeles → CA → US)
 3. Used the Google Geocoding API on locations that couldn’t be mapped to a country from either of the
 first 2 methods (limited to the most frequent 20k locations for “user_location”)
 Able to map 3.3m out of 6.4m (51.7%) Tweets to a specific country

July 2020
Tweet Volumes by Country

 Top 5 countries by volume of
 English language Tweets
 related to COVID-19 as at 26
 April 2020:
 Volume % of
 Country
 (000s) Total

 USA 1,733 51.9%

 UK 432 12.9%

 India 236 7.1%

 Canada 166 5.0%

 Nigeria 114 3.4%
 log10 scale

July 2020
Sentiment Labels using Emoticons
 7k Training Set Labels:
 • 7k Tweets from our UK dataset of English language Tweets relating to COVID-19, automatically labelled
 ‘positive’ [e.g. , , , etc.] or ‘negative’ [e.g. , , , etc.] using a similar method
 • This is a noisy labelling method, as there can be examples where there are contradictory sentiments
 between the text and the emoji present in the Tweet [e.g. “Ah what a shame https://...”], but this
 removes the need for any manual human labelling on a large dataset
 • Equal number of positive and negative labels

 3k Test Set Labels:
 • 3k Tweets from our UK dataset of English language Tweets relating to COVID-19, automatically labelled
 ‘positive’ or ‘negative’ as above, but then with manual human review to correct cases for sentiment based
 on the text only
 • E.g. “I’ve waited 4/5 months to get back out on the golf course and it’s going to be ruined by the
 coronavirus ⛳” would have been automatically labelled as “positive” but manually overwritten in the test
 set as “negative”
 • 54% negative / 46% positive labels

July 2020
Data Enrichment
 Training data of 7k UK English Tweets is relatively small in size. Model performance could potentially be
 improved by enriching it with other labelled text datasets from the same source (Twitter). More data contributes
 to a larger vocabulary to be associated with sentiment.

 200k Training Set Labels:
 • 193k random sample from the sentiment140 dataset, a collection of 1.6m (non-COVID) Tweets,
 automatically labelled ‘positive’ or ‘negative’, using the presence of positive [e.g. ☺] or negative [e.g. ☹]
 emoticons
 • The above is appended to our 7k UK dataset of English language Tweets relating to COVID-19, resulting in
 a Training Set with 200k labels
 • Equal number of positive and negative labels

July 2020
NLP Pipeline

 Pre-processing Machine Learning
 steps: Encoding eg: models eg:
 • Tokenization (N- • Bag-of-Words • Logistic
 Raw Processed Feature Regression
 Sentiment
 grams) • TF-IDF
 Tweets • Stop words Tweets • Neural Extraction • Trees Prediction
 • Lemmatization embeddings • Naïve Bayes
 • Normalization • Neural networks

 [‘a’, ‘massive’, [‘massive’,
 A massive ‘thank’, ‘you’, ‘thank’, ‘you’,
 [‘massive’,
thank you to ‘to’, ‘our’, ‘our’,
 ‘thank’, ‘you’,
our fantastic ‘fantastic’, ‘fantastic’,
 ‘our’,
 carers - Tokenization (and ‘carers’, ‘-’, Remove some ‘carers’, ‘-’, Lemmatization &
 ‘fantastic’,
#clapforcarer lower case) ‘ , ‘# stop words ‘ , ‘# Normalization
 ‘carers’,
 s clapforcarers’ clapforcarers’
 clapforcarers’
https://t.co/6s , ,
 , ‘URL’]
 5ka7v8xx ‘https://t.co/6s ‘https://t.co/6s
 5ka7v8xx’] 5ka7v8xx’]

July 2020
Tokenization: N-Grams
N-grams are a sequence of N words, and text can be converted into N-gram tokens before encoding

 N-Gram Type Text Tokens
 [‘massive’, ‘thank’, ‘you’, ‘our’,
 Unigrams (N = 1) ‘fantastic’, ‘carers’, clapforcarers’,
 ‘URL’]
 [‘massive-thank’, ‘thank-you’, ‘you-
 our’, ‘our-fantastic’, ‘fantastic-
 Bigrams (N = 2)
 carers’, ‘carers-capforcarers’,
 clapforcarers-URL’]
 [‘massive-thank-you’, ‘thank-you-
 our’, ‘you-our-fantastic’, ‘fantastic-
 Trigrams (N = 3)
 carers-clapforcarers’, ‘carers-
 clapforcarers-URL’]

July 2020
Feature Extraction: Encoding
 Encoding converts a set of text tokens into a numerical vector, which can be read by ML models

 Bag-of-Words (BOW) Term Frequency-Inverse Neural Embeddings
 Document Frequency • A.k.a “semantic vector space”,
 • Counts frequency of each token in the (TF-IDF) “word feature vector”, “vector
 text, where the dimension of the vector representation”
 is the size of the whole vocabulary • Commonly used in search engine • Neural embedding is a
 • Simple and can be effective, but rankings and other information
 ignores grammar and order, and often representation of a word as a
 retrieval settings
 computationally slow to handle numerical vector that captures
 • TF-IDF calculates the importance semantic meaning (e.g. GloVe)
 of a word, which increases • For example the word “peace”
 proportionally to the number of might be represented as (-0.035,
 times a word appears in a Tweet, 0.078, 0.022, -0.013)
 but is offset by the frequency of the • 3 primary purposes:
 word in all Tweets
 ○ Make recommendation by
 finding nearest neighbour in the
 embedding space
 ○ Input for supervised learning
 ○ Visualisation of concepts and
 relationships between
 categories

July 2020
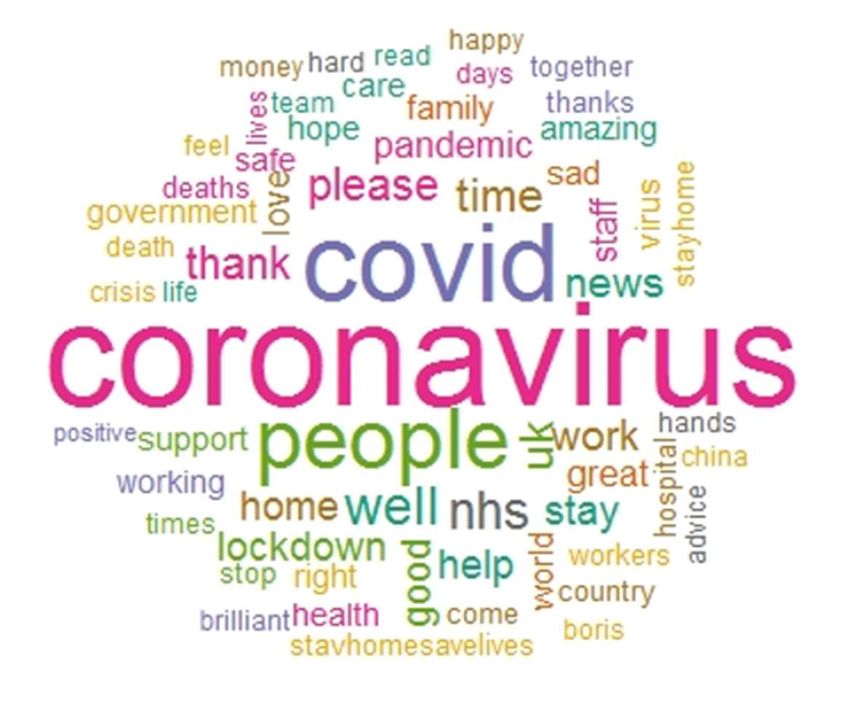
Word Cloud

 [Expletives deleted]

July 2020
Sentiment Analysis Models
Baseline Models
 Running a simple baseline with give a benchmark accuracy to compare other more sophisticated
 models against. The baseline models below do not require any training on our dataset.

 1. SentiWordNet: Positive / Negative Word Count

 • Use SentiWordNet, an open source list of words with labelled sentiment scores for positivity, negativity,
 objectivity
 • For each Tweet in the test set, count the number of ‘positive’ and ‘negative’ words based on the
 SentiWordNet label
 • Classify Tweet as ‘positive’ if the number of positive words is greater or equal to the number of negative
 words
 2. TextBlob

 • ‘Out-of-the-box’ sentiment classifier (and can perform other NLP tasks such as Part-of-speech Tagging)
 • Pre-trained on a movie review dataset and applies Naïve Bayes on new text
 • Can output ‘polarity’ and ‘subjectivity’, where polarity indicates sentiment and is a score between -1
 (negative) and +1 (positive)
 • Classify Tweet as ‘positive’ if the polarity ≥ 0

July 2020
Model Performance Metric
 Model performance is measured by the AUC (Area Under the ROC Curve).

 The Receiver Operating characteristic (ROC) curve is a graph showing the performance of a
 classification model at all classification thresholds.

 AUC shows the capability of model to distinguish positive and negative sentiment classes.

 Naïve
 AUC values Results
 Bayes

 0.774 0.9 - 1 Excellent

 0.771 0.8 - 0.9 Good

 0.7 - 0.8 Fair

 0.6 - 0.7 Poor

 0.5 - 0.6 Unsatisfactory

July 2020
Machine Learning Models
 The tables below show AUC performance of models on 3k test data.

 Models (except baseline) trained and tuned on 7k training data:
 Logistic
 Encoder / SentiWord Random
 TextBlob XGBoost Linear SVM Regression Naïve Bayes
 Model AUC Net Forest
 (Regularised)

 BOW 0.490 0.724 0.828 0.838 0.851 0.857 0.857

 TF-IDF n/a n/a 0.815 0.839 0.848 0.856 0.848

 Data enrichment - Models (except baseline) are trained and tuned on 200k training data:

 Logistic
 Encoder / SentiWord Random
 TextBlob XGBoost Linear SVM Regression Naïve Bayes
 Model AUC Net Forest
 (Regularised)

 BOW 0.490 0.724 0.843 0.846 0.858 0.848 0.864

 TF-IDF n/a n/a 0.834 0.847 0.859 0.858 0.858

 Selected Model (based on results, run-time, simplicity and transparency) is
 Regularised (Ridge) Logistic Regression with TF-IDF trained on enriched data set (200k)

July 2020
Parameter Tuning and Feature Selection

 ● Hyper-parameter tuning were performed using 5-fold cross validation on training data

 ● Training on 7k data utilised document-term-matrix of uni-grams and 6k features.

 ● Training on 200k data utilised document-term-matrix of bi-grams, 80k features (selected from
 most common ones out of 880k possible bi-grams). 10x weightings were applied to the subset
 of 7k COVID-19 related tweets - to improve contextual signals.

 ● It is essential to work with sparse matrices to handle the size of these matrices during
 computation and to vastly improve speed when training the models.

 ● TF-IDF encoding results were similar to BOW, with small improvements for some supervised
 algorithms but also small deterioration for others.

 ● GloVe (Global Vectors for Word Representation) by Stanford NLP was explored. It has the
 potential for encoding some form of meaning/context. While interesting and helpful in
 unsupervised learning, it had not significantly boost predictive performance of the machine
 learning algorithms we tried. As such, these features are not included in the final model.

July 2020
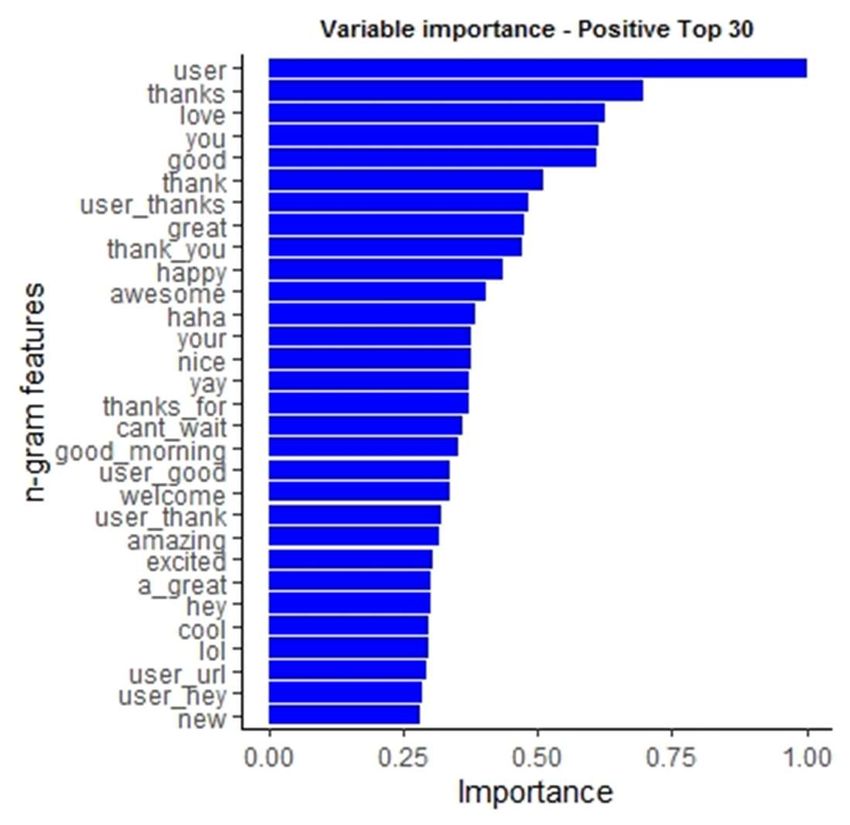
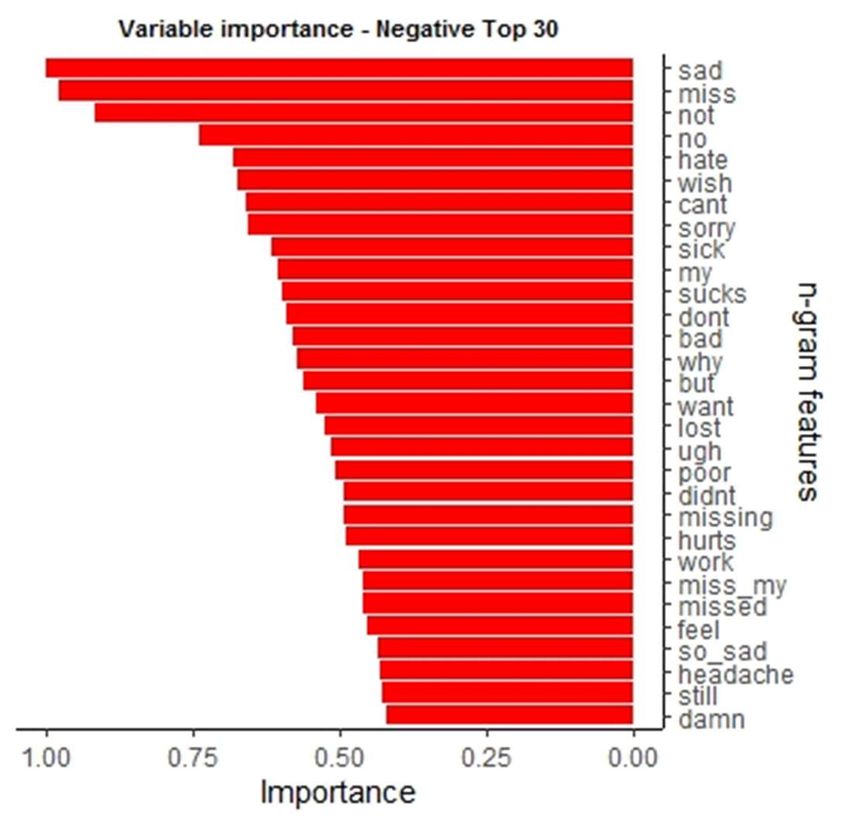
Variable Importance of ML Model

 Variable importance is calculated using Agresti method of standardisation

July 2020
Sentiment Analysis on Historical
UK Tweets
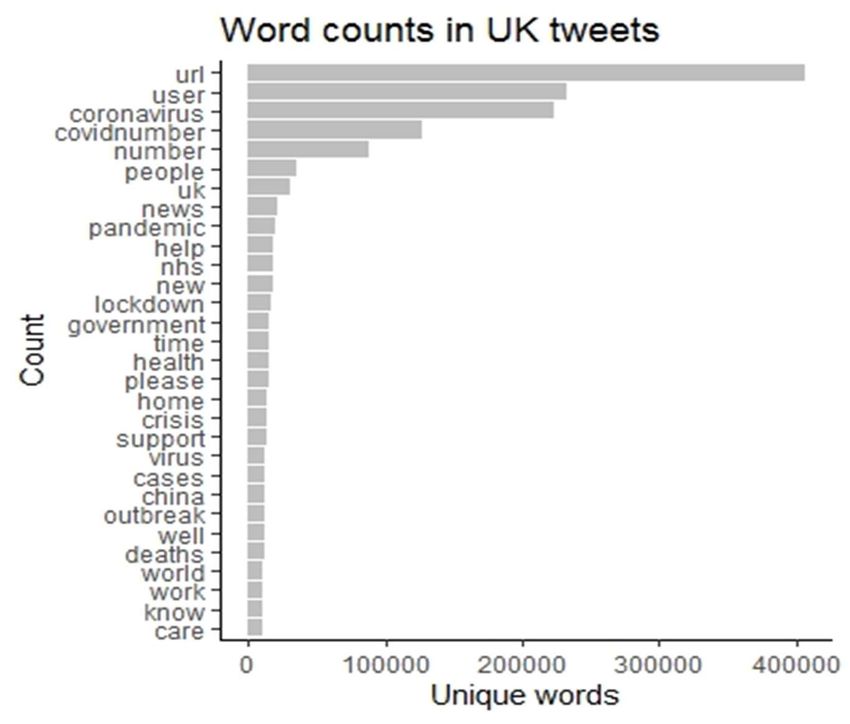
Common words in UK Tweets

July 2020
Overall Sentiment Scoring on all UK Tweets

 ● Sentiment scoring on 432k UK Tweets
 using machine learning model

 ● Tweets from end of January till late
 February generally focused on COVID-19
 development in other countries and carried
 a more negative sentiment

 ● The inflection point was middle of March
 where there were more positive sentiments,
 staying at +20% level until the end of April

 ● Timeline:
 ○ 31 Jan - First two cases confirmed
 ○ 28 Feb - First British death
 ○ 9 Mar - FTSE 100 plunged by more
 than 8 percent
 ○ 11 Mar - Bank of England interest rate
 cut; Chancellor announces £30 billion
 measures to protect economy
 ○ 23 Mar - Lockdown
 ○ 27 Mar - Both PM Boris Johnson and
 HS Matt Hancock tested positive
 UK enters lockdown ○ 8 April - Estimated peak of hospital
 deaths

July 2020
Sentiment of Tweets containing ‘lockdown’ or ‘stayhome’

 ● There was increasingly positive
 sentiment trend around the period when
 the lockdown was introduced

 ● Note the slight dip in sentiment 1-2
 weeks after lockdown, possibly because
 of people feeling exhausted

 ● Sentiment for “lockdown” was very
 similar to overall sentiment of all UK
 tweets, in both shape and scale

 ● The response to the “stayathome”/
 “stayhome” / “stayhomesavelives”
 message was favourable - sentiment
 scores as high as 70% by end of April

 “staying home is the easiest and
 UK enters lockdown UK enters lockdown most effective way to stay safe lets
 make sure we observe government
 lockdown and follow the guideline
 in keeping safe while at home
 covidNUMBER stayhome”

July 2020
Sentiment of Tweets containing ‘home’, ‘work’

 Example Tweets:

 ● ‘Home‘ - Early Feb
 ○ “Bring home britons from wuhan”
 ○ “so worried about a possible
 coronavirus breakout back home”

 ● Entering lockdown
 ○ “people forced to stay at home
 saying they want to be at work
 and there are people forced to go
 to work saying they want to be at
 home”

 ● ‘ Home‘ - Late April
 ○ “Staying home keep safe”
 ○ “my brother was in a nursing
 home he died .. “

 ● ‘ Work‘ - Late April
 ○ “Amazing work”
 UK enters lockdown UK enters lockdown ○ “Thank you for your hard work”
 (nhs, key workers, volunteers etc)

July 2020
Sentiment of Tweets containing ‘nhs’, ‘health’
 “nhsheroes heroes nhs “Thank you to all healthcare
 nhsthankyou a massive thanks” workers”

“coronavirus patients could be “coronavirus declared a serious and
 “nhs staff shortages too few beds
denied lifesaving care if virus imminent threat to public health as
 a lack of protective equipment”
overwhelms nhs hospitals” cases surpass NUMBER”

July 2020
Sentiment of Tweets containing ‘cases’, ‘deaths’

 ● These Tweets were frequently
 associated with reported COVID-19
 statistics, number of cases and
 deaths in the UK and around the
 world

 ● The sentiment related to “cases”
 and “deaths” were overwhelming
 negative, as one would expect

 ● Sentiment of “cases” hovered
 around -70%. Sentiment of “deaths”
 was around -80% initially but was
 improving towards the end of April.

July 2020
Sentiment of Tweets containing ‘uk’, ‘world’

 ● The sentiment trend for Tweets
 containing “uk” was similar to the
 overall sentiment of all UK tweets,
 but scaled down by around 40%

 ● The sentiment trend for Tweets
 containing “world” was similar to the
 overall sentiment of all UK tweets,
 but scaled down by around 10%

July 2020
What about sentiment on ‘insurance’?

 ● Positive peak end of Feb was due to a number of very similar
 tweets pointing to travel insurance advice given on
 https://www.citizensadvice.org.uk/

 ● Notice the dip in mid-March (just before UK lockdown):
 ○ (-) "last night the pm encouraged people to stay away
 from theatres pubs and restaurants to stem the spread of
 covidNUMBER but he didn’t formally ask those
 businesses to close without clear government instruction
 that leaves them unable to claim insurance and liable to
 go bankrupt"

 ● After lockdown (23rd March):
 ○ (-) “hiscox rejects agency’s coronavirus claim warns
 pandemic too large”
 ○ (-) “bbc insurance firms ordered to pay out or explain”
 ○ (-) “wedding insurance companies won’t pay out”
 ○ (+) “renewals reinsurers showed resilience despite
 covidNUMBER challenges”
 ○ (+) “us insurers offer motor premium refunds”
 ○ (+) “nfu mutual includes covidNUMBER in personal
 accident and annual travel insurance policies”
 ○ (+) “these are the times insurance companies are grateful
 for the existence of reinsurance companies”
 ○ (+) “thats why people take out insurance”

July 2020
Sentiment of Tweets concerning ‘government’ vs UCL social study

 ● The UCL COVID-19 Social Study
 conducted a panel study of over 90,000
 respondents focusing on the
 psychological and social experiences of
 adults living in the UK

 ● One way of validation is to compare the
 Twitter Sentiment Analysis results
 against independent findings in the UCL
 Social Study. The lower plots shows
 respondents’ confidence in the

 lockdown
 government, by nations and by age

 ● The sentiment trend for tweets
 containing “government” post-lockdown
 (23 March) was generally better than
 pre-lockdown

 ● Twitter users have a younger
 demographics. The “government
 confidence” is lowest for the youngest
 age group in the UCL Social Study –
 note the similarities between Twitter
 sentiment and people’s confidence on
 government:

 o Hovers around the neutral level
 o Decent levels 1-2 weeks post-
 lockdown, and slight decrease
 after that

July 2020
Limitations
• Change in Twitter keyword search: Data source is more complete for Tweets made after 11th
 March 2020, when the list of COVID-related keywords were expanded - so there is more
 uncertainty in the sentiment levels shown prior to this date
• Noisy labelling: We use an automated labelling method for sentiment based on emoticons
 present in Tweets for the training set - whilst this has saved a lot of time, this can lead to
 mislabelling where there is contradiction between the text and the emoticon sentiment [e.g. “Ah
 what a shame ...”]
• Lost data in pre-processing: Due to time limitations and the desire to avoid manual pre-
 processing steps, we chose to take a 25% sample of the full dataset available, and were able to
 map 51.7% of all English Tweets to a specific country, effectively discarding the remainder from
 the analysis - it is assumed that our data sample is representative of the full dataset without any
 significant bias
• Ignored neutral sentiment: In practice, some Tweets are neutral in sentiment, but this has been
 ignored in our analysis and we have built the models to only predict ‘positive’ or ‘negative’
 sentiment
• Twitter user profile: Twitter users can have different demographic mix from the general UK
 population, and insights on sentiment from Twitter may not be representative of the UK as a whole

July 2020
Summary
• Training and fine-tuning ML models on a COVID Twitter dataset can significantly outperform simple pre-
 trained baseline models
• Data enrichment for training (using sentiment140 non-COVID Twitter dataset) can improve sentiment
 prediction results on the test set.
• Selected model was Regularised (Ridge) Logistic Regression using TF-IDF trained on enriched data
 set (200k), based on accuracy, speed, simplicity and transparency, achieving 0.859 AUC on the 3k test set
• Sentiment analysis on historical UK COVID-19 Tweets suggest:
 – Overall sentiment has become more positive post-lockdown on the 23rd March, with relatively strong
 positive sentiment reaction to the ‘stayathome’ message compared to ‘lockdown’. This is an
 opportunity for positive behavioural change if there are future waves.
 – Increase in positive sentiment for Tweets relating to ‘NHS’ and ‘health’, particularly from late-March,
 which also coincides with the start of Clap for Carers - some dips in sentiment related to fears about
 running out of hospital beds and lack of sufficient PPE
 – Sentiment relating to ‘UK’ is generally more negative compared to those relating to ‘world’
 – Tweets containing ‘government’ have been mostly negative pre-lockdown with some sentiment
 improvements to neutral level during lockdown. There exists similarities with UCL Social Study results.
 – Tweets containing ‘insurance’ show swings in sentiment relating to travel insurance advice,
 government policy, insurers’ responses to COVID-19 coverage and changing market conditions

July 2020
Potential Future Investigations
• Update for latest period: We can update the analysis by mining Twitter data for the period since 26th
 April 2020 - our work described here uses Georgia State University’s Panacea Lab v7.0, whereas the
 latest released v16.0 contains Tweet IDs up to 27 June 2020
• Explore Deep Learning architectures: Recent advances in NLP show that deep neural network
 architectures, particularly when pre-trained on a large text corpus, can significantly outperform more
 traditional ML models (such as the ones used in this work), but this will require more computing power
• Neural Embeddings: More work can be done to analyse the effectiveness of neural embeddings, as
 BOW and TF-IDF have a number of limitations:
 – BOW / TF-IDF leads to a high dimensional and sparse feature vectors, due to the size of the Twitter
 vocabulary and elements only take non-zero values where the corresponding word appears in the Tweet
 – BOW / TF-IDF automatically discards order of words in a Tweet, e.g. “the pm encouraged people to stay
 away…” and “people encouraged the pm to stay away…” would have the same representation, which can
 change the semantic meaning or sentiment of a Tweet
 – Learning is usually more efficient with neural embeddings, which have denser lower-dimensional
 representations compared to BOW / TF-IDF

• Visualisation: Tools such as t-SNE can be used to visualise and group similar types of Tweets
 together, based on their encoded representations
• Cleaner Labelling: We could enlist the help of other volunteers to perform a manual review of the
 training data labels, to remove some of the noise around using emoticons to detect sentiment

July 2020
Questions Comments

 The views expressed in this publication are those of invited contributors and not necessarily those of the IFoA. The IFoA do not endorse any of the views stated,
 nor any claims or representations made in this publication and accept no responsibility or liability to any person for loss or damage suffered as a consequence of
 their placing reliance upon any view, claim or representation made in this publication.

 The information and expressions of opinion contained in this publication are not intended to be a comprehensive study, nor to provide actuarial advice or advice
 of any nature and should not be treated as a substitute for specific advice concerning individual situations. On no account may any part of this publication be
 reproduced without the written permission of the authors.

July 2020 38
Appendix
Token Normalization
Approach to token normalization taken from Badr and Fatima (2015) and Saif
et al (2012):
• Username replacement: all user mentions are replaced by the token USER
• Web links replacement: all URLs are replaced by the token URL
• Punctuation: all punctuation marks are removed
• Emoticons: all emoticons are removed (after noise labelling use)
• Hashtags: the hash symbol # is removed from hashtags and they are treated as
 regular words
• Numbers replacement: all digit characters are replaced by the token NUMBER
• Word compression: any sequence of repeated letters is reduced to two letters, e.g.
 “coool” and “cooool” are compressed as a single token “cool”

July 2020
References
 1) Georgia State University’s Panacea Lab

 2) Sentiment140 dataset with 1.6 million tweets

 3) DocNow Hydrator
 4) Using Skipgrams, Bigrams, and Part of Speech Features for Sentiment Classification of Twitter Messages
 [Badr and Fatima 2015]
 5) Alleviating Data Sparsity for Twitter Sentiment Analysis [Saif et al 2012]
 6) Twitter Sentiment Classification using Distant Supervision [Go et al 2020]
 7) Feature Engineering for Machine Learning [Zheng and Casari 2018]
 8) SentiWordNet
 9) TextBlob
 10) GloVE: GLobal Vectors for Word Representation
 11) Sentiment Analysis [Wikipedia]

 12) UCL COVID-19 Social Study

July 2020
You can also read