Lightning in Norway under a future climate - MET report ProTrafo project report Morten Køltzow Andreas Dobler Siri Sofie Eide
←
→
Page content transcription
If your browser does not render page correctly, please read the page content below
No. 9/2018
ISSN 2387-4201
METreport Climate
Lightning in Norway
under a future climate
ProTrafo project report
Morten Køltzow
Andreas Dobler
Siri Sofie Eide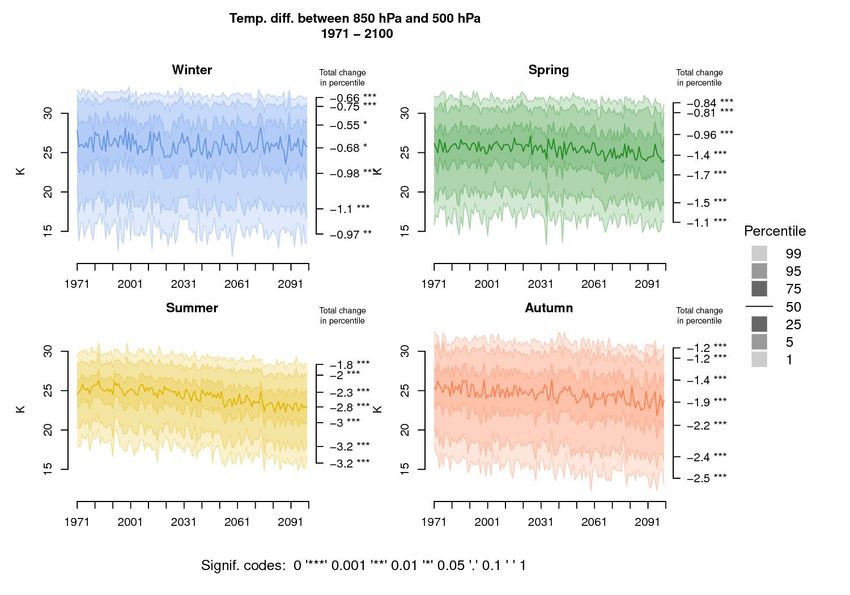
Title                                               Date
Lightning in Norway under a future climate          16.09.2018
Section                                             Report no.
Development Centre for Weather Forecasting          No. 9/2018
and Research and Development Department
Author(s)                                           Classification
Morten Køltzow, Andreas Dobler, Siri Sofie          ● Free    ○ Restricted
Eide
Client(s)                                 Client's reference
Norwegian Research Council project number
269303: Next Generation Protection of
Transformers (ProTrafo)
Abstract
A lightning climatology, based on the Norwegian lightning detector network are
presented. Seasonal and spatial differences are described and discussed. In summer,
lightning is observed most frequently in south east Norway and over land in southern
Norway in general. In winter, the most pronounced lightning activity appear offshore and
along the Norwegian west coast.

A possible future change in lightning patterns for Norway are further investigated. This
study suggest that lightning in Norway will happen more frequently in winter, spring,
autumn and in mountainous areas in the future. However, the frequency of traditional
summer lightning (e.g. what is experienced in south east Norway) will happen slightly
less frequent, or with today's frequency. However, the estimates of future lightning
characteristics are still uncertain.

Keywords
Lightning, climatology, future climate

Footer                                                                               2
Disiplinary signature   Responsible signature

Footer                                        3
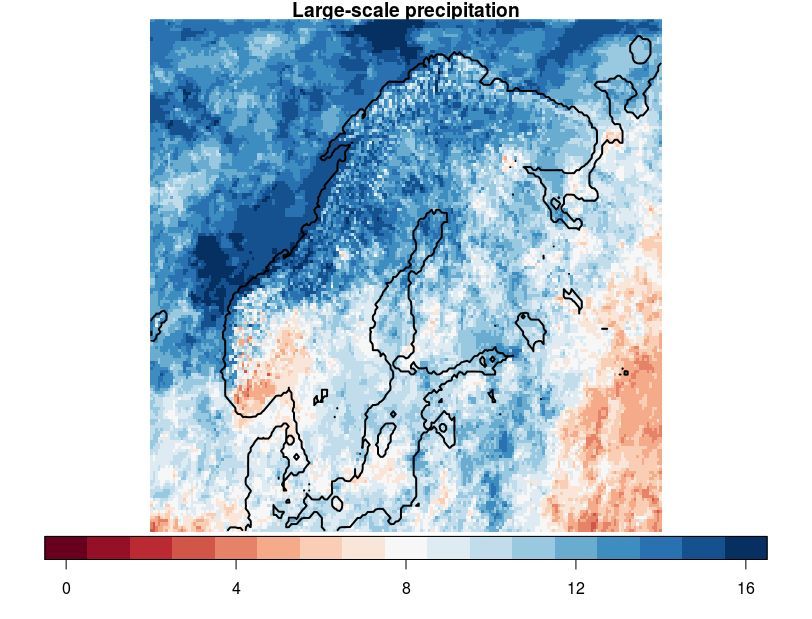
Table of contents

1. Introduction

2. Description of observations

3. Lightning climatology

4. Climate Scenario runs

5. Analysis of ProTrafo climate scenario run

6. ProTrafo climate scenario compared with other studies.

7. Summary and conclusions

Acknowledgements

References

Footer                                                      4
1. Introduction
Lightning strikes are responsible for a substantial part of interruptions in the Norwegian
power supply (Kjølle et al., 2006, 2008). Lightning protection is therefore an important
component of the power supply infrastructure. To make appropriate plans for lightning
protection, knowledge about present and future lightning climatology is important.

Lightning is closely linked to convective precipitation (e.g. showers). A first necessity
for convection to happen is relatively warm air at lower levels of the atmosphere. This
happens in summer when the surface is heated by the sun, or in winter when cold air
flowing over relatively warm oceans are heated (e.g. in connection with “cold air
outbreaks”). For high vertical atmospheric temperatures differences (with colder air at
higher altitudes) the atmosphere becomes potentially unstable and vertical mixing can
be triggered. If also enough moisture is available at lower levels, convective
precipitation will start to develop.

Charging of convective clouds happens by collisions between different hydrometeors
(e.g. ice, snow, graupel, rain droplets) where electrical charge is transferred between
their surfaces. Due to different density, mass and shape of these hydrometeors they are
transported by cloud updrafts to different regions in the cloud. This process then builds
larger charged regions that can be released by lightning discharges when the differences
exceed some thresholds.

Footer                                                                                   5
Lightning is a small scale phenomenon, and not resolved or explicitly forecasted by
weather and climate models. Day to day forecasting and climate model scenarios are
therefore dependent on parameterization schemes (e.g. unresolved processes are
described with resolved large scale parameters) or larger scale stability indices (e.g.
indexes based on vertical stability and moisture availability).

Midtbø et al. (2011) studied the change in lightning indices in Norway in a future
climate. The conclusion was that we should expect an increase in lightning activity, but
not homogenous in space. Since this study, the observational time series of lightning
over Norway and adjacent areas has been significantly extended in time. In addition,
greenhouse gas scenarios have evolved together with climate model descriptions. An
update on lightning activity in present and future climate can therefore provide new and
potentially useful insight.

In this study, we use output from already existing climate scenario runs. However, the
temporal resolution of model output in these runs is somewhat limited in representing
the daily cycle. Also, not all desired variables are available. Therefore, this study also
includes a new climate scenario run with the COSMO-CLM regional climate model
(Früh et al. 2016) to ensure a good temporal resolution of the daily cycle and
availability of the necessary variables for lightning indices.

This report describes the lightning observational system in Norway (section 2) and
presents an updated lightning climatology based on these observations in section 3. A
short introduction to climate scenarios and climate models is given in section 4.
Analysis of lightning indices in the ProTrafo climate run is done in section 5, while the
findings are compared with data/literature from other studies in section 6. The report
ends in a short summary with conclusions in section 7.

Footer                                                                                   6
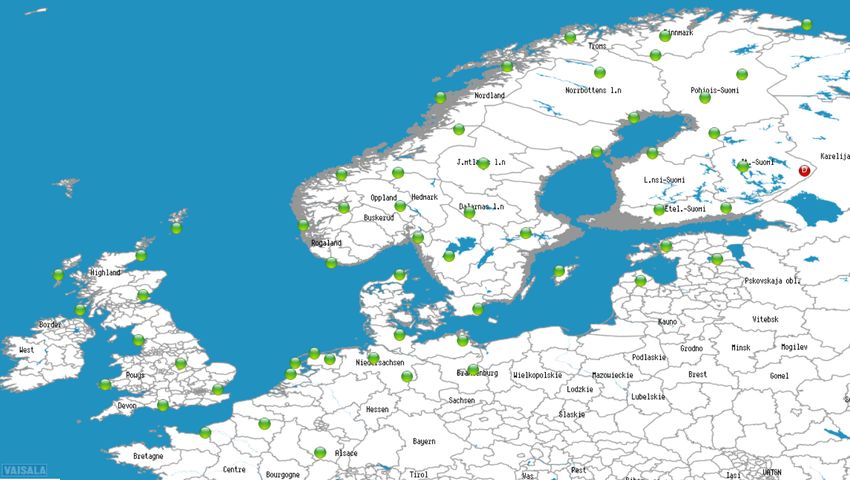
2. Description of observations
The Norwegian sensor network was built during the 1980s and 1990s in a cooperation
between Statnett, Sintef and MET Norway. Since 2017, MET Norway is responsible for
operating the network, and lightning data from the norwegian economic zone (and
countries which MET Norway has agreed on sharing data with) are freely available
from api.met.no.

At the moment (summer 2018) the Norwegian lightning sensor network consists of
fourteen sensors in Norway (from Lista in the south to Vardø in the north). In addition,
one sensor is placed at Lerwick airport on Shetland and one near Sindal in Denmark
(Figure 2.1). Several sensors makes it possible to triangulate individual discharges with
a given accuracy. However, the observational accuracy of the system has some known
limitations. The electromagnetic signature of a lightning decreases with distance and
will at a given distance be difficult to separate from other electromagnetic signals.
Therefore, large distances between sensors make the triangulations inaccurate.
Furthermore, if a sensor is too close to the discharge, the sensor could be overloaded
and the observation will be excluded from the calculation. Obviously, lightning
discharges outside of the network might not be registered or have a large error in
location.

Introduction of new sensors and processing units have improved the accuracy and
detection efficiency of the system. For example, after a sensor upgrade in 2015 it is
possible to differentiate between intra-cloud (IC) and cloud-to-ground (CG) lightning.
Due to the evolution of the system, spatial lightning patterns are well described in the
historical observations, but description of lightning changes with time is more uncertain
and should be handled with care. For the present version of the network, the lightning
detection efficiency given by the manufacturer is 90-95% and 45-50% for
cloud-to-ground and intra-cloud lightning, respectively (https://www.vaisala.com). To
improve the observational coverage and accuracy, MET Norway exchange sensor data

Footer                                                                                  7
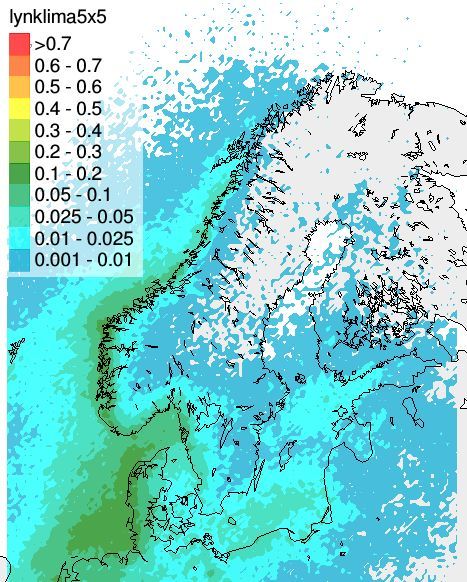
with the Swedish Meteorological and Hydrological Institute (SMHI), The Finnish
Meteorological Institute (FMI), Siemens (that runs the sensor network in Germany) and
Meteorage which has a lightning sensor net spread over UK, Netherlands, and France.

Figure 2.1 Lightning sensor locations.

3. Lightning climatology
A lightning climatology for the period 2004 - 2016 has been prepared and is presented
in the following. Figure 3.1 shows hours with one or more lightning strikes within 12,5
x 12,5km for yearly, cold and warm season averages. A yearly maximum is found
around Oslofjorden and along the coast in southern Norway. In general, lightning
frequency decreases with latitude and altitude.

Footer                                                                                8
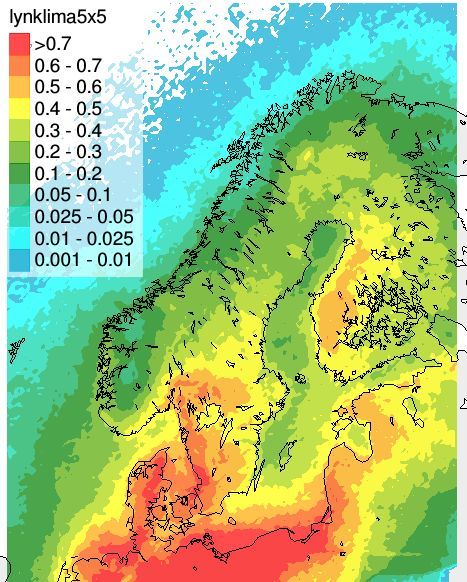
Figure 3.1 Percentages of hours when one or more lightning strikes are observed within
a 12,5km x 12,5km box for the period 2004-2016. Annual percentages to the left, warm
season values in the middle and cold season values to the right.

There are significant differences between summer and winter lightning. Taking
lightning mechanisms into consideration this is quite reasonable. Summer lightning is
most frequent in south east Norway associated with build up of traditional summer
continental convection (single convective cells or more organised activity). When the
surface is heated by the sun, low level moisture is available and colder air is present
aloft. Thus, the atmosphere is unstable and convective activity develops. Cold season
lightning, as seen along the west coast and offshore, has a different origin compared to
summer lightning. Winter lightning is connected to cold air, often of Arctic origin,
traveling with a long fetch over the ocean. The cold air will, with the help of relatively
warmer sea surface temperatures, warm near the surface. This results in relatively warm
and moisture air near the sea surface in combination with colder air aloft. In these
situations widespread, but relatively shallow convection is common and results in
lightning activity offshore and along the coast line. The maximum along the coast
happens due to additional convergence of the air masses that hit land due to increased
friction and additional topographic lifting. Since the temperatures are lower in winter

Footer                                                                                   9
than summer, and thereby also the ability to hold on humidity, the lightning frequency is
lower in the cold season than in the summer.

Figure 3.2 shows the total amount of lightning strikes for an area in northern Norway
(6-13E and 62-69N), west Norway (0-6E and 57-62N) and east Norway (7-13E and
58-62N) as a function of time of the year. The lightning season in east Norway starts in
May and ends in September. While west Norway has a season from May to January,
and north Norway from May to September and a second top in December and January.

Figure 3.2 Number of observed lightning strikes by month averaged over all years from
2004 to 2016 for Eastern Norway, Western Norway and Northern Norway. Each box is
drawn between the upper and lower quartile, with the thick black line showing the
median. The dashed lines extend to the highest and lowest value, excluding outliers.

Footer                                                                                 10
The relative amount of positive lightning increases in the cold season along the coast of
Norway (not shown). On average, the most energetic lightnings are found in west
Norway (Table 1). On average, also winter lightning is more energetic than summer
lightnings. Furthermore, the variability in lightning energy is higher during winter than
in summer (not shown). Compared with the energy reported elsewhere (e.g. Poelman et
al., 2016, Schultz et al., 2016 ) at lower latitudes Norwegian lightning has less energy.

  Strength of              Year                     Warm season               Cold season
   lightning
      (kA)         all      neg     pos       all       neg    pos      all      neg        pos

   Southeast        7        9        6       7          9        6     9          9         8

         West      14       15       12       14        15        12    15        16        14

         North      9       10        7       9         10        7     16        15        17
Table 1 Median value of lightning strength (kA) in different regions divided into annual,
cold and warm season.

4. Climate scenario runs
Global Earth System Models (ESMs) simulate the processes in the atmosphere, land
surface, ocean, sea ice and their interactions and are the cornerstone of climate scenario
production. In climate scenario runs these models are forced with emission scenarios of
historical, present and future emissions of greenhouse gases. ESMs are very computer
demanding and simulate therefore the future climate with a quite coarse horizontal
resolution and often lack spatial and temporal details. To give more useful and detailed
climate scenarios, Regional Climate models (RCMs) are therefore often used to
downscale ESM results. Such a model employed on a limited regional domain and time
period can afford higher resolution and provide more details.

Footer                                                                                  11
Although results from RCMs still differ significantly from observations, the performance has been much improved (e.g, Kotlarski et al., 2014). For Europe, RCM simulations are coordinated in the EURO-CORDEX initiative (http://www.euro-cordex.net/) which provides RCM climate projections (and evaluation runs) for a set of model combinations (>15) over a common 0.44° (ca. 50km) and 0.11° (ca. 12km) grid covering Europe. The EURO-CORDEX data is available on the Earth System Grid Federation (ESGF) data centers (e.g., https://esgf-data.dkrz.de/). Considering the assessment of possible changes in lightning climatology in a future climate, the availability of data is somewhat limited. CAPE is usually not available and some desired variables are available at daily resolution only. Thus, to supplement the CORDEX simulations with additional variables like CAPE or Graupel, as well as on different pressure levels and with higher temporal resolution (hourly), an additional RCM simulation for Northern Europe (Fig. 4.2) has been carried out using the COSMO model in Climate Mode (COSMO-CLM, Früh et al., 2016). For this simulation, global data from the MPI-ESM-LR earth system model (Giorgetta et al., 2013) has been downscaled to 0.22° for the time period 1971-2100 following the RCP8.5 scenario (high greenhouse gas emission). The COSMO-CLM is the community model of the German regional climate research. It is a non-hydrostatic RCM based on the COSMO (Consortium for Small-scale Modeling) numerical weather prediction model (http://www.cosmo-model.org). Details on the COSMO-CLM model can be found on the CLM web page http://www.clm-community.eu/. Our model configuration follows the setup used for simulations covering Europe (Jacob et al., 2013; Kotlarski et al., 2014), but with a microphysics scheme including prognostic cloud water, cloud ice, and graupel. Vertically, the model domain consists of 40 atmospheric layers reaching up to 23 km (ca. 40 hPa) and 9 soil layers down to 11.5 m using a multilayer soil model (Schrodin and Heise, 2002). To account for spin-up, the first 3 years (1968-1970) of the simulations have been neglected. Footer 12
Figure 4.2: Model domain and orography [m] used for the ProTrafo COSMO-CLM
simulation.

Footer                                                                  13
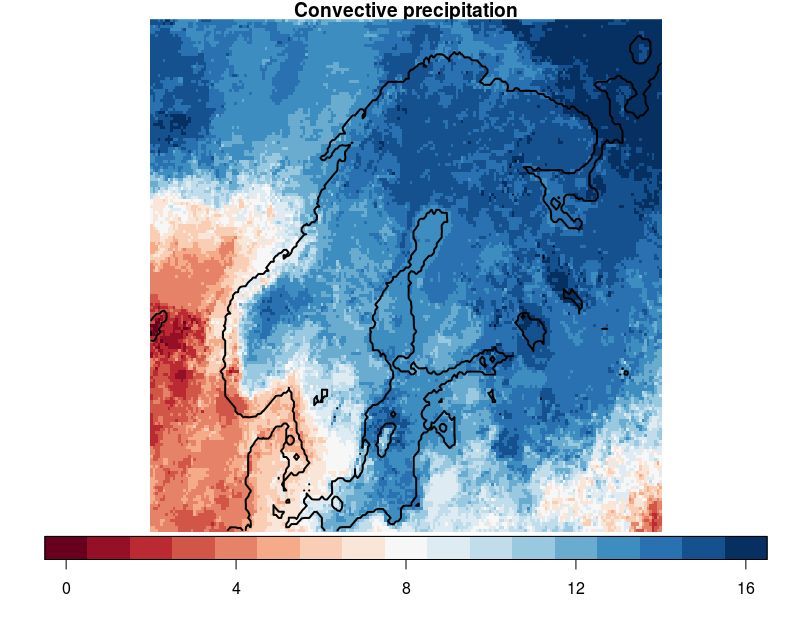
5. Analysis of ProTrafo climate scenario run
The general approach of climate scenario runs is described in the previous section. More
details on the applied climate scenario run used in ProTrafo (hereafter PTCR) is also
given there. In this section we analyse the results from PTCR before we compare the
results with other data and published literature in the next section.

Lightning is not explicitly described in climate models and the analyses rely on
lightning indices (e.g. indexes based on vertical stability and moisture availability). In
our study we first analyse the general stability of the atmosphere using temperatures at
850 (~1500m) and 500 (~5500m) hPa. This is done as a reduced vertical stability is a
prerequisite for convection to happen. In addition to stability, we focus on Convective
Available Potential Energy (CAPE) in combination with convective precipitation.
CAPE is a vertically integrated measure of buoyancy when an air parcel is lifted, which
is used in the daily lightning forecasting at MET Norway. In addition, Romps et al.
(2014) combined CAPE and convective precipitation to investigate changes in future
lightning in North America. CAPE can then be thought of as the potential for
convection, while the precipitation part counts for what was actually released.

Figure 5.1 shows the changes in tropospheric temperature and low level humidity for
PTCR. In the PTCR the temperature increases in the future, both at 850 hPa and at 500
hPa. Significant increases are seen in the average temperature and in the maximum and
minimum temperatures. However, the temperature increases more at higher altitudes
(500 hPa) than in the lower atmosphere (850 hPa) with the implication that the
temperature difference has a significant decrease between these levels (lower left panel).
So the results indicate a warmer atmosphere, but also an atmosphere that is getting more
vertically stable. A significant increase in relative humidity for the future is also seen
which in combination with a warmer atmosphere gives clear signals that more low level
humidity will be available. The changes in the vertical temperature gradient in the lower
left panel of Figure 5.1 is shown for each season in Figure 5.2. The atmosphere becomes

Footer                                                                                  14
significantly more stable in all seasons. However, the increase in stability is clearly
higher in the summer than in the winter.

The increase in low level humidity indicates a possible increase in lightning activity, but
is counteracted by the, in general, more stable atmosphere. Based on these changes it is
therefore very uncertain if and how lightning will change in a future climate. We
therefore investigate the possible changes in the product CAPE x convective
precipitation (Figure 5.3). Since the mechanisms for lightning production in Norway
varies in space and time, as discussed earlier, we look into possible changes for different
seasons and regions. CAPE x convective precipitation has a significant increase in all
regions in winter and spring. In autumn, most of the changes are not significant (but
slightly positive). During summer, we find only non-significant minor changes for the
highest combination of CAPE and convective precipitation. However, a significant
reduction in the 99 and 95%-tile is found.

In the PTCR, a general increase in atmospheric stability counteracts the presence of
more low level humidity in particular in the summer. Changes in CAPE and convective
precipitation further suggest that there might only be small changes (neutral or slight
reductions) in summer time lightning activity. However, it can be expected that the
lightning season is extended into the spring and autumn and intensified in the winter
along the Norwegian coast line.

Footer                                                                                   15
Figure 5.1 Percentiles of hourly values of T850 hPa, T500 hPa, T850 hPa - T500 hPa
and RH925 hPa respectively, each year from 1971 until 2100, for all seasons and all
three regions combined. The numbers on the right hand vertical axis give the total
change in the related percentile derived from a linear regression. Asterisks (or a dot)
next to a number denote the significance of the trend, according to the legend at the
bottom of the plot.

Footer                                                                               16
Figure 5.2 Percentiles of hourly values of the temperature difference between 850 hPa
and 500 hPa from 1971 until 2100, according to season (Dec-Feb, Mar-May, Jun-Aug,
Sep-Nov). The numbers on the right hand vertical axis give the total change in the
related percentile derived from a linear regression. Asterisks (or a dot) next to a
number denote the significance of the trend, according to the legend at the bottom of the
plot.

Footer                                                                                 17
Figure 5.3 Percentiles of hourly values of CAPE of most unstable parcel times
convective precipitation for each year from 1971 until 2100, according to region and
season. A logarithmic axis with a cutoff at 1, is used, due to the enormous differences,
both regional and seasonal. The numbers on the right hand vertical axis give the total
change in the related percentile derived from a linear regression. Asterisks (or a dot)
next to a number denote the significance of the trend, according to the legend at the
bottom of the plot. Each row of plots shows a separate region, and each column is a
different season.

Footer                                                                                18
6. ProTrafo climate scenario compared with other studies. Early studies focussing on global lightning suggest a general increase of lightning in a warmer climate (e.g., Price and Rind, 1994a; Brasseur et al., 2005; Hauglustaine et al., 2005, IPCC, 2007). However, more recent studies (Clark et al., 2017; Declan et al., 2018, Tost et al., 2007) show that the trends are sensitive to parameterizations involved, resulting either in large increases, mild increases or even a decrease in lightning flash density depending on the chosen parameterization schemes. For Norway, the simulations analysed in Midtbø et al. (2011) project an increase in lightning frequency for the country as a whole until 2050 of about 25%, but with an uncertainty ranging from 0 to 50%. The increase is growing towards 2100, with larger uncertainties for different seasons and regions. The new PTCR indicates a neutral or a small decrease in lightning during summer, but a longer lightning season. However, as the PTCR is just a single RCM/GCM scenario run, it gives only one possible future development and neglects any uncertainty in the projected changes. Thus, to put our simulation into a broader context (i.e., to add an uncertainty estimation), high-resolution (0.11°, ca. 12km) regional climate model projections available from the EURO-CORDEX framework (Table 2) have been analysed. As the model combination used for the PTCR (COSMO-CLM driven by MPI-ESM-LR) has also been used in EURO-CORDEX, a direct comparison is possible. As discussed in section 5, trends in convective (and thus lightning) activity are a result of two effects: 1) The amount of water vapour the atmosphere is able to hold is increasing with temperature, resulting in an increasing convective activity (i.e., increasing intensity) and 2) Stability in the atmosphere may increase, reducing the number of convective events (i.e., decreasing frequency). While analyses of future convective events agree that associated intense storms are more probable (Del Genio et al. 2007; Trapp et al. 2007; van Klooster and Roebber, 2009), the counteracting increase Footer 19
in stability is more uncertain and varying. Figure 6.1 shows the trends in number of
days with convective summer precipitation over Scandinavia as an indicator for
instability in the EURO-CORDEX RCP8.5 projections. As can be seen, there is a large
spread among the single models. The area average is ranging from -0.5 days per decade
(in the REMO2009 simulation driven by MPI-ESM-LR) to +0.5 days per decade (in the
RCA4 simulation driven by CNRM-CM5).
Table 2: List of EURO-CORDEX simulations used to estimate uncertainties in projected
changes of convective precipitation
Modelling institute ID RCM GCMs
CLMcom CCLM4-8-17 CNRM-CM5, EC-EARTH,
HadGEM2-ES,
MPI-ESM-LR
DMI HIRHAM5 EC-EARTH,
HadGEM2-ES,
NorESM1-M
IPSL-INERIS WRF331F IPSL-CM5A-MR
KNMI RACMO22E EC-EARTH,
HadGEM2-ES
MPI-CSC REMO2009 MPI-ESM-LR
SMHI RCA4 CNRM-CM5, EC-EARTH,
HadGEM2-ES,
MPI-ESM-LR
IPSL-CM5A-MR
Taking the ensemble mean over all 16 simulations yields a smooth field with increases
in northern and mountainous areas and a decrease along the southern coast lines. It also
shows that both the RCM (CCLM) and GCM (MPI-ESM-LR) used in the PTCR tend to
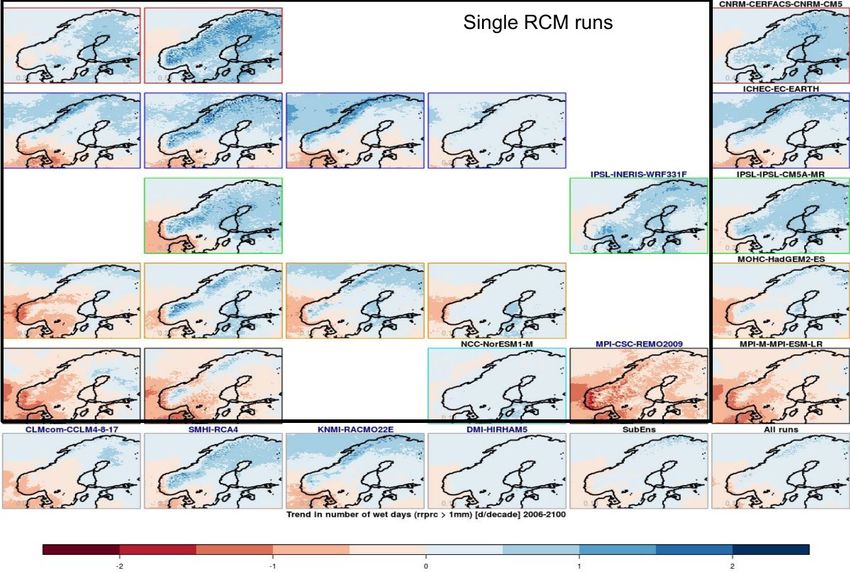
Footer 20give lower trends than other models but are no clear outlier. As the ensemble mean may be influenced by some overrepresented models (e.g., RCA and EC-EARTH), a sub-ensemble using each RCM and GCM only once was taken into account. However, as can be seen, the result of the sub-sample is in good agreement with the non-restricted average. Figure 6.1: Trends (in days per decade) in number of days with convective summer precipitation (days with more than 1mm of convective precipitation) over the time Footer 21
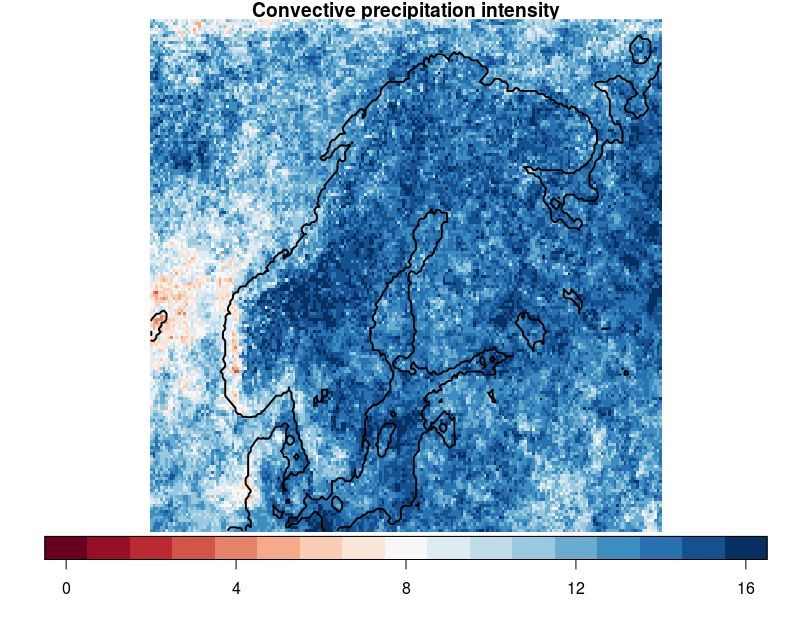
period 2006-2100 in different EURO-CORDEX simulations following RCP8.5. Blue
labels indicate means over a specific RCM, while black labeled plots show means over
a specific GCM (also indicated by differently colored frames). “All runs” gives the
mean over all RCM runs, while the “SubEns” show the mean of the sub-ensemble using
a model combination where each RCM and GCM is used only once.

To assess the robustness of the convective precipitation signal in the EURO-CORDEX
simulations, we show the number of EURO-CORDEX models with a positive trend in
summer (Figure 6.2). Most models agree on a decrease in the total convective
precipitation amount along the south-west coast with a steep, sharp gradient towards an
agreement on an increase inland in northern and mountainous areas. The pattern is
dominated by changes in frequency. For intensity, there is high agreement on an
increase throughout the domain, with the exception of a small area along the west-coast
towards Shetland where there is less agreement.

Considering total summer precipitation, the convective precipitation trends are
counteracting and dominating the large-scale precipitation trends in several regions. For
instance, along the south-western coast and towards Shetland the convective
precipitation trends are negative, highly influencing the agreement among the
EURO-CORDEX models in total summer precipitation trends (Figure 6.3). For the
more mountainous regions in the south-west, the models agree on an increase in
summer convective precipitation. Also here, this is partly dominating trends in the
large-scale precipitation resulting in an overall increase of total precipitation.

Footer                                                                                 22
Figure 6.2: Number of RCMs that agree on a positive trend for summer convective
precipitation amount (left) frequency (middle) and intensity (right).

Footer                                                                       23
Figure 6.3: Number of RCMs that agree on a positive trend for summer total (left),
large-scale (middle) and convective (right) precipitation amount.

7. Summary and conclusions
The Norwegian lightning sensor network is operated by MET Norway and data is
available at api.met.no. The network provides a good spatial picture of lightning activity
in Norway, but temporal trends are not well represented due to the development of the

Footer                                                                                  24
system over time. A Norwegian spatial lightning climatology shows a distinct difference between warm and cold season lightning. The warm season lightning is dominated by areas in south east Norway and follows the inside of the coast lines. This pattern is due to continental summer convective activity. In the cold season, lightning activity happens offshore and along the western coast line. The latter is due to convection in cold air over relatively warm sea which is further enhance by the coast convergence of the air masses. In general, the lightning activity decreases with latitude and altitude. Early global studies on changes in lightning activity indicate an increase in a future changing climate (e.g., Price and Rind, 1994a; Brasseur et al., 2005; Hauglustaine et al., 2005, IPCC, 2007). The study of Midtbø et al. (2011) about changes in lightning activity in Norway also indicated an increased future activity. However, more recent studies (Clark et al., 2017; Declan et al., 2018) show that the trends are much more uncertain and results vary from either large increases, mild increases or even a decrease in lightning flash density. In the ProTrafo Climate Run we find an increase in atmospheric stability (indicating potentially less lightning) counteracted by a warmer and more moist lower atmosphere (indicating potentially more lightning) and the total effect on lightning activity is uncertain. Convective Available Potential Energy x convective precipitation indicates an increase (more lightning) in winter, spring and autumn and no change or a small decrease (less lightning) in summer. However, the summer results can also be interpreted as fewer lightning events, but more severe when they happen. The latter is in agreement with van Klooster and Roebber (2009) stating that in a warmer and more moist climate, the frequency of triggering convection may not increase noticeably but, when convection is happening, there is sufficient energy available to make it more intense. Furthermore, comparing the results to EURO-CORDEX summer simulations indicate that a stabilisation of the atmosphere over the North Sea is affecting convective precipitation frequency (and partly even intensity) at the Norwegian coast, resulting in Footer 25
an overall decrease along the south-west coast. Most models agree on a decrease of convective summer precipitation in this region as a result of a decreasing frequency of events. In contrast, most models agree on an increase in convective summer precipitation over the nearby more mountainous region and there is only a small area in between where models disagree. The positive convective precipitation trends are partly dominating trends in large-scale precipitation, resulting in an overall increase in total precipitation. Interestingly, this is similar to findings by Giorgi et al. (2015) for a similar sample of EURO-CORDEX high-resolution simulations showing an increase in precipitation over high (European) Alpine regions as a result of increased convective rainfall dominating negative large-scale precipitation trends. Thus, this seems to be not specific to the European or Norwegian Alps, but may be a general behavior of the RCMs involved in EURO-CORDEX in mountainous areas. This is also supported by the findings of Wennerdahl (2017) showing that the RCA4 model (driven by 8 different GCMs) gives an increase in thunderstorm potential in a warmer future climate, with increases expected to be largest in mountainous regions of Europe. In summary, this study suggest that lightning in Norway will happen more frequently in winter, spring, autumn and in mountainous areas in the future. However, the frequency of traditional summer lightning (e.g. what is experienced in south Norway) will happen slightly less frequently, or with today's frequency. However, changes in the intensity of each individual lightning event are still uncertain. Footer 26
Acknowledgements This work is done in the ProTrafo project (Next Generation Protection of Transformers, Innovasjonsprosjekt i næringslivet, project number: 269303) financed by the Norwegian Research Council. Computational resources for the COSMO-CLM simulations have been provided by UNINETT Sigma2 - the National Infrastructure for High Performance Computing and Data Storage in Norway. We want to thank the climate modelling groups (listed in Table 2) for producing and making available their RCM model output. We also acknowledge the World Climate Research Programme’s Working Group on Regional Climate, and the Working Group on Coupled Modelling, former coordinating body of CORDEX and responsible panel for CMIP5, and the Earth System Grid Federation infrastructure, an international effort led by the U.S. Department of Energy’s Program for Climate Model Diagnosis and Intercomparison, the European Network for Earth System Modelling and other partners in the Global Organisation for Earth System Science Portals (GO-ESSP). Footer 27
References Brasseur, G.P., M. Schultz, C. Granier, M. Saunois, T. Diehl, M. Botzet, E. Roeckner, and S. Walters, 2006: Impact of Climate Change on the Future Chemical Composition of the Global Troposphere. J. Climate, 19, 3932–3951, https://doi.org/10.1175/JCLI3832.1 Clark, S. K., D. S. Ward, and N. M. Mahowald (2017), Parameterization-based uncertainty in future lightning ash density, Geophys. Res. Lett., 44, 2893–2901, doi:10.1002/2017GL073017 Declan L. Finney et al. A projected decrease in lightning under climate change. Nature Climate Change, published online February 12, 2018; doi: 10.1038/s41558-018-0072-6 Del Genio, A. D., M.-S. Yao, and J. Jonas, 2007, Will moist convection be stronger in a warmer climate?Geophys. Res. Lett., 34, L16703, doi: 10.1029/2007GL030525. Früh B., A. Will, C.L. Castro, 2016: Recent developments in Regional Climate Modelling with COSMO-CLM. Met. Z., 25(2), DOI: 10.1127/metz/2016/0788. Giorgetta, M.A., Jungclaus, J., Reick, C.H., Legutke, S., Bader, J., Böttinger, M., Brovkin, V., Crueger, T., Esch, M., Fieg, K. and Glushak, K., 2013: Climate and carbon cycle changes from 1850 to 2100 in MPI-ESM simulations for the Coupled Model Intercomparison Project phase 5. Journal of Advances in Modeling Earth Systems, 5(3), pp.572-597, doi:10.1002/jame.20038. Giorgi, F., Torma, C., Coppola, E., Ban, N., Schär, C. and Somot, S., 2016. Enhanced summer convective rainfall at Alpine high elevations in response to climate warming. Nature Geoscience, 9(8), p.584, https://doi.org/10.1038/NGEO2761 Hauglustaine, D.A., J. Lathière, S. Szopa, and G. Folberth, 2005: Future tropospheric ozone simulated with a climate-chemistry-biosphere model. Geophys. Res. Lett., 32, L24807, doi:10.1029/2005GL024031. Footer 28
IPCC, 2007. Climate Change 2007: The Physical Science Basis. Contribution of Working Group I to the Fourth Assessment Report of the Intergovernmental Panel on Climate Change. Solomon, S., D. Qin, M. Manning, Z. Chen, M. Marquis, K. B. Averyt, M. Tignor and H.L. Miller (eds.). Cambridge University Press, Cambridge, United Kingdom and New York, NY, USA, 996s. Jacob, D., Petersen, J., Eggert, B., Alias, A., Christensen, O.B., Bouwer, L.M., Braun, A., Colette, A., Déqué, M., Georgievski, G. and Georgopoulou, E., 2014: EURO-CORDEX: new high-resolution climate change projections for European impact research. Regional environmental change, 14(2), pp.563-578, https://doi.org/10.1007/s10113-013-0499-2. Kotlarski, S., Keuler, K., Christensen, O. B., Colette, A., Déqué, M., Gobiet, A., Goergen, K., Jacob, D., Lüthi, D., van Meijgaard, E., Nikulin, G., Schär, C., Teichmann, C., Vautard, R., Warrach-Sagi, K., and Wulfmeyer, V., 2014: Regional climate modeling on European scales: a joint standard evaluation of the EURO-CORDEX RCM ensemble, Geosci. Model Dev., 7, 1297-1333, https://doi.org/10.5194/gmd-7-1297-2014. Kjølle, G. H., 0. Mogstad og K. Samdal, 2006, Analyser av feil og avbrudd i kraftnettet 1989-2005, SINTEF Energiforskning AS Kjølle, G. H., A. Nybø, O. Gjerde, M. Catrinu, 2008, Kraftledninger, værpåkjenninger og forsyningssikkerhet, SINTEF Energiforsikring AS. Midtbø, K. H., J. E. Haugen, M. Køltzow, 2011, Lynstudien - Klimaendringenes betydning for forekomsten av lyn tilpassingsbehov i kraftforsyningen, Norges vassdrags- og energidirektorat, ISBN 978-82-410-0741-5, ISSN 1501-2832. Poelman, D. R., Schulz, W., Diendorfer, G., and Bernardi, M.: The European lightning location system EUCLID – Part 2: Observations, Nat. Hazards Earth Syst. Sci., 16, 607-616, https://doi.org/10.5194/nhess-16-607-2016, 2016. Footer 29
Price, C., and D. Rind (1994), Possible implications of global climate change on global lightning distributions and frequencies, J. Geophys. Res., 99(D5), 10823–10831, doi: 10.1029/94JD00019. Romps, D.M., Seeley, J.T., Vollaro, D. and Molinari, J., 2014. Projected increase in lightning strikes in the United States due to global warming. Science, 346(6211), pp.851-854, DOI: 10.1126/science.1259100 Schrodin, R. and E. Heise, 2001: The Multi-Layer Version of the DWD Soil Model TERRA-LM . COSMO Technical Report No. 2, Offenbach. Schulz, W., G. Diendorfer, S. Pedeboy and D. R. Poelman, The European lightning location system EUCLID – Part 1: Performance analysis and validation, Nat. Hazards Earth Syst. Sci., 16, 595–605, 2016 www.nat-hazards-earth-syst-sci.net/16/595/2016/ doi:10.5194/nhess-16-595-2016 Trapp RJ, Diffenbaugh NS, Brooks HE, Baldwin ME, Robinson ED, Pal JS. 2007. Changes in severe thunderstorm environment frequency during the 21st century caused by anthropogenically enhanced global radiative forcing. Proceedings of the National Academy of Science 104: 19719–19723. Tost, H., Jöckel, P., and Lelieveld, J.: Lightning and convection parameterisations – uncertainties in global modelling, Atmos. Chem. Phys., 7, 4553-4568, https://doi.org/10.5194/acp-7-4553-2007, 2007 Van Klooster, S.L. and P.J. Roebber, 2009: Surface-Based Convective Potential in the Contiguous United States in a Business-as-Usual Future Climate. J. Climate, 22, 3317–3330, https://doi.org/10.1175/2009JCLI2697.1 Wennerdahl, E., 2017: Change in Thunderstorm Activity in a Projected Warmer Future Climate: a Study over Europe, Degree Project at the Department of Earth Sciences, ISSN 1650-6553 Nr. 419 Footer 30
You can also read