Climate change is probably increasing the intensity of tropical cyclones
←
→
Page content transcription
If your browser does not render page correctly, please read the page content below

Climate change is probably increasing the intensity
of tropical cyclones
ScienceBrief Review                                                                                                                                     March 2021
                        1                    2                    2,3,4               4                   3                           5
Thomas R. Knutson , Maya V. Chung , Gabriel Vecchi                    , Jingru Sun , Tsung-Lin Hsieh and Adam J. P. Smith .
1 National Oceanic and Atmospheric Administration (NOAA), Geophysical Fluid Dynamics Laboratory (GFDL), Princeton, NJ 08540 USA. 2 Atmospheric and Oceanic Sciences
Program, Princeton University, Princeton, NJ 08540 USA. 3 High Meadows Environmental Institute, Princeton University, Princeton, NJ 08540 USA. 4 Department of
Geosciences, Princeton University, Princeton, NJ 08540 USA. 5 School of Environmental Sciences and Tyndall Centre for Climate Change Research, University of East Anglia
(UEA), Norwich NR4 7TJ, UK.

This ScienceBrief Review is part of a collection on Critical Issues in Climate Change Science, relevant to inform the COP26 climate conference to be
held in Glasgow. Eds: Corinne Le Quéré, Peter Liss, Piers Forster. Time stamp: Published 26 March 2021. The evidence reviewed was published between
16 March 2013 to 12 February 2021. Search keywords used: “Climate Change” AND “Cyclone” (also “Hurricane” OR “Typhoon”).

 Approach. This ScienceBrief Review examines the link
 between climate change and tropical cyclones (TCs,
 including tropical storms, hurricanes, and typhoons). It
 synthesises findings from more than 90 peer−reviewed
 scientific articles gathered using ScienceBrief. The
 Brief and evidence can be viewed at:
 sciencebrief.org/topics/climate-change-
 science/cyclones

 Summary. Warming of the surface ocean from
 anthropogenic (human-induced) climate change is
 likely fuelling more powerful TCs. The destructive
 power of individual TCs through flooding is
 amplified by rising sea level, which very likely has a                                   Snap shot of the Brief, showing moderate consensus among
 substantial contribution at the global scale from                                        the scientific publications analysed. Click here to visit the
 anthropogenic climate change. In addition, TC                                            Brief.
 precipitation rates are projected to increase due to
                                                                                          •   Observations since about 1980 show that,
 enhanced atmospheric moisture associated with
                                                                                              globally, the intensity and rate of intensification
 anthropogenic global warming. The proportion of
                                                                                              of TCs has increased slightly, with a stronger
 severe TCs (category 3 & 5) has increased,
                                                                                              positive trend observed for the North Atlantic.
 possibly due to anthropogenic climate change.
                                                                                              Modelling studies, supported by a theory of
 This proportion of very intense TCs (category 4 &
                                                                                              potential intensity of TCs, find that future mean
 5) is projected to increase, yet most climate model
                                                                                              intensities are projected to increase by about 5%
 studies project the total number of TCs each year
                                                                                              for a +2oC global warming scenario.
 to decrease or remain approximately the same.
 Additional changes such as increasing rates of                                           •   The global average proportion of intense TC
 rapid intensification, the poleward migration of the                                         occurrence (category 3 or higher; i.e., 1-minute
 latitude of maximum intensity, and a slowing of the                                          maximum wind speeds of 50 m/s or higher) has
 forward motion of TCs have been observed in                                                  increased since 1979, and the proportion of
 places, and these may be climate change signals                                              category 4-5 storms (winds 58 m/s or higher) is
 emerging from natural variability. While there are                                           projected to increase substantially under a
 challenges in attributing these past observed                                                warming climate.
 changes to anthropogenic forcing, models project
 that with global warming in coming decades some                                          •   The IPCC Fifth Assessment Report (Bindoff et al.
 regions will experience increases in rapid                                                   2013) conclude that an anthropogenic contribution
 intensification, a poleward migration of the latitude                                        to increased near-surface specific humidity has
 of maximum intensity or a slowing of the forward                                             been identified with medium confidence in
 motion of TCs.                                                                               observations. They also conclude that it is very
                                                                                              likely that there has been a substantial
                                                                                              anthropogenic forcing contribution to observed
 Key points.                                                                                  global mean sea level rise since the 1970s. Rising
 It is extremely likely that human influence has been the                                     sea levels lead to higher average inundation
 dominant cause of the observed global warming since                                          levels from TCs, all else being equal, while
                                                                                              enhanced atmospheric moisture probably leads
 1951, according to the IPCC Fifth Assessment Report
                                                                                              to greater rainfall rates in TCs, based on
 (Bindoff et al., 2013). Further warming will likely lead to
 an increased proportion of TCs of higher severity                                            theoretical expectations and TC simulations.
 (category 4 & 5) with more damaging wind speeds,                                             These changes enhance the risk of flooding
 higher storm inundation, and more extreme rainfall                                           from individual TCs, and are projected to
                                                                                              accelerate as warming continues. Storm surge
 rates (Knutson et al., 2015; 2019; 2020; Walsh et al.,
                                                                                              and flooding rainfall from TCs are extremely
 2016; 2019).
                                                                                              important for societal impacts of TCs as they have
                                                                                  1
been principal drivers of many of the large human              decade since 1979, according to satellite-based
    loss-of-life disasters associated with TCs.                    intensity estimates (Kossin et al., 2020). Statistically
•   Larger and more intense TCs tend to cause more                 significant increases were observed globally and in
    damage than smaller, weaker storms, so shifts                  several basins, including the North Atlantic basin by
    toward a greater proportion of intense storms are of           Kossin et al. (2020). Observations since the 1980s
    concern. Historical normalized economic damage                 indicate that globally, and to a greater degree in the
    from TCs for the U.S. since 1900 is closely linked to          North Atlantic, the likelihood of TC rapid intensification
    storm minimum sea level pressures, which in turn               (RI, when TC intensity changes by more than 18 m/s in
    are related to both storm intensity and size.                  24 hours) has increased (Bhatia et al., 2019). In terms
    However, there is as yet no significant trend in               of the longest available records of category 3-5 TCs,
    U.S. landfalling major hurricane frequency since               the frequency of landfalling major hurricanes for the
    1900, as measured by minimum sea level                         U.S. exhibits no significant trend since 1900 (Klotzbach
    pressures (Klotzbach et al., 2020), and this is the            et al., 2020), nor does a U.S. landfalling TC power
    longest available record of intense (category 3 or             dissipation index indicate any significant trend since
    higher) TC activity.                                           1900 (Landsea, 2005).

•   The observed global total number of TCs                        •   In the western North Pacific, tropical cyclones
    (including tropical storms and category 1−5                        making landfall in eastern and south-eastern Asia
    TCs) has not changed significantly in recent                       have increased in intensity over 1977-2014 by +12
    decades. Total TC records include weaker TCs                       to +15% (Mei and Xie, 2016).
    below major hurricane intensity, which statistically           •   In the North Indian basin, Mohapatra et al. (2015)
    tend to be less damaging, yet these TC records also                find, based on observations over 1951-2010
    comprise some of the longest observational records                 (monsoon and post-monsoon seasons), that the
    of TCs for trend analysis. Century-scale records of                probability of cyclonic disturbances intensifying into
    landfalling hurricanes for the U.S., TCs for Japan,                tropical cyclones has increased in the Arabian Sea
    and severe TCs for northeast Australia all show                    in association with decreased vertical wind shear.
    significant decreases or little change (Knutson et al.,            They further report that the probability of tropical
    2019). Century-scale recorded increases in Atlantic                cyclones intensifying into severe tropical cyclones
    basin-wide hurricane and tropical storm frequency                  has increased over the Bay of Bengal in association
    are not considered reliable but are consistent with                with increased low-level cyclonic vorticity. For the
    the impact of improved data quality. While the                     Arabian Sea, model simulations suggest that recent
    number of TCs is projected to decrease globally                    increases in the occurrence of extremely severe
    in most studies, there is uncertainty, with                        tropical cyclones in the post-monsoon season are
    increases or neutral trends predicted by some                      likely due in part to anthropogenic forcing
    models. Regional TC frequency changes are of                       (Murakami et al., 2017).
    mixed sign in model projections and exhibit                    •   In the North Atlantic basin, increasing intensity and
    large spread.                                                      intensification rate trends are interpreted as
•   Quantitative contributions of anthropogenic                        responding to some combination of changes in
    climate change to the global TC intensification                    atmospheric aerosol concentration, human−caused
    or increase in the proportion of intense tropical                  changes in greenhouse gas concentrations, and
    cyclones have not been confidently established,                    natural variability (Bhatia et al., 2019). Past
    in large part, because of sizable potential                        changes in aerosols have been suggested as
    contributions from natural multi-decadal variability               important in driving changes in the intensity of North
    and non-greenhouse gas forcing since the 1970s,                    Atlantic hurricanes over recent decades (Villarini
    when hurricane data is of the highest quality.                     and Vecchi, 2013), with increases in aerosol
    Trends in TC data can also be difficult to detect                  emissions after World War II and decreases after
    because the instrumentation used to measure TC                     the 1970s driving Atlantic hurricane intensity
    characteristics is itself evolving in time.                        decreases and increases, respectively. Further
•   Observations indicate that the latitude of                         research is required to better constrain the relative
    maximum intensity of TC activity has migrated                      contributions of these different influencing factors to
    poleward, particularly in the northwest Pacific                    the observed changes (Walsh et al., 2019).
    basin. This change has been assessed as unusual
    compared with expected natural climate variability
    with low-to-medium confidence, raising the potential
    that TCs at high intensity may begin to impact
    locations further poleward than they have
    previously, potentially affecting areas that may be
    less well adapted.

Observations and detection/attribution of
changes
The intensity of TCs has increased globally in
recent decades, with the proportion of category 3-5
cyclone occurrence growing by around 5% per                       Zoltan Tasi– Unsplash.com

                                                              2
The modelled effect of human−induced climate                     in later observations (Zhang et al., 2020). It has also
change on TC intensities is qualitatively consistent             been suggested that the global decline could instead
with the observed increases, but it is not clear                 be due to systematic data biases (Moon et al., 2019) or
whether an anthropogenic influence on TC                         natural variability, possibly combined with changes in
intensity or proportion of intense TCs is                        measurement technology after the introduction of
distinguishable from natural variability at present              satellite-based remote sensing of tropical cyclones in
(see review in Knutson et al., 2019). In one study,              the 1960s (Lanzante, 2019). Slower forward
Bhatia et al. (2019) demonstrate that observed                   propagation speed can be important for tropical
increases in TC rapid intensification in the Atlantic in         cyclone impacts, including an increase in rainfall and
recent decades are highly unusual (though not                    flooding, due to the longer duration a tropical cyclone is
unprecedented) compared to one model’s simulation of             within the same area (Kossin, 2018).
natural internal variability, an example of using
modelled climate variability to test for how unusual an          Concerning extreme TC precipitation events,
observed trend is estimated to be compared to natural            formal detection and attribution studies of
variability.                                                     individual events (Van Oldenborgh et al., 2017)
                                                                 suggest possible human contributions to observed
The latitude of maximum tropical cyclone intensity               extreme precipitation events from all sources,
has migrated polewards in both hemispheres,                      including TCs and other influences. The IPCC Fifth
coinciding with the poleward expansion of tropical               Assessment Report (Bindoff et al. 2013) conclude that
boundaries observed in some regions (Kossin et al.,              there is medium confidence that anthropogenic forcing
2016; Walsh et al., 2019; Staten et al., 2020). During           has contributed to intensified heavy precipitation in
the past 30 years, peak cyclone intensity has migrated           general at the global scale since the mid-20th century.
on the order of 50-60 km per decade in each                      They did not separately assess TC-related precipitation
hemisphere (Kossin et al., 2014). However, while                 extremes. Theoretical and model-based research
Kossin et al. (2016) show that the observed poleward             suggest a warming-induced increase in extreme TC-
migration of the latitude of maximum TC intensity in the         related rainfall rates (Knutson et al. 2020; Liu et al.
western North Pacific is robust to statistical removal of        2020). However, an anthropogenic influence on
Pacific Decadal Oscillation and El Niño/Southern                 observed TC-related rainfall that is outside the range of
Oscillation signals, there remains uncertainty regarding         estimated natural variability has not yet been
the extent to which the TC changes result from                   demonstrated in existing studies.
human−caused greenhouse warming; Knutson et al.                  •   One extreme precipitation event was driven by
(2019) concluded that there is low-to-medium                         Hurricane Harvey, which made landfall over Texas
confidence that the changes are highly unusual                       in August 2017, with very slow forward motion
compared to natural variability.                                     (translation speed) leading to extremely high multi-
•   Northward migration of the latitude of maximum                   day rainfall totals over the Houston area. Observed
    tropical cyclone intensity has been especially                   3−day total precipitation exceeded 750 mm over a
    pronounced in the northwest Pacific (Kossin et al.,              large area (van Oldenborgh et al., 2017). In the
    2016)                                                            early northern summer of 2017, the ocean heat
•   In recent decades, cyclone exposure in the western               content and sea surface temperature of the Gulf of
    North Pacific has decreased in the Philippines and               Mexico were at (then) record high levels, providing
    the South China Sea while increasing in the East                 the energy for intense evaporation, moistening the
    China Sea, Japan, and the Korean Peninsula                       atmosphere (Trenberth et al., 2018). Trenberth et
    (Colbert et al., 2015; Kossin et al., 2016; Xiang et             al. (2018) assert that the intensity of rainfall during
    al., 2020).                                                      Hurricane Harvey could not have occurred without
                                                                     human−caused climate change. Event attribution
    In the North Indian basin, northward migration of                studies estimated that climate change was
    the mean latitude of cyclone formation has been                  responsible for approximately +15% to +38%
    observed since the mid 20th century (Mohapatra et                increased rainfall intensity and a +3 to +3.5−fold
    al., 2015).                                                      increase in the likelihood of extreme multi-day
•   A statistically significant movement of TCs toward               precipitation events, such as the one associated
    land regions has been observed globally and in the               with Hurricane Harvey (van Oldenborgh et al., 2017;
    northwest Pacific basin during 1982-2018 (Wang                   Risser & Wehner, 2017). It was also found that
    and Toumi, 2021), although the relative                          urbanisation exacerbated the rainfall and flooding in
    contributions of natural variability and anthropogenic           Houston from Hurricane Harvey (Zhang et al. 2018).
    forcing to this observed trend have not been
    established.                                                 For tropical cyclone frequency (including tropical
                                                                 storms and category 1-5 TCs), the observed total
The forward motion (translation speed) of tropical               global annual number has not changed
cyclones may have slowed over the continental                    significantly in recent decades. While total TC
U.S. since 1901 (Kossin, 2019), although the causes of           frequency includes weaker TCs below category 3
this decline are uncertain. It is possible that this             intensity, which statistically tend to be less damaging,
change represents a climate change trend emerging                long TC frequency records also comprise some of the
from the background of natural variability. In contrast,         longest observational records of TCs for trend analysis.
while a slowing was observed globally since the mid-             Therefore, they can be useful for climate change
20th century (Kossin, 2018; 2019), the majority of this          detection/attribution studies, which are looking for
decline was during 1949−1981, with a weak or no trend            evidence of emerging greenhouse gas-induced trends.

                                                             3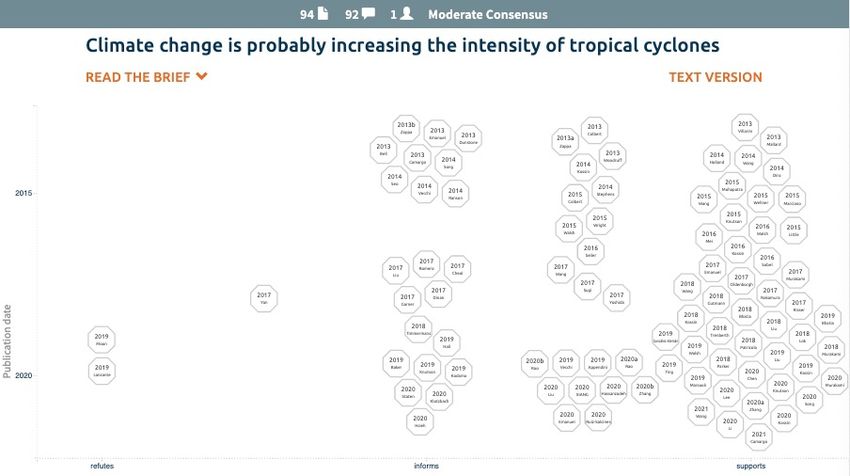
Century-scale records of landfalling tropical                    and are well-reproduced by climate models that
cyclones for the U.S., Japan, and northeast                      include anthropogenic forcings, this can greatly
Australia show significant decreases or little                   increase confidence in future model projections
change (Knutson et al., 2019). Century-scale recorded            driven by greenhouse gas increases; such is the
increases in Atlantic basin-wide hurricane and tropical          case for observed global mean temperature
storm frequency are consistent with the impact of                increases since 1900, for example.
improved monitoring, which suggests that these
recorded increases should not be interpreted strictly as         The observed TC timeseries with currently the
climate change signals (Vecchi and Knutson, 2011;                strongest cases that the changes are highly
Landsea et al., 2010). In a unique study comparing               unusual compared with expected natural variability
patterns of past observed TC frequency trends and                include: i) the poleward migration of latitude of
model simulations, Murakami et al. (2020) show that              maximum TC intensity in the northwest Pacific
two high-resolution coupled climate models, when                 since the 1940s (low-to-medium confidence of
forced with observed historical forcings, reproduce the          detection compared to natural variability); ii) the
global spatial pattern (a mixture of increases and               slowing of TC propagation speed over the
decreases) over 1980-2018. These simulations suggest             continental U.S. since 1901; and iii) increase in
that the observed regional increase in TC frequency in           rapid intensification of Atlantic TCs in recent
the Atlantic basin since 1980 is due, in part, to a              decades. (Cases (ii) and (iii) were published after
recovery from a preceding suppressed period of                   the Knutson et al. 2019 assessment and thus have
Atlantic TC frequency, due to increased aerosol forcing.         not yet been assessed but may have similar
Aerosol forcing increased in the mid-20th century and            confidence levels to case (i), i.e., low-to-medium
decreased following the 1980s.                                   confidence of detection compared to natural
                                                                 variability). The observed pattern of increases and
Murakami et al. (2020) also projects a decrease in               decreases in tropical storm frequency since 1980
tropical storm frequency globally and over the Atlantic          across the tropics can be simulated reasonably
over the coming century as greenhouse gas influences             well by two climate models forced by historical
increasingly dominate over projected aerosol                     forcings; this same model pair projects future
influences. Their finding is notable since their models          decreases in tropical cyclone frequency globally
are the only ones thus far that have demonstrated the            and over most tropical regions.
capability to simulate the observed pattern of TC
frequency change globally since 1980 fairly realistically.
Villarini & Vecchi (2012) and Dunstone et al. (2013)
also indicate that aerosol forcing was an important, if
not dominant, driver of multi-decadal Atlantic hurricane
variability, driving a reduction between the 1950s and
the 1980s and an increase since the 1990s. These
studies imply that trends in tropical cyclone frequency
since 1980 cannot be extrapolated to generate
predictions of what changes to expect over the coming
century due to increasing greenhouse gases.

Detection/attribution        of    climate      change
signal
In terms of assessment of the above findings, some
observed changes in tropical cyclone metrics,
including increased intensities and an increased
fraction of storms reaching major hurricane
strength,     are    qualitatively  consistent     with
expectations from models with climate warming. A
number of the observed TC changes may be early
indicators of emerging anthropogenic influence,
particularly if one is attempting to avoid
overlooking       or   understating    anthropogenic
influence on observed change (i.e., “Type II error
avoidance”, following Knutson et al., 2019).                                                       NASA – Unsplash.com
However, using assessment criteria that require
more robust evidence to conclude that observed
changes are unusual compared to natural
variability (i.e., “Type I error avoidance”), it is not          Future projections
clear whether the influence of anthropogenic
                                                                 Confidence in future projections depends on the
climate change on the observed changes in these
                                                                 capability of models for simulating the observed
tropical cyclone metrics is distinguishable from
                                                                 climatology of TC behaviour and any observed
natural variability at present (Knutson et al., 2019).
                                                                 trend or variability. Confidence also increases
These distinctions are important because if climate              when scientific understanding of physical
change trend signals are present that are highly                 mechanisms for changes is well developed, and if
unusual compared to estimated natural variability
                                                             4
there is a detectable and attributable trend in the effect of greenhouse gas-induced warming. However,
TC metric already present in observations. future greenhouse warming is anticipated to exceed the
effects of aerosol cooling on TC intensity, increasing
The proportion of tropical cyclones reaching
the likelihood of more intense tropical cyclones and
category 4 & 5 intensity is projected to increase in
rendering the changes more detectable compared to
a warming climate, with a corresponding reduction
natural variability (Villarini and Vecchi, 2013; Sobel et
in the proportion of low-intensity cyclones (Wehner
al., 2016).
et al., 2015; Bhatia et al., 2018; Vecchi et al., 2019;
Knutson et al., 2020). In one study, the annual number
Rapid intensification is projected to become more
of days in which category 4 & 5 storms are projected to
probable over the 21st century (Emanuel 2017;
occur increases 35% globally by the late 21st century
Bhatia et al. 2018), although relatively few studies
under a medium emissions future scenario (RCP4.5),
have examined this metric to date.
while the number of category 4 & 5 storms is projected
to increase 24% (Knutson et al. 2015), also implying an
Most studies project a decrease in the global
increase in duration per storm of category 4-5
frequency of tropical cyclones (tropical storms plus
conditions. Higher-resolution models are better suited
categories 1−5 combined) with warming, albeit with
for attempting to realistically simulate category 4 & 5
large uncertainty that includes the potential for
storms (Davis, 2018). Although models used in existing global increases. The vast majority of climate model
climate change studies are not optimal in that regard, a
studies predict a decrease in the frequency of tropical
survey of studies using relatively higher resolution (<
cyclone activity, or no change (e.g., Mallard et al.,
28 km grid spacing) models suggests a +10 to +15%
2013; Walsh et al., 2019; Knutson et al., 2015;
increase in the global proportion of these severe
Murakami et al. 2020), averaging around −14% for
cyclones in a +2oC warming scenario (Knutson et al., +2oC of warming in a multi-study assessment (Knutson
2020). For comparison purposes, the Knutson et al.
et al., 2020). There are some exceptions, with two
(2020) assessment re-scaled the TC projections from
modelling systems predicting increases in overall
many separate studies, which had assumed a mix of
cyclone frequency (Emanuel, 2013; Bhatia et al., 2018;
future emission scenarios, into a single group of
Vecchi et al., 2019), which reflects differences in the
estimates under an assumed +2oC global warming type and detailed formulation of models used.
scenario.
Theoretical explanations of the physical mechanisms to
Although the Knutson et al. (2020) assessment cause a change in cyclone frequency have been a
concluded that with medium-to-high confidence the challenging topic (e.g., Vecchi et al., 2019; Hsieh et al.,
proportion of category 4 & 5 storms relative to all 2020), compounding uncertainty around the model
storms would increase with global warming, there was projections (Walsh et al., 2016; Knutson et al., 2020).
low confidence in how the frequency of category 4 & 5 • Projections of TC frequency within individual basins
storms is expected to change, owing to the diversity of are more uncertain, particularly for the central and
projections across available modelling studies. A eastern North Pacific (Walsh et al., 2019). The
survey of future projections of category 4 & 5 storm majority of models project a small decrease but
frequency at the basin scale further highlights the some project increases (Knutson et al., 2020).
uncertainty in the expected sign of change (Knutson et
al., 2020). • Projections for the southern Indian and southwest
Pacific basins show strong agreement among most
• The eastern North Pacific shows the largest modelling studies for a reduction in cyclone
increase in category 4 & 5 storm frequency among frequency (Walsh et al., 2016; Knutson et al., 2020).
individual basin projections (Knutson et al., 2020). Large natural variability in these regions suggests
• In the North Atlantic, category 4 & 5 storms are the projected reductions in at least some models
projected to increase in frequency by a factor of 1.5 are not statistically significant (Walsh, 2015).
to 2.0, depending on emissions scenario, according
• Reductions are also projected for the North Indian
to one modelling study (Murakami et al., 2018),
(Mohapatra et al., 2015), tropical Atlantic, and
while a multi-study assessment reported uncertainty coastal East Pacific basins (Diro et al., 2014).
in the sign of change projected by different
modelling studies (Knutson et al. 2020).
Some models project changes in locations of storm
• For the southwest Pacific, most models project a
activity, such as a poleward migration of the
decrease in the frequency of Category 4 & 5
latitude of maximum tropical cyclone intensity in
cyclones (Knutson et al., 2020). the western North Pacific.
For tropical cyclone intensity, a +2oC warming • In the western North Pacific, a poleward migration
scenario is projected to yield a +5% (+1 to +10%) has been observed since the late 1940s. A
increase in maximum wind speed (Knutson et al., poleward migration is projected to occur under
2020), resulting in greater potential damage per future warming scenarios in some models (Kossin
storm. This estimate is consistent with thermodynamic et al., 2016), further altering the regional tropical
predictions using the potential intensity (PI) theory, cyclone risk. By the late 21st century, under a high
which estimates the theoretical maximum intensity of a future emissions scenario (RCP8.5), the average
cyclone within a specific local environment (Emanuel, latitude of storm formation is also projected to have
1987; Sobel et al., 2016). The presence of only a weak migrated further northwards. According to a
increasing trend in global historical tropical cyclone modelling study by Lok et al. (2018), the number of
intensity since 1980 is possibly due to the opposing tropical cyclones making landfall in south China is
effect of aerosol cooling (Sobel et al., 2016) on the projected to decrease, but the average intensity of
5those that do make landfall is projected to increase. convection−permitting regional model (Guttman et
• In the North Atlantic, future warming under a al., 2018).
medium future emissions scenario (CMIP3 SRES- • In the western North Pacific, studies have
A1B) is projected to result in a reduction of straight projected a +5 to +7% increase in rainfall rates of
moving tropical cyclones, with storm tracks curving typhoons occurring in a warmer climate (Wang et
to stay over the open ocean instead, according to al., 2014; 2015).
Colbert et al. (2013). This results in a reduction of
−1 to −1.5 cyclones per decade making landfall in Tropical cyclone size changes with climate
the southern Gulf of Mexico, Caribbean, and central warming could also be important for future impacts
America. A similar-sized increase was projected for because TC size is an important factor in storm
cyclone landfall over the U.S. mid−Atlantic region destructiveness. However, model projections of future
(Liu et al., 2017; 2018; Wright et al., 2015). changes in TC size changes vary across existing
studies, leading to low confidence at present in these
Future projections of the forward motion projections (Knutson et al., 2020).
(translation speed) of tropical cyclones is
uncertain, with different studies projecting both
increases and decreases. Future research is required
to reach consensus on the impact of human−caused
warming on translation speed (Knutson et al., 2020).
• In the Gulf of Mexico, one study projects an
increase in summer northward winds and a 10%
increase in translation speed, as well as an increase
in the rate of tropical cyclone landfall over Texas
(Hassanzadeh et al., 2020).
• In the North Atlantic, a high-resolution regional
model under a high future emissions scenario
(RCP8.5) projected a reduction of translation speed
by the late 21st century, compared to recent climate John Middelkoop – Unsplash.com
(Gutmann et al., 2018). Another study projected
decreasing TC translation speed, but this was
projected mainly in Northern Hemisphere
midlatitudes, for example, off the east coast of North Storm Surge Impacts
America, where TCs are typically recurving and Continued sea level rise will result in more severe
accelerating in the westerlies (Zhang et al., 2020). storm surge inundation and flooding, all else being
equal. Flood risk will likely be further exacerbated
The rainfall−rate of tropical cyclones is projected to by higher tropical cyclone intensities and
increase with human−caused global warming, and increased tropical cyclone rainfall rates, while
this is expected to exacerbate tropical cyclone uncertain changes in future tropical cyclone
flood risk (Wright et al., 2015; Kossin, 2018; Knutson frequency and storm tracks could reduce or further
et al., 2015; Liu et al., 2019). In a multi-model exacerbate these risks. In coastal regions, higher
assessment of tropical cyclones, under a +2oC warming storm inundation levels will be among the greatest
scenario, near-storm rainfall rates are projected to potential impacts of future tropical cyclones under
increase globally by an average of +14% (+6 to +22%), climate change, where the combination of likely
with the rainfall rate in many individual basins projected increased storm intensity and rainfall rates and
to incur similar increases (Knutson et al., 2020). There continued sea level rise will act to increase inundation
is general consistency among models in the sign of this risk of low−lying, unprotected regions (Walsh et al.,
projection, globally and at the basin scale. Projected 2019; Woodruff et al., 2013; Marsooli et al., 2019;
increases in tropical cyclone rainfall rates match, or Knutson et al., 2020). However, the net influence of
slightly exceed, thermodynamic expectations of about storm frequency change and storm track changes on
7% per degree Celsius of climate warming (Kodama et coastal surge risk is unclear: fewer tropical cyclones
al., 2019; Knutson et al., 2015; 2020; Liu et al., 2019). may occur, as simulated in the majority of studies,
This expectation is based on the Clausius−Clapeyron including a possible decrease even in category 4-5
relation, which implies that a tropical atmospheric tropical cyclones, as simulated in some studies
column will typically hold about 7% more water vapor (Knutson et al., 2020). If such changes materialised,
per degree Celsius increase of surface temperature. they would act to reduce surge risk, offsetting to some
Projected rainfall rate increases in excess of purely degree the increased risk due to sea level rise and the
thermodynamic expectations may be connected to the likely increases in storm intensities and precipitation
projected increase in storm intensity associated with rates.
warming (Liu et al. 2019).
• In the North Indian Ocean, one modelling study
suggests a possible +20% or +30% increase in
• In the North Atlantic, an +8 to +17% increase in
storm surge height along the Indian coast,
rainfall rate was projected for U.S. landfalling
depending on future warming scenario (Rao et al.,
tropical cyclones under a medium future emissions
2020a; 2020b).
scenario (SRES−A1B & RCP4.5) (Wright et al.,
2015) and a +24% increase using a high future • In the western North Pacific, storm surge levels in
emissions scenario (RCP8.5) with a high-resolution the Pearl River Delta region are projected to
6increase by +8.5% by the late 21st century 2020 in a climate change context:
(2075−2099) under a high future emissions
scenario (RCP8.5) (Chen et al., 2020). When The 2020 North Atlantic hurricane season was
combined with sea level rise and local geologic active, with the largest number of named storms on
displacement, storm inundation levels may increase record (30) and an above-average number of
by approximately 1m. intense hurricanes (six Category 3-5, five Category
4-5 hurricanes). The extreme number of named
• In the North Atlantic, Marsooli et al. (2019) project
storms, reaching Iota, included many that were of
that the combined effects of sea level rise and
relatively short duration; eight storms lasted as a
tropical cyclone storm surge by the late 21st century
tropical storm or stronger for only two days or less.
(2070−2095), under a high emissions scenario
Short-duration storms have likely had a spurious
(RCP8.5), will result in the historical 100−year flood
increase due to enhanced monitoring and reporting
level occurring every 1−30 years in the Gulf of
(Landsea et al., 2010, Villarini et al., 2011); however,
Mexico and southeast Atlantic coast, and every year
22 long-duration storms is still more than any year
in the mid−Atlantic coast. Little et al. (2015) found
since 1878, as reported in Landsea et al. (2010).
that climate models that projected the greatest 21st-
Thus, even when focusing on longer-duration
century increase in sea level in the North Atlantic
storms, 2020 appears to be the year with the most
also projected the greatest increase in Atlantic
named tropical storms since the late 19th century.
hurricane activity, leading to a further increased
2020 had many major hurricanes (six), but this is
probability of extreme storm surge outcomes over
not unprecedented. 2005 had seven major
the 21st century.
hurricanes, and other years with six major
• In the New York City region, the downscaling hurricanes include 2017, 2004, 1996, 1950, 1933,
model of Garner et al. (2017) projected that climate and 1926.
change impacts on hurricanes, apart from sea level
rise, has little net influence on storm surge risk in Observing more intense hurricanes is qualitatively
the region by 2300, as tropical cyclone tracks consistent with the expected impact of greenhouse
shifted away from landfall in the region under gas-induced warming on intense tropical cyclones
climate change, which offset the effect of storm (e.g., Bhatia et al., 2018; Murakami et al., 2020;
strengthening. Sea level rise acted to increase Knutson et al. 2020) and continues a recent multi-
storm inundation risk, all other factors equal. decadal increase in intense and rapidly intensifying
hurricane activity (e.g., Bhatia et al., 2019; Kossin
et al., 2020). However, this enhanced activity is also
consistent with a number of other coincident
Concluding Remarks climate drivers, including a contribution from the
This ScienceBrief Review is consistent with ongoing La Niña event of 2020, internal decadal
findings of the IPCC described in the Special Report climate variability (e.g., Yan et al., 2017), and the
on the Oceans and Cryosphere in a Changing Climate impact of reductions in aerosols over the tropical
(Pörtner et al., 2019). Their findings relating to tropical Atlantic in recent decades (e.g., Dunstone et al.,
cyclones are summarised as follows: 2013; Villarini and Vecchi, 2013; Murakami et al.,
2020). A quantitative partitioning between the
• “Anthropogenic climate change has increased various climate factors impacting the number of
observed precipitation (medium confidence), winds major hurricanes and rapidly intensifying
(low confidence), and extreme sea level events
hurricanes in the Atlantic during 2020 remains to
(high confidence) associated with some tropical be done, and with multiple plausible contributors to
cyclones, which has increased intensity of multiple an active hurricane season, the enhanced
extreme events and associated cascading impacts hurricane activity of 2020 cannot be attributed to
(high confidence).” anthropogenic climate change at this stage.
• “There is emerging evidence for an increase in
annual global proportion of Category 4 or 5 tropical
cyclones in recent decades (low confidence).”
• "Increases in tropical cyclone winds and rainfall, The full Brief and references since 2013 can be
and increases in extreme waves, combined with explored on sciencebrief.org/topics/climate-change-
relative sea level rise, exacerbate extreme sea level science/cyclones.
events and coastal hazards (high confidence).”
In addition, this review is also consistent with the References prior to 2013
findings of the WMO Task Team on Tropical
Cyclones and Climate Change, as described in two • Bindoff, N.L. et al., 2013: Detection and Attribution
assessment reports, focusing on detection and of Climate Change: from Global to Regional. In:
attribution of past tropical cyclone activity (Knutson et Climate Change 2013: The Physical Science Basis.
al. 2019) and projections of TC changes with future WG I, Fifth Assessment Report of the
global warming (Knutson et al., 2020). Intergovernmental Panel on Climate Change
[Stocker, T.F. et al. (eds.)]. Cambridge University
Press, Cambridge, United Kingdom and New York,
NY, USA
https://www.ipcc.ch/site/assets/uploads/2018/02/W
G1AR5_Chapter10_FINAL.pdf
7• Emanuel, K. A., 1987: The dependence of hurricane Acknowledgements.
intensity on climate. Nature, 326, 483–485,
ScienceBrief Reviews are supported by the European
https://doi.org/10.1038/326483a0
Commission via projects CRESCENDO, 4C, and
• Landsea, C., 2005: Hurricanes and global warming. VERIFY(grants no. 641816, 776810, 821003).
Nature 438, E11–E12, This review was supported in part by NOAA/OCO
https://doi.org/10.1038/nature04477 (award NA18OAR4310418), the Cooperative Institute
• Landsea, C. et al. 2010: Impact of Duration for Modeling the Earth System (CIMES; NOAA award
Thresholds on Atlantic Tropical Cyclone Counts, NA18OAR4320123) at Princeton University, NASA
Journal of Climate, 23 (10), 2508–2519, (award 80NSSC19K0482), and the Carbon Mitigation
https://doi.org/10.1175/2009JCLI3034.1 Initiative (CMI) at Princeton University’s High Meadows
Environmental Institute.
• Pörtner, H.-O. et al. (eds), 2019: IPCC Special
The authors thank K. Emanuel, B. Reichl and Y. Sun
Report on the ocean and cryosphere in a changing
climate, https://www.ipcc.ch/srocc/ for comments on an earlier version of this Review.
• Vecchi, G. A., & Knutson, T. R., 2011: Estimating About ScienceBrief.
annual numbers of Atlantic hurricanes missing from
the HURDAT database (1878–1965) using ship ScienceBrief is a web platform that helps make sense
track density. Journal of Climate, 24 (6), 1736-1746, of peer-reviewed publications and keep up with
https://doi.org/10.1175/2010JCLI3810.1 science. It is written by scientists. ScienceBrief
Reviews support transparent, continuous, and rapid
• Villarini, G., & Vecchi, G. A., 2012: Twenty-first- reviews of current knowledge.
century projections of North Atlantic tropical storms
ScienceBrief is supported by the University of East
from CMIP5 models. Nature Climate Change, 2 (8),
Anglia (UEA). The platform was initiated with funding
604-607, https://doi.org/10.1038/nclimate1530
from the UK NERC International Opportunities Fund
(NE/N013891/1). The ScienceBrief platform is
developed by Anthony Jude De-Gol.
Suggested citation.
Knutson, T. R., Chung, M. V., Vecchi, G., Sun, J.,
Hsieh, T-L. and Smith, A. J. P., 2021: ScienceBrief sciencebrief.org
Review: Climate change is probably increasing the
intensity of tropical cyclones. In: Critical Issues in
Climate Change Science, edited by: Corinne Le Quéré,
Peter Liss & Piers Forster. news.sciencebrief.org
https://doi.org/10.5281/zenodo.4570334
ScienceBrief ReviewYou can also read