Hurricanes as an enabler of Amazon fires - Nature
←
→
Page content transcription
If your browser does not render page correctly, please read the page content below
www.nature.com/scientificreports
OPEN Hurricanes as an enabler
of Amazon fires
Enoch Yan Lok Tsui1,2* & Ralf Toumi1,2
A teleconnection between North Atlantic tropical storms and Amazon fires is investigated as a
possible case of compound remote extreme events. The seasonal cycles of the storms and fires are
in phase with a maximum around September and have significant inter-annual correlation. Years of
high Amazon fire activity are associated with atmospheric conditions over the Atlantic which favour
tropical cyclones. We propose that anomalous precipitation and latent heating in the Caribbean,
partly caused by tropical storms, leads to a thermal circulation response which creates anomalous
subsidence and enhances surface solar heating over the Amazon. The Caribbean storms and
precipitation anomalies could thus promote favourable atmospheric conditions for Amazon fire.
South America, together with Equatorial Asia, are the two major regions contributing to the global net fire
carbon emission1. High-frequency fires have also been shown to impact the unique ecological structure and
biodiversity in the A mazon2. The drivers of fires in the Amazon region have gained much interest3–5. It is well
known that Amazonian fires are ignited by h umans6–8 and are thus not purely meteorological events. In this
paper, the meteorological conditions that enable fires and are thus a cause of interannual variability are the
principal concern. Chen et al.4 proposed an empirical seasonal prediction model for the total fire count from
May onwards using North Atlantic sea surface temperature (SST) during the boreal spring. Fernandes et al.3
studied the relationships among West Amazon fires and precipitation (76◦ W–70◦ W , 14◦ S–3◦ S) from July
to September and North Atlantic SST in the preceding months. These predictions are based on the prevailing
understanding that anomalously high tropical North Atlantic SST relative to the tropical South Atlantic results
in a northwards shift of the Atlantic Intertropical Convergence Zone (ITCZ)9,10 and thus reduces the amount
of precipitation the Amazon r eceives11–13. Yoon and Z eng12 showed that the North Atlantic SST correlates with
the mean precipitation of the whole Amazon catchment throughout the year, except in the height of the boreal
winter. However this area is much larger than the active fire region. Reduced Amazon precipitation is thought
to promote fire activities t here3,4,14. These studies have focused on seasonal prediction and still leave open the
question on the direct physical link between the Atlantic and Amazon fires during the actual fire season. Here
we identify this link as through anomalous precipitation in the ITCZ and in particular, for the first time, the
important role of Caribbean storms.
The SST affects tropical storm activities and properties. An increase in SST increases water vapour in the
lower troposphere, both of which make more energy available for atmospheric convection and tropical cyclone
development15. The intensity and the number of tropical cyclones in the North Atlantic could increase with
increasing tropical North Atlantic SST16,17. Dynamical factors are also important as tropical cyclone genesis and
intensification is favoured by weak vertical wind shear18, low-level cyclonic circulation19 and a weakening of the
easterly trade wind over the C aribbean20.
Chen et al.14 identified a relationship between June to November Amazon fires, and earlier (March to June)
North Atlantic SST anomalies and the number of annual North Atlantic tropical cyclones. Intriguingly, they
showed that the correlation between fires and tropical storms is actually greater than that between SST and either
fires or tropical storms. They concluded that the correlation between fires and tropical storms cannot be fully
explained by assuming only a common linkage of the two with the SST. However, they did not identify other
possible causes or explanations for this. Here we hypothesise that tropical cyclones rainfall could play an active
role in promoting Amazon fire conditions and the role of SST is actually minor. We suggest that anomalous pre-
cipitation and associated latent heating in the Caribbean due to tropical storms can provide a direct link between
North Atlantic tropical storms and Amazon fires through a direct thermal circulation anomaly.
1
Department of Physics, Imperial College London, London SW7 2AZ, UK. 2Leverhulme Centre for Wildfires,
Environment and Society, London, UK. *email: e.tsui20@imperial.ac.uk
Scientific Reports | (2021) 11:16960 | https://doi.org/10.1038/s41598-021-96420-6 1
Vol.:(0123456789)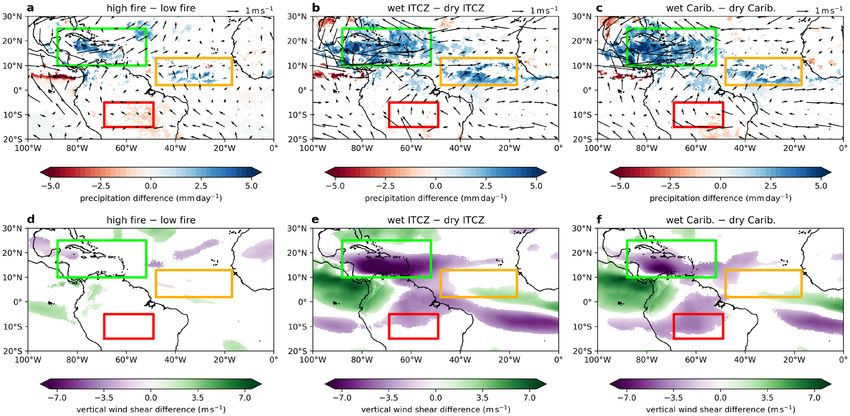
www.nature.com/scientificreports/

                                            Figure 1.  Climatology of Amazon fires and North Atlantic tropical storms. (a): Average annual fire count
                                            between 2001 and 2018. The red box is the most fire-active region. (b): Seasonal cycles of Amazon fire count and
                                            North Atlantic (NA), Caribbean (Carib.) and non-Caribbean (non-Carib.) tropical storm number computed
                                            from 2001 to 2018.

                                            Figure 2.  Relationship between Amazon fires and North Atlantic tropical storms. (a): Scatter plot with linear
                                            best fit of ASO Amazon fire count against ASO Caribbean tropical storm count in the years 2001–2018. (b):
                                            Same as (a) except for non-Caribbean tropical storm count.

                                            Results
                                            Seasonal cycles of storms and fires. The annual fire count in the Northern South America is shown
                                            in Fig. 1a, from which the most fire-active region (69◦ W–49◦ W, 15◦ S–5◦ S) in the Amazon is identified.
                                            Figure 1b shows the seasonal cycles of North Atlantic tropical storm number and Amazon fire count from 2001
                                            to 2018. The seasonal cycles of storm and fire are in phase with a clear maximum in September. The 3 months
                                            from August to October (ASO) account for more than 75% of North Atlantic tropical storm counts, Caribbean
                                            (88◦ W–52◦ W, 10◦ N–25◦ N) storm counts, non-Caribbean storm counts (North Atlantic storms that did not
                                            enter the Caribbean box) and Amazon fire counts throughout the year. Figure 2 shows scatter plots with linear
                                            best fits for ASO Amazon fire count against both Caribbean and non-Caribbean ASO tropical storm number.
                                            Correlation analysis reveal significance between Amazon fire count and North Atlantic (r = 0.58, p < 0.05) and
                                            Caribbean (r = 0.56, p < 0.05) storm number but not with non-Caribbean storm number (r = 0.13, p = 0.60).
                                            We also performed correlation analysis for other 3-month windows between June and November (JJASON) and
                                            for JJASON. The results are similar to those for ASO, in particular across all windows analysed, the correlations
                                            between Amazon fire and tropical storm remain significant for North Atlantic (except for JJA) and Caribbean
                                            storms and insignificant for non-Caribbean storms. Motivated by the seasonal cycles of fire and storm, we focus
                                            on ASO, which is the most active season for both, for the rest of the paper.

                                            North Atlantic SST and ITCZ behaviour.               Previous work was focused on the boreal spring and summer,
                                            which precedes the fire season. We find the behaviour of the variables in spring (MAM) quite different to ASO.
                                            We rank the years 2001–2018 by Amazon fire count and determined the composite anomalies of the precipita-
                                            tion and SST between the highest and lowest 5 years. In MAM, the fire region is immediately to the south of
                                            the ITCZ (Fig. 3a), thus any meridional shift of the ITCZ will directly affect the amount of precipitation the
                                            fire region receives. However, in ASO, the ITCZ has shifted much further north (48◦ W–17◦ W, 2◦ N–13◦ N)
                                            and no longer overlaps the fire region (Fig. 3c). In MAM, there is a clear meridional shift of the Atlantic ITCZ
                                            between the high and low fire years (Fig. 3b). However, no such shift is observed in ASO rather it is the amount
                                            of precipitation that is different (Fig. 3d). The composite precipitation anomaly over the fire region is significant
                                            in both MAM and ASO, with the absolute magnitude during ASO being around half of that during MAM. Fur-

          Scientific Reports |   (2021) 11:16960 |               https://doi.org/10.1038/s41598-021-96420-6                                                    2

Vol:.(1234567890)
www.nature.com/scientificreports/
Figure 3. Precipitation and SST climatology and anomalies. (a), (c): Climatology of (a) MAM and (c) ASO
precipitation between 2001 and 2018. (b), (d): Same as (a) and (c) except for composite difference (significant
at 95% confidence interval) of the top and bottom 5 years between 2001 and 2018 ranked by ASO Amazon fire
count. Average precipitation difference over the Amazon is given in the lower right. (e), (g): Same as (a) and (c)
except for SST. (f), (h): Same as (b) and (d) except for SST. (a)–(h): The red box is the Amazon fire region. (c)–
(d): The orange box includes the Atlantic ITCZ.
thermore, the correlation of ASO fire count with Amazon precipitation is significant for both MAM (r = −0.50,
p < 0.05) and ASO (r = −0.55, p < 0.05; non-detrended: r = −0.40, p = 0.10). A clear tropical North Atlantic
SST warm anomaly is observed in MAM (Fig. 3f). However, this SST signal is barely significant in ASO (Fig. 3h).
The SST climatology in these two seasons are shown in Fig. 3e, g. North Atlantic SST in MAM does appear to act
as a precursor to the precipitations over parts of the North Atlantic in ASO. In particular, MAM North Atlantic
SST correlates significantly with both ASO Atlantic ITCZ (r = 0.85, p < 0.01) and ASO Caribbean (r = 0.77,
p < 0.01) precipitations.
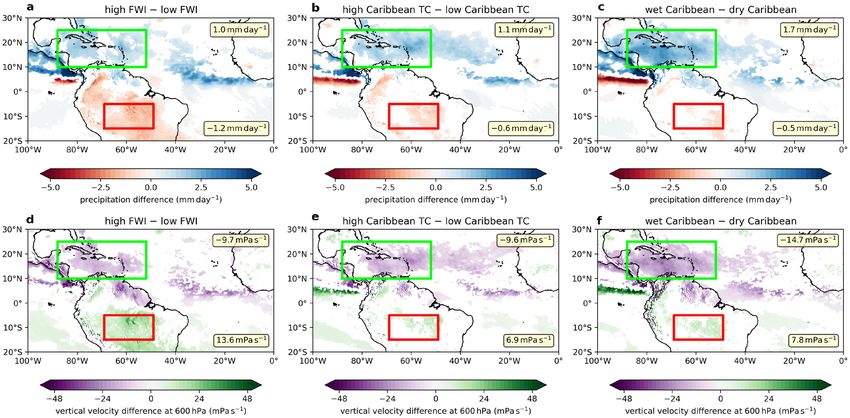
Atlantic ITCZ and Caribbean precipitation. We next explore the relationships between Amazon fire
activities, ASO ITCZ precipitation, Caribbean precipitation and North Atlantic tropical cyclones through com-
posite difference of anomalous years. We ranked the years 2001–2018 by three criteria: fire count, Atlantic ITCZ
precipitation and Caribbean precipitation. The composite anomalies of the precipitation, horizontal wind at
850 hPa and 850–200 hPa vertical wind shear between the highest and lowest 5 years were determined. The
anomaly patterns for the variables studied show common features across all three criteria. In direction consist-
ent with more fires, there is more precipitation in the Caribbean and the ASO Atlantic ITCZ (Fig. 4). There are
also anomalous low-level westerlies which are part of an extended anomalous low-level cyclonic circulation
over the entire Caribbean. Reduced vertical wind sheer is found along a corridor where much of the North
Atlantic tropical cyclones develop, although between the high and low fire years, a large part of this reduction
is deemed insignificant by bootstrapping. These conditions of enhanced low level vorticity and reduced vertical
wind shear favour tropical cyclone genesis and intensification. Anomalous convergence is found in the Atlantic
ITCZ including strong inflow from the south driving enhanced precipitation. The precipitation over the Atlantic
ITCZ and the Caribbean are highly correlated (r = 0.84, p < 0.01), showing coherence of these two regions.
Caribbean storms and Amazon fires. We next explore the relationships between the Caribbean storm
count and the fires. The fire count and the Caribbean precipitation (r = 0.59, p < 0.01; non-detrended: r = 0.52,
p < 0.05), the Caribbean tropical storm number and the Caribbean precipitation (r = 0.66, p < 0.01) and the
fire count and the Caribbean tropical storm number (r = 0.56, p < 0.05) all show significant correlations. The
fire count also correlates with the Atlantic ITCZ precipitation (r = 0.56, p < 0.05; non-detrended: r = 0.45,
p = 0.06) but not with non-Caribbean storm number (r = 0.13, p = 0.60).
If we hypothesise an active role for tropical cyclones, it is important to estimate the storm contribution to
Caribbean precipitation anomalies. To test this, we replaced the precipitation of Caribbean tropical storm days
with the n-day moving average non-storm day climatology. By taking the difference, we inferred that the tropical
storms account for 35–36% (n between 3 and 15) of the precipitation anomaly between the wettest and driest
5 years in the Caribbean. This result is robust and larger (65%) when we simply replace storm days with zero
precipitation. Therefore, tropical cyclones contribute substantially to precipitation anomalies in the Caribbean.
We can also examine individual year to support the relationship. For example, 2010 was a year with record (over
the years studied here) Atlantic ITCZ precipitation, record Caribbean precipitation and record storm count.
2010 was also the year with the second highest Amazon fire count.
Atmospheric Amazon fire risk factors. The connection between the Caribbean and the Amazon can be
further explored by examining the tropical storms and precipitation over the Caribbean and the vertical veloc-
ity, surface solar radiation flux and a fire risk index (FWI) over the Amazon. While TRMM precipitation data
Scientific Reports | (2021) 11:16960 | https://doi.org/10.1038/s41598-021-96420-6 3
Vol.:(0123456789)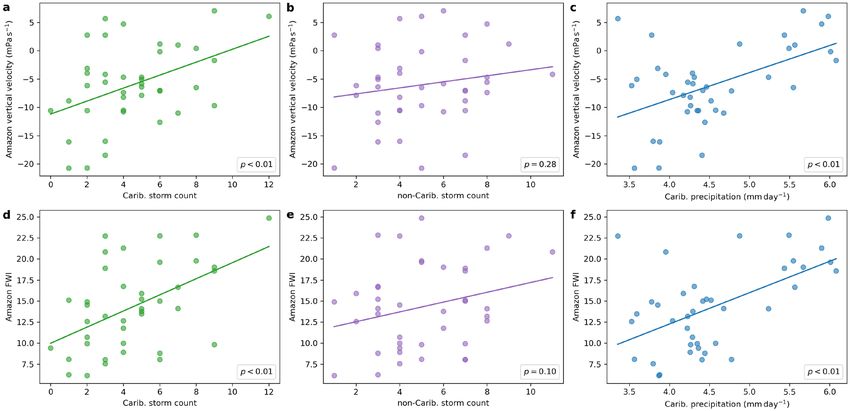
www.nature.com/scientificreports/
Figure 4. Horizontal wind, precipitation and vertical wind shear anomalies. (a)–(c): Composite difference
for ASO of horizontal wind at 850 hPa and precipitation (significant at 95% confidence interval) of the highest
and lowest 5 years between 2001 and 2018 ranked by (a) ASO Amazon fire count, (b) ASO Atlantic ITCZ
precipitation and (c) ASO Caribbean precipitation. (d)–(f): Same as (a)–(c) except for 850–200 hPa vertical
wind shear. (a)–(f): The boxes are Amazon (red), Atlantic ITCZ (orange) and Caribbean (green).
and MODIS fire data are available only respectively from 1998 and 2001 onwards, ERA5 precipitation data and
the FWI produced by the Copernicus Emergency Management Service for the European Forest Fire Informa-
tion System from ERA5 data allows us to analyse a much longer period from 1980 to 2019. For the common
period with both MODIS and FWI data, the fire count and risk index are positively correlated with significance
(r = 0.58, p < 0.05; non-detrended: r = 0.31, p = 0.21). As with fire count, the FWI is significantly correlated
to both Caribbean precipitation (r = 0.58, p < 0.01) and Caribbean storm number (r = 0.33, p = 0.05; non-
detrended: r = 0.50, p < 0.01) but not with non-Caribbean storms (r = 0.13, p = 0.41) between 1980 and 2019.
During the same period, the vertical velocity at 600 hPa shows significant correlations with the FWI (r = 0.83,
p < 0.01), Caribbean precipitation (r = 0.49, p < 0.01) and Caribbean storm number (r = 0.32, p < 0.05; non-
detrended: r = 0.43, p < 0.01) but not with non-Caribbean storms (r = 0.08, p = 0.62). Figure 5 shows that
suppressed ascent and enhanced FWI over the Amazon is associated with more Caribbean storms and precipita-
tion but not with non-Caribbean storms. The vertical velocity at 600 hPa is correlated with surface solar radia-
tion flux (r = 0.93, p < 0.01), which is in turn correlated with the FWI (r = 0.85, p < 0.01). We further rank the
years 1980–2019 by Amazon FWI, Caribbean tropical storm count and Caribbean precipitation and determined
the composite anomalies of the precipitation and vertical velocity at 600 hPa between the highest and lowest 13
years. Figure 6 shows that when there is higher FWI in the Amazon, more precipitation and ascent over the Car-
ibbean, there is also significant anomalous descent and reduced precipitation over the Amazon. The anomalous
subsidence can reduce any local mean ascent. This in turn reduces the cloud cover and enhances the surface solar
radiation flux. The FWI is enhanced by lower relative humidity and higher surface temperature.
Discussion
We find that the seasonal cycles of North Atlantic tropical storms and South Amazon fires are in phase and both
peak in September. Furthermore, most of the Amazon’s fires and North Atlantic tropical storms are found within
ASO. This establishes ASO as a critical season for understanding a possible teleconnection between the two. The
Amazon fire count is significantly correlated only with Caribbean tropical storm number (r = 0.56, p < 0.05)
but not with the non-Caribbean ones (r = 0.13, p = 0.60 ), even though the Caribbean and non-Caribbean
tropical storms both account for around half of all North Atlantic tropical storms on average. Correlation and
composite analysis further reveal a link between Caribbean tropical storm count and Amazon fires via Caribbean
and Amazon vertical atmospheric motion. Much of the ASO precipitation and ascent anomaly in the Caribbean
can be accounted for by the tropical storms in the region. We further find anomalous atmospheric conditions
favourable for North Atlantic tropical cyclone genesis and intensification when there are more fires. The ITCZ
precipitation intensification is also associated with more Amazon fires.
The current paradigm links the fire variability to the varying amount of precipitation over the A mazon3,4,14.
The Amazon precipitation variability is in turn attributed to meridional Atlantic ITCZ shifts responding to Atlan-
tic SST anomalies9,10. These studies aimed to predict fire activity and thus were focused on precursor variables
in the boreal spring and summer. Our study focuses exclusively on the peak fire season (ASO) and concurrent
atmospheric conditions. We do not find a meridional shift in the ITCZ during this season rather anomalous
Scientific Reports | (2021) 11:16960 | https://doi.org/10.1038/s41598-021-96420-6 4
Vol:.(1234567890)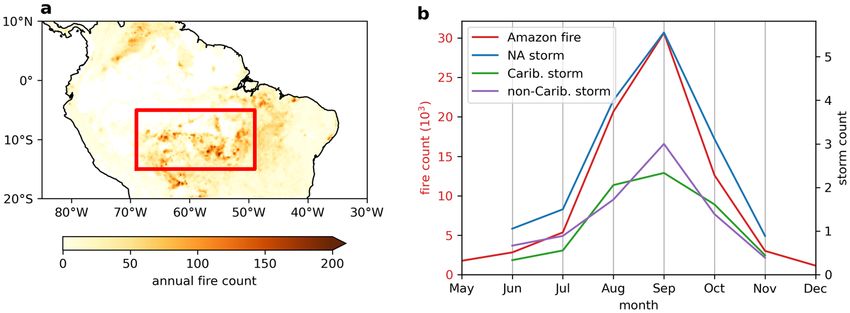
www.nature.com/scientificreports/
Figure 5. Relationship between the Amazon and the Caribbean. (a): Scatter plot with linear best fit of ASO
Amazon vertical velocity at 600 hPa against ASO Caribbean tropical storm count computed from 1980 to
2019. (b): Same as (a) except for non-Caribbean tropical storm count. (c): Same as (a) except for Caribbean
precipitation. (d)–(f): Same as (a)–(c) except for Amazon FWI.
Figure 6. Thermal direct cell between the Caribbean and the Amazon. (a)–(c): Composite difference
(significant at 95% confidence interval) for ASO precipitation of the top and bottom 13 years between 1980
and 2019 ranked by (a) ASO Amazon FWI, (b) ASO Caribbean tropical storm count and (c) ASO Caribbean
precipitation. Average precipitation difference (significant at 95% confidence interval) over the Caribbean and
the Amazon are given in the upper right and lower right respectively. (d)–(f): Same as (a)–(c) except for vertical
velocity at 600 hPa.
precipitation over the Caribbean (and the ITCZ). These findings are consistent with current understanding of
South America precipitation variability21, where the meridional shift of the Atlantic ITCZ is attributed to the
precipitation variability in the boeral spring but not autumn. It is clear from these results that the Amazon fire
count and precipitation in the peak fire season, ASO, have very different relationships with the Atlantic precipita-
tion and SST than those studied previously for pre-seasons.
Scientific Reports | (2021) 11:16960 | https://doi.org/10.1038/s41598-021-96420-6 5
Vol.:(0123456789)www.nature.com/scientificreports/
From our study a more complete understanding of the drivers of Amazon fires emerges and we identify
possible sources of seasonal Amazon fire predictability. The MAM Atlantic SST anomalies could be a persistent
precursor to an enhanced ASO Atlantic ITCZ, which favours tropical cyclones. This is supported by a significant
correlation between the two (r = 0.85, p < 0.01). Here we conclude that it is the ASO Caribbean precipitation
and tropical storms that can provide a plausible direct physical link to the fires. Another example of tropical
cyclones and fires as a pair of remote compound extreme events with teleconnection in the zonal rather than
meridional direction has recently been reported by Stuivenvolt Allen et al.22.
An active hurricane season in the Caribbean brings anomalous precipitation and therefore latent heating.
Localised heating and ascent to the north of the Equator drives a thermally direct circulation causing raised pres-
sure and anomalous subsidence in the Southern Hemisphere akin to the Hadley Cell circulation. This anomalous
subsidence reduces precipitation and cloud cover, promotes surface solar heating and leads to higher surface
temperatures which are favourable for fire.
In the classic Hadley Cell, warm rising air near the Equator reaches the stable tropopause and travels down
the high-level pressure gradient polewards, cools and sinks in the subtropics. Studies have found that similar
circulation can develop with an off-equatorial ascending branch to the north and a descending branch to the
south of the Equator. Simulations by Rodwell and H oskins23 incorporating orography and forced with heating
of the monsoon precipitation showed that in both the Americas and West Africa, off-equatorial heating in the
Northern Hemisphere induces local thermal, Hadley-type, circulation with an ascending branch around the
heating region and a descending branch to the south across the Equator. Krishnan et al.24 simulated the Indian
summer monsoon with a precipitation peak over the Bay of Bengal (7◦ N–23◦ N) and a thermal direct circula-
tion with a descending branch between 35◦ S and 15◦ S.
The thermal direct cell circulation is also captured by the simplified Matsuno–Gill m odel25,26. In one of the
26
solutions , the area of subsidence is equidistant from the Equator and zonally displaced slightly east of the
heating region. In another idealised s imulation27 with heating centred at 10◦ N, subsidence is observed between
20◦ S and 5◦ S, centred further from the Equator than the heating region. However, the pressure contour and
flow pattern resulting from the idealised Matsuno–Gill model can be modified considerably by factors such as
the shape and equatorial off-set of the heating region and the presence of background zonal wind26. In our case,
the area of anomalous subsidence over South Amazon has a slight zonal off-set to the east of and is closer to the
Equator than the heating in the Caribbean, similar to the results by Rodwell and Hoskins23.
To conclude, the seasonal cycles of North Atlantic tropical storms and South Amazon fires are in phase with
a maximum around September and have significant inter-annual correlation driven exclusively by Caribbean
tropical storms. Years of high fire activity are associated with atmospheric conditions over the Caribbean which
favour tropical cyclones, enhanced precipitation, local ascent and remote anomalous Amazon subsidence. We
hypothesise a direct physical link of tropical storms in the Caribbean to fires in the South Amazon through a
thermal direct circulation, Hadley-type response driven by off-equatorial heating partly caused by the storms.
Anomalous precipitation over the Caribbean regardless of cause releases latent heat there and contributes to the
thermal direct circulation. However, Caribbean tropical storms play an important role based on our analysis
as they account for much of the precipitation anomalies there. The anomalous Amazon subsidence we observe
promotes favourable fire conditions there. Anthropogenic drivers, such as deforestation, are a major contributor
mazon8,28. Some of the inter-annual variability is therefore due to the interaction of man-made
to fires in the A
burning with environmentally favourable conditions. By focusing on the fire season this study leads to a deeper
understanding of Amazon fire variability than previous studies which considered the pre-season. This study helps
build a more complete understanding of the drivers of Amazon fires and provides evidence of a case of remote
physically linked compound extreme events.
Methods
North Atlantic tropical cyclone data were obtained from NOAA’s IBTrACS Version 429,30 for 1980–2019.
Only cyclones with 1-min maximum sustained wind of 34 kt or above were considered. Precipitation data
(2001–2018) were taken from NASA-JAXA’s TRMM 3B42 D aily31 and TRMM 3B43 (monthly)32 datasets. Fire
data (2001–2018) were obtained from NASA’s MODIS Collection 6 33,34. Fire pixels recorded in the MCD14ML
product by the Terra satellite were filtered to keep only those classed as ‘presumed vegetation fire’ and with a
detection confidence of at least 30%. These pixels were then adjusted for cloud coverage recorded in the MOD-
14CMQ product according to Giglio et al.35 The fire count over a region is the total number of cloud cover-
adjusted pixels over that region. Zonal and meridional wind at 850 hPa and 200 hPa , vertical velocity at 600 hPa ,
SST, mean surface downward short-wave radiation flux and precipitation (1980–2019) data are the ECMWF’s
ERA5 monthly averaged d ata36,37. The Canadian Forest Service Fire Weather Index Rating System (FWI) pro-
duced by the CEMS for the E FFIS38 gives the best dependency index skill score in South Amazon among the
three indices studied by Di Giuseppe et al.39. The FWI depends on local noon relative humidity, temperature
and wind speed among others.
To further understand the relationship between the North Atlantic and the Amazon, we focus on the following
three regions: the South Amazon (69◦ W–49◦ W, 15◦ S–5◦ S), which captures the most fire-active region of the
Amazon (Fig. 1a); the August to October (ASO) Atlantic ITCZ (48◦ W–17◦ W , 2◦ N–13◦ N), which captures
the region of maximum precipitation over the North Atlantic in ASO; and the Caribbean (88◦ W–52◦ W, 10◦ N
–25◦ N), which covers the region with significant precipitation difference between the high and low Amazon fire
years. We analyse the fire count, FWI, subsidence, surface solar radiation flux and precipitation over the Amazon;
the tropical storm count and precipitation over the Caribbean; and the precipitation over the ASO Atlantic ITCZ.
North Atlantic SST is averaged over the region 90◦ W–15◦ W and 0◦–25◦ N. We also study the horizontal wind
at 850 hPa and 850–200 hPa vertical wind shear over the North Atlantic for patterns favourable to the genesis
Scientific Reports | (2021) 11:16960 | https://doi.org/10.1038/s41598-021-96420-6 6
Vol:.(1234567890)www.nature.com/scientificreports/
and development of tropical cyclones. Composite differences over the periods from 2001 to 2018 and from 1980
to 2019 are taken between the top and bottom 5 and 13 extreme years respectively, corresponding roughly to
the top and bottom terciles. The resulting anomalies are considered significant if their 95% confidence intervals
produced by bootstrapping do not bracket 0. The number of bootstrap resamples used for the maps and box
averages are 1000 and 10000 respectively. All correlation coefficients are Pearson correlation coefficients. Unless
otherwise specified, correlation analysis are performed on linearly detrended time series to eliminate long term
effects such as global warming. This is achieved by subtracting the linear least squares fitted linear signal from
the original time series. Non-detrended correlation results are reported only if the p-value indicates a change
in the level of significance across the 99% and 95% confidence. We have identified all those cases clearly which
move from significant to non-significant ( p > 0.05). In those 3 cases the trends may be considered less robust.
All figures are generated using Python 3.8.3 with the library Matplotlib 3.3.4, and additionally the package
cartopy 0.18.0 for maps.
Data availability
All data used in this study are publicly available. MODIS data are retrievable from the SFTP server https://www.
fuoco.geog.umd.edu34. IBTrACS data is available at https://www.ncdc.noaa.gov/ibtracs/index.php?name=ib-v4-
access. All other data can be obtained from the websites given in the relevant citations.
Code availability
All codes produced to perform the calculations for this study are available from the corresponding author upon
reasonable request.
Received: 20 May 2021; Accepted: 3 August 2021
References
1. Van Der Werf, G. R. et al. Global fire emissions and the contribution of deforestation, savanna, forest, agricultural, and peat fires
(1997–2009). Atmos. Chem. Phys. https://doi.org/10.5194/acp-10-11707-2010 (2010).
2. Cury, R. T. D. S. et al. Higher fire frequency impaired woody species regeneration in a south-eastern Amazonian forest. J. Trop.
Ecol. https://doi.org/10.1017/S0266467420000176 (2020).
3. Fernandes, K. et al. North Tropical Atlantic influence on western Amazon fire season variability. Geophys. Res. Lett. https://doi.
org/10.1029/2011GL047392 (2011).
4. Chen, Y. et al. Forecasting fire season severity in South America using sea surface temperature anomalies. Science. https://doi.org/
10.1126/science.1209472 (2011).
5. Chen, Y. et al. Long-term trends and interannual variability of forest, savanna and agricultural fires in South America. Carbon
Manag. https://doi.org/10.4155/cmt.13.61 (2013).
6. Berenguer, E. et al. Improving the spatial-temporal analysis of Amazonian fires. Global Chang. Biol. https://doi.org/10.1111/gcb.
15425 (2021).
7. Barlow, J., Berenguer, E., Carmenta, R. & França, F. Clarifying Amazonia’s burning crisis. Global Chang. Biol. https://doi.org/10.
1111/gcb.14872 (2020).
8. Aragão, L. E. et al. 21st Century drought-related fires counteract the decline of Amazon deforestation carbon emissions. Nat.
Commun. https://doi.org/10.1038/s41467-017-02771-y (2018).
9. Enfield, D. B. Relationships of inter-American rainfall to tropical Atlantic and Pacific SST variability. Geophys. Res. Lett. https://
doi.org/10.1029/96GL03231 (1996).
10. Moron, V., Bigot, S. & Roucou, P. Rainfall variability in subequatorial America and Africa and relationships with the main sea-
surface temperature modes (1951–1990). Int. J. Climatol. https://doi.org/10.1002/joc.3370151202 (1995).
11. Yoon, J. H. Multi-model analysis of the Atlantic influence on Southern Amazon rainfall. Atmos. Sci. Lett. https://doi.org/10.1002/
asl.600 (2016).
12. Yoon, J. H. & Zeng, N. An Atlantic influence on Amazon rainfall. Clim. Dyn. https://doi.org/10.1007/s00382-009-0551-6 (2010).
13. Zeng, N. et al. Causes and impacts of the 2005 Amazon drought. Environ. Res. Lett. https://d oi.o
rg/1 0.1 088/1 748-9 326/3/1 /0 14002
(2008).
14. Chen, Y., Randerson, J. T. & Morton, D. C. Tropical North Atlantic ocean-atmosphere interactions synchronize forest carbon losses
from hurricanes and Amazon fires. Geophys. Res. Lett. https://doi.org/10.1002/2015GL064505 (2015).
15. Trenberth, K. Uncertainty in hurricanes and global warming. Science. https://doi.org/10.1126/science.1112551 (2005).
16. Emanuel, K. Increasing destructiveness of tropical cyclones over the past 30 years. Nature. https://doi.org/10.1038/nature03906
(2005).
17. Webster, P. J., Holland, G. J., Curry, J. A. & Chang, H. R. Atmospheric science: Changes in tropical cyclone number, duration, and
intensity in a warming environment. Science. https://doi.org/10.1126/science.1116448 (2005).
18. Gray, W. M. Global view of the origin of tropical disturbances and storms. Mon. Weather Rev. https://doi.org/10.1175/1520-
0493(1968)0962.0.co;2 (1968).
19. Maloney, E. D. & Hartmann, D. L. Modulation of hurricane activity in the Gulf of Mexico by the Madden–Julian oscillation. Sci-
ence. https://doi.org/10.1126/science.287.5460.2002 (2000).
20. Inoue, M., Handoh, I. C. & Bigg, G. R. Bimodal distribution of tropical cyclogenesis in the Caribbean: Characteristics and envi-
ronmental factors. J. Clim. https://doi.org/10.1175/1520-0442(2002)0152.0.CO;2 (2002).
21. de Souza, I. P. et al. Seasonal precipitation variability modes over South America associated to El Niño-Southern Oscillation
(ENSO) and non-ENSO components during the 1951–2016 period. Int. J. Climatol. https://doi.org/10.1002/joc.7075 (2021).
22. Stuivenvolt Allen, J., Simon Wang, S., LaPlante, M. D. & Yoon, J. Three Western Pacific typhoons strengthened fire weather in the
recent northwest US conflagration. Geophys. Res. Lett. https://doi.org/10.1029/2020gl091430 (2021).
23. Rodwell, M. J. & Hoskins, B. J. Subtropical anticyclones and summer monsoons. J. Clim. https://doi.org/10.1175/1520-0442(2001)
0142.0.CO;2 (2001).
24. Krishnan, R. et al. The abnormal Indian summer monsoon of 2000. J. Clim. https://doi.org/10.1175/1520-0442(2003)162.0.CO;2 (2003).
25. Gill, A. Some simple solutions for heat-induced tropical circulation. Quart. J. Roy. Meteorol. Soc. https://doi.org/10.1256/smsqj.
44904 (1980).
26. Phlips, P. J. & Gill, A. E. An analytic model of the heat-induced tropical circulation in the presence of a mean wind. Quart. J. Roy.
Meteorol. Soc. https://doi.org/10.1002/qj.49711347513 (1987).
Scientific Reports | (2021) 11:16960 | https://doi.org/10.1038/s41598-021-96420-6 7
Vol.:(0123456789)www.nature.com/scientificreports/
27. Wang, Y., Feng, J., Li, J., An, R. & Wang, L. Variability of boreal spring Hadley circulation over the Asian monsoon domain and its
relationship with tropical SST. Clim. Dyn. https://doi.org/10.1007/s00382-019-05079-3 (2020).
28. Marengo, J. A. et al. Changes in climate and land use over the Amazon region: Current and future variability and trends. Front.
Earth Sci. https://doi.org/10.3389/feart.2018.00228 (2018).
29. Knapp, K. R., Kruk, M. C., Levinson, D. H., Diamond, J. H. & Neumann, J. C. The international best track archive for climate
stewardship (IBTrACS) unifying tropical cyclone data. Bull. Am. Meteorol. Soc. https://doi.org/10.1175/2009BAMS2755.1 (2010).
30. Knapp, K. R., Diamond, H. J., Kossin, J. P., Kruk, M. C. & Schreck, C. J. International best track archive for climate stewardship
(IBTrACS) project, version 4 North Atlantic. NOAA Natl. Cent. Environ. Inform. https://doi.org/10.25921/82ty-9e16 (2018).
31. Huffman, G., Bolvin, D., Nelkin, E. & Adler, R. TRMM (TMPA) precipitation L3 1 day 0.25 degree x 0.25 degree V7, edited by
Andrey Savtchenko. Goddard Earth Sci. Data Inform. Serv. Cent. (GES DISC). https://doi.org/10.5067/TRMM/TMPA/DAY/7
(2016).
32. Tropical Rainfall Measuring Mission (TRMM). TRMM (TMPA/3B43) rainfall estimate L3 1 month 0.25 degree x 0.25 degree V7.
Goddard Earth Sci. Data Inform. Serv. Cent. (GES DISC). https://doi.org/10.5067/TRMM/TMPA/MONTH/7 (2011).
33. Giglio, L., Schroeder, W. & Justice, C. O. The collection 6 MODIS active fire detection algorithm and fire products. Remote Sens.
Environ. https://doi.org/10.1016/j.rse.2016.02.054 (2016).
34. Giglio, L., Schroeder, W., Hall, J. V. & Justice, C. O. MODIS Collection 6 Active Fire Product User’s Guide Revision C. https://modis-
fire.umd.edu/files/MODIS_C6_Fire_User_Guide_C.pdf (2020).
35. Giglio, L., Csiszar, I. & Justice, C. O. Global distribution and seasonality of active fires as observed with the terra and aqua moderate
resolution imaging spectroradiometer (MODIS) sensors. J. Geophys. Res.: Biogeosci. https://d oi.o
rg/1 0.1 029/2 005JG
00014 2 (2006).
36. Hersbach, H. et al. ERA5 monthly averaged data on pressure levels from 1979 to present. Copernic. Clim. Chang. Serv. (C3S) Clim.
Data Store (CDS). https://doi.org/10.24381/cds.6860a573 (2019).
37. Hersbach, H. ERA5 monthly averaged data on single levels from 1979 to present. Copernic. Clim. Chang. Serv. (C3S) Clim. Data
Store (CDS). https://doi.org/10.24381/cds.f17050d7 (2019).
38. European Centre for Medium-Range Weather Forecasts (ECMWF). Fire danger indices historical data from the Copernicus
emergency management service. Copernic. Clim. Chang. Serv. (C3S) Clim. Data Store (CDS). https://doi.org/10.6084/m9.figshare.
853801 (2019).
39. Di Giuseppe, F. et al. The potential predictability of fire danger provided by numerical weather prediction. J. Appl. Meteorol. Cli-
matol. https://doi.org/10.1175/JAMC-D-15-0297.1 (2016).
Acknowledgements
This research was funded by the Leverhulme Centre for Wildfires, Environment and Society through the Lever-
hulme Trust, Grant Number RC-2018-023.
Author contributions
R.T. and E.Y.L.T. conceived the experiments, E.Y.L.T. conducted the experiments, E.Y.L.T. and R.T. analysed the
results. E.Y.L.T. drafted the initial manuscript and prepared the figures, all authors reviewed the manuscript.
Competing interests
The authors declare no competing interests.
Additional information
Correspondence and requests for materials should be addressed to E.Y.L.T.
Reprints and permissions information is available at www.nature.com/reprints.
Publisher’s note Springer Nature remains neutral with regard to jurisdictional claims in published maps and
institutional affiliations.
Open Access This article is licensed under a Creative Commons Attribution 4.0 International
License, which permits use, sharing, adaptation, distribution and reproduction in any medium or
format, as long as you give appropriate credit to the original author(s) and the source, provide a link to the
Creative Commons licence, and indicate if changes were made. The images or other third party material in this
article are included in the article’s Creative Commons licence, unless indicated otherwise in a credit line to the
material. If material is not included in the article’s Creative Commons licence and your intended use is not
permitted by statutory regulation or exceeds the permitted use, you will need to obtain permission directly from
the copyright holder. To view a copy of this licence, visit http://creativecommons.org/licenses/by/4.0/.
© The Author(s) 2021
Scientific Reports | (2021) 11:16960 | https://doi.org/10.1038/s41598-021-96420-6 8
Vol:.(1234567890)You can also read