Cloud Seeding - Frequently Asked Questions
←
→
Page content transcription
If your browser does not render page correctly, please read the page content below
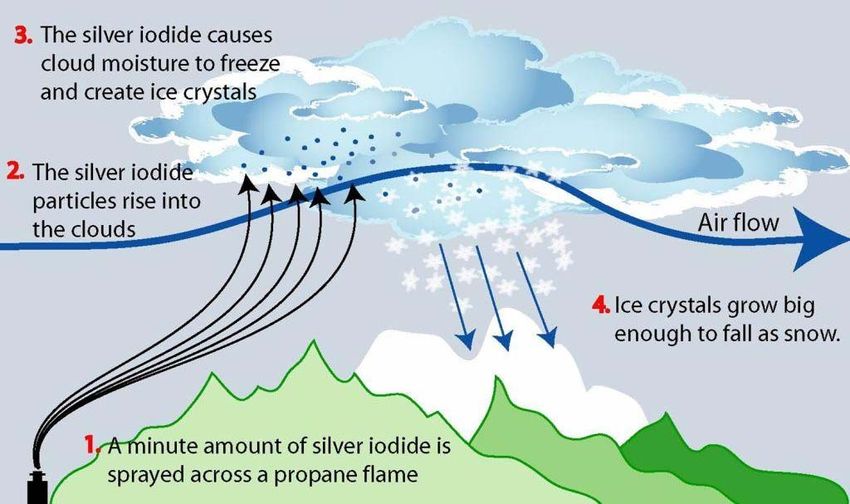
Cloud Seeding – Frequently Asked Questions

What is cloud seeding?
Cloud seeding is a weather modification technique which involves the introduction of
additional particles into suitable clouds to encourage the formation and growth of ice
crystals or raindrops and thus enhance the precipitation falling from the cloud.
Winter precipitation over the Snowy Mountains is largely associated with moist
westerly weather systems. As these systems approach the mountain ranges, the air
mass is lifted and condenses further to form orographically enhanced clouds
composed of tiny water droplets. Under certain conditions these droplets remain in
liquid form, even at temperatures below zero degrees Celsius. Water in this form is
known as super cooled liquid water (SLW).
To fall out of the clouds as snow, these SLW droplets need to form ice crystals. This
normally occurs through interaction with tiny airborne particles (like dust or other ice
crystals), or when cloud temperatures are very cold. If there are not enough of these
particles, or the temperatures are not cold enough, then not all the SLW droplets are
converted into ice crystals and the clouds are considered ‘naturally inefficient’.
Under normal conditions, these clouds evaporate as they descend on the lee side of
the mountains. This results in the well understood and naturally occurring
phenomenon known as a rain shadow. This is why areas downwind of mountain
ranges, such as the Monaro Plains, tend to be much drier than on the upwind side.
To improve the snow making efficiency of these clouds, additional particles can be
introduced into the clouds. The excess SLW droplets freeze onto these particles
forming ice crystals which grow and fall to the ground as snow. This process is
known as glaciogenic cloud seeding.
Is cloud seeding used elsewhere?
There are currently more than 150 cloud seeding programs in operation all over the
world.
In Australia, Hydro Tasmania has been involved in cloud seeding operations and
research since 1964. The Queensland government has also recently completed a
cloud seeding experiment to research drought relief.
In addition to precipitation enhancement, cloud seeding techniques are also used for
hailstone suppression in thunderstorms and fog dispersal around airports and other
critical infrastructure.

Why cloud seed in the Snowy Mountains?
Snowy Hydro relies on precipitation falling in the catchments of the Snowy Mountains
to supply water for production of hydro-electricity and release for use by downstream
stakeholders. Cloud seeding over this area is used to enhance snow falls above
natural levels, which in turn leads to increased run off and, therefore, amount of
water in the storages available to produce clean, green, renewable energy.

What are the benefits of cloud seeding?
Increase in snowfall would have many potential benefits, including:
•   Increased production of renewable hydro-electricity and an offset in carbon
    emissions by non-renewable generation sources;
•   Benefits to snow dependent flora and fauna species;
•   All of the NSW ski resorts are located within the current project area, and tourism
    is the major industry in the mountains. Additional snowfalls would clearly benefit
    these stakeholders;
•   The benefits also continue once the water is released into the Murray and
    Murrumbidgee Rivers for irrigation. The irrigated agriculture industry not only
    provides food and vegetables, but thousands of jobs and supports towns and
    industries throughout regional New South Wales, Victoria and South Australia.

Has cloud seeding been done in the Snowy Mountains before?
The potential for cloud seeding over the Snowy Mountains region was recognised
more than fifty years ago. A trial undertaken over the years 1955 to 1959 by the
CSIRO and the Snowy Mountains Hydro-electric Authority reported a 19% increase
in precipitation for seeded events. These results were challenged however because
of issues relating to scientific conduct and the evaluation and interpretation of the
results.
Some limited studies on cloud seeding potential occurred during the 1970’s and
1980’s, however no cloud seeding was undertaken.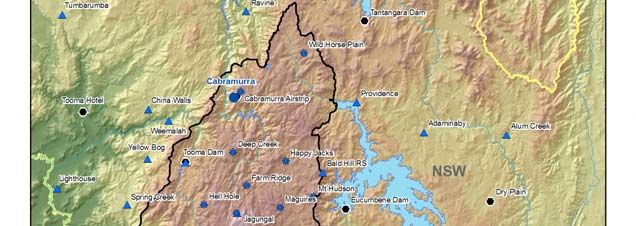
In 2003, an independent Expert Panel was commissioned to investigate any
environmental issues associated with cloud seeding. The Panel subsequently
reported to the NSW government that cloud seeding "...would be unlikely to have a
significant adverse impact on the environment". In 2004 the Snowy Precipitation
Enhancement Research Project (SPERP) commenced.

What is the Snowy Precipitation Enhancement Research Project (SPERP)?
The SPERP was designed specifically to answer the question "can cloud seeding be
used to increase snowfalls in a cost effective way, and without any significant
adverse environmental impacts". Considerable effort went in to ensure the
deficiencies associated with the 1950's trial were comprehensively addressed so that
the evaluation of the SPERP could be relied on, and accepted with confidence.
These measures included a formal experimental design and evaluation plan, setting
out the methods for analysis and criteria for success - published and publicly
available in advance of the evaluation of the trial. At the operational level,
procedures were developed to ensure that every cloud seeding experiment - without
exception - was undertaken in accordance with the design.
Most importantly, the evaluation of the trial outcomes was to be undertaken
independently of Snowy Hydro Limited.

What is the Snowy Mountains Cloud Seeding Trial Act 2004 (NSW)?
The SPERP commenced in 2004, following passage of the Snowy Mountains Cloud
Seeding Trial Act 2004 (NSW) (the "Act"). This legislation authorised Snowy Hydro
Limited to undertake a cloud seeding trial over a target area of approximately
1000 km², with atrial duration of six years. It also mandated that cloud seeding
experiments could only be "...carried out at a time when increased precipitation in the
target area is likely to fall as snow" rather than rain.
In 2008, the Act was amended, expanding the area authorised for cloud seeding
operations to 2150 km². The duration of the trial was also extended to April 2015.
The Act prescribes a number of mandatory requirements. These include:
   •   Silver iodide must be used as the seeding agent;
   •   Operations may only be ground based (no aircraft may be used for seeding);
   •   Operations may only take place when precipitation is likely to fall as snow and
       not rain;
   •   Environmental effects must be monitored.
Silver iodide is used as the glaciogenic (ice nucleating) seeding material because it
has physical properties very similar to natural ice crystals. Indium (III) oxide is used
as the inert tracer agent. The tracer particles are similar in size to the seeder
particles; however they have no ice nucleating properties.
The project uses ground based generators arranged along the western side of the
mountain range to disperse very small quantities of the seeder and tracer agents into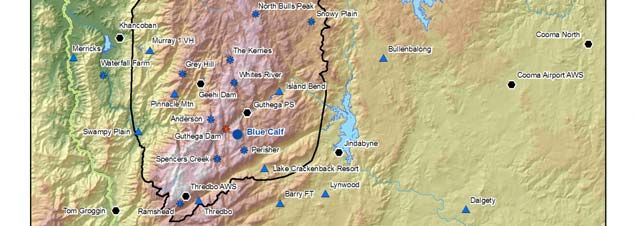
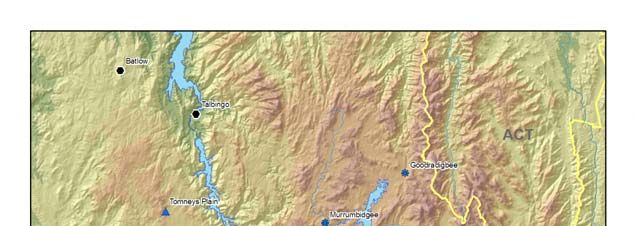
winter storm clouds suitable for seeding as they pass over the mountain range.
These particles are invisible to the human eye, so small that more than 300 million
particles would fit on the head of a pin.

What is the duration of the SPERP?
The first stage of the SPERP took place from 2004 to June 2009. Extensive lobbying
by stakeholders following the 2006 drought resulted in amendments to the Act,
extending the duration of the trial to April 2015.

Which region is being targeted?
The SPERP currently targets an area of 2150 km². The map below shows the area
covered, along with supporting meteorological infrastructure needed to monitor and
record data.
What cloud seeding agents are being used?
Silver iodide is used as the glaciogenic (ice nucleating) seeding material because it
has physical properties very similar to natural ice crystals. The particles are invisible
to the naked eye (approximately 0.06 microns in diameter), and are so small that
over 300 million of them would fit onto the head of a pin.
Indium (III) oxide is used as the inert tracer agent. The tracer particles are similar in
size to the seeder particles; however they have no ice nucleating properties.
Both silver iodide and indium (III) oxide are insoluble in water.
The table below shows the total amount of cloud seeding agents used each season
since the commencement of the SPERP. Note that these quantities were distributed
over a target area of 1000 km² between 2004 and 2008, and over 2150 km² in 2009.

                                         Silver      Indium (III)
                            Year         Iodide        Oxide
                                           (kg)         (kg)

                            2004          20.1          11.3

                            2005          23.2          20.0

                            2006           6.1           6.8

                            2007          15.6          13.2

                            2008          20.1          17.8

                            2009          33.3          27.5

How are additional particles introduced into clouds?
The SPERP does not use aeroplanes, artillery shells or rockets, but 23 pairs of
ground based generators located on the western side of the mountains.
Two generators are located at each site: one to disperse the sliver iodide (seeding
agent) and one to disperse the indium (III) oxide (tracing agent).
The agents are each mixed with solvents and sprayed as an aerosol into a LPG
burner. This process produces millions of tiny particles which rise above the
generators from the heat generated by the flame, and are carried by the wind into
suitable clouds over the mountains.
Each generator when operating burns 1.25 litres of solution per hour, producing
around 20 grams of silver iodide, and 11 grams of indium (III) oxide particles.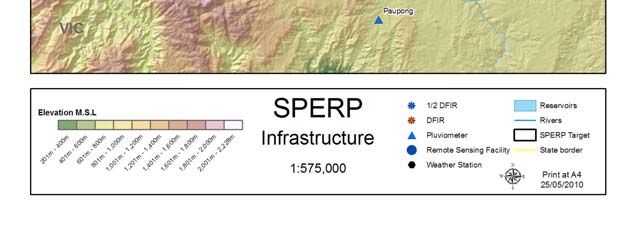
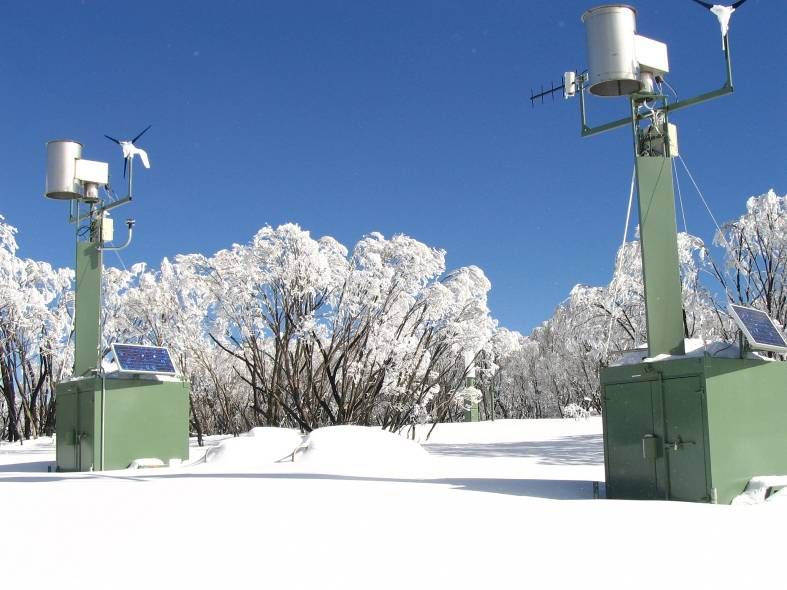
Cloud seeding generators in the field

Most generators are located on previously disturbed sites, generally in very remote
locations where grid power is unavailable. The sophisticated electronics, controls and
protection measures are powered by deep cycle batteries, and the burner is fuelled
by LPG. A wind turbine and a solar panel are used to recharge the batteries.
Generators and gas cylinders do not remain in the field all year. Sites are deployed in
March, and recovered from the field in October each year. Generators are equipped
with many alarms and protection measures to minimise any risk of environmental
harm.
Once deployed and tested, the generators are operated remotely.

Can Snowy Hydro seed for rain?
No. The Snowy Mountains Cloud Seeding Trial Act 2004 (NSW) mandates that cloud
seeding experiments can only be "...carried out at a time when increased
precipitation in the target area is likely to fall as snow" rather than rain.

Which weather systems are seeded, and when?
Only the cold winter storms coming from the west are seeded. No cloud seeding is
ever undertaken with systems coming from the east, north or south, and there are no
cloud seeding generators in place to be able to seed these systems.
The rapid rise in elevation on the western side of the mountains is conducive to
orographically enhanced clouds, i.e. the type of clouds that are ideal for seeding.
Therefore, only systems with a westerly component are seeded and operations never
take place when the wind is coming from the east. All generators are located to the
west of the target area.
Throughout the winter season SPERP personnel continually monitor meteorological
conditions and forecast for potential cloud seeding opportunities. Data from all the
critical instrument systems are transmitted to the Cloud Seeding Control Centre
(CSCC) in real time.
When a cold westerly storm is forecast to approach, six hours prior to an expected
event 3 hourly atmospheric soundings commence using weather balloons, and data
from instruments located in the target area are monitored. The soundings are used to
determine the freezing level, wind direction, and cloud depth and temperature.
Before commencing cloud seeding operations, the following criteria must be satisfied:
   •   Freezing Level of 1600m ASL or lower
   •   Cloud top temperature is -7°C or colder
   •   Cloud depth greater than or equal to 400m above the -5°C level
   •   Excess SLW must be available
   •   Target model output indicates that snow will fall in the target area
   •   At least 15 generators are targeting and available for operation
   •   Precipitation in the target or control area has occurred within the last 30
       minutes
   •   The forecaster expects the event to last for at least 5 hours
Only once all the above criteria are met, can cloud seeding operations commence.

What environmental protection measures have been implemented?
In 2003, an independent Expert Panel was commissioned to investigate any
environmental issues associated with cloud seeding. The Panel subsequently
reported to the NSW government that cloud seeding "...would be unlikely to have a
significant adverse impact on the environment".
In addition to the Expert Panel opinion, an Environmental Management Plan (EMP)
for the SPERP was developed by Snowy Hydro in collaboration with experts from the
Department of Environment, Climate Change and Water (DECCW). The EMP has
been designed to detect any adverse environmental trend well before any level of
concern is reached. The scope of the EMP covers:
   •   Establishment, operation and maintenance of infrastructure;
   •   Use of cloud seeding and tracer agents; and
   •   Changes to precipitation and precipitation patterns.

Infrastructure
Almost all SPERP infrastructure has been located in previously disturbed areas, and
designed to operate remotely and with comprehensive fail safe features to minimise
any risk of harm to the environment.
Some meteorological monitoring equipment is located in remote locations, however it has been designed to minimise any disturbance to earth and visual impact, with visitation usually undertaken by helicopter to avoid the impacts of vehicle traffic Infrastructure sites are inspected and audited each year by Snowy Hydro. DECCW and the Natural Resources Commission also undertake regular inspections of cloud seeding sites. Use of cloud seeding agents Prior to the commencement of the trial, background levels of silver and indium in various matrices were taken. More than 2000 samples are collected from over 200 monitoring locations after each season to verify that there are no significant changes. All of these results are reported to the NSW government. Additional precipitation Aquatic and Terrestrial Ecology monitoring is also undertaken. Stream health is being assessed by examining macro-invertebrate populations using methods recommended by the DECCW. Snowy Hydro is also collaborating with the DECCW on monitoring potential effects of cloud seeding on terrestrial ecology. Changes in snow density outside the range of natural variation, and the timing of snowfall and snow melt are of critical importance to snow dwelling species. Snowy Hydro is monitoring and reporting on these potential first order effects, and DECCW scientists are undertaking animal studies. What are the environmental outcomes to date? Infrastructure Audits and inspections of infrastructure conducted annually by DECCW, NRC and Snowy Hydro over the course of the trial have shown no areas of concern. Use of cloud seeding agents Background samples collected prior to the commencement of the trial, showed silver and indium are naturally present in the environment in measureable concentrations. More than 2000 soil, moss, peat, sediment and potable water samples are collected each year and have shown mean concentrations to be far below relevant environmental guidelines, with little or no change from background levels. For example, concentrations of silver in drinking water for all samples collected remain at background concentrations, almost 100,000 times lower than the Australian guidelines given by the National Health and Medical Research Council.
Additional precipitation
Monitoring has been undertaken to address concerns raised over potential impacts
on terrestrial and aquatic ecology. No significant impact associated with cloud
seeding has been found.
Data were also collected from a network of rain gauges downwind of the target area.
No evidence was found to suggest that cloud seeding had a positive or negative
effect on precipitation in this area.

Is the water safe to drink?
Yes.
All samples collected from potable water supplies in the target area are at
background levels (around 1 part per trillion), with concentrations of silver from all
samples collected almost 100,000 times lower than the National Health and Medical
Research Centre Australian Drinking Water Guidelines.
A commercial distilled water supplied from a local supermarket was found to have a
concentration of around 40 parts per trillion of silver.

What were the results from the evaluation of the first stage of the SPERP?
The SPERP was undertaken in accordance with a formal experimental design and
evaluation plan with criteria for success clearly defined and published in advance.
This was done to ensure the results would be credible and the process transparent.
The expert scientific evaluation of the project was also undertaken independently of
Snowy Hydro, and there were two separate independent reviews of the evaluation
outcomes.
The experimental design for the cloud seeding project was similar to a medical trial,
where some patients randomly receive the active treatment and others a placebo. In
this case, some cloud seeding experiments were seeded, and others not.
The randomisation sequence was prepared independently by Charles Sturt
University, and to ensure there was no risk of inadvertent bias. Importantly, the
science team and cloud seeding operators were not permitted to know what the
decision was until the whole trial had been independently evaluated.
In summary, there were 107 cloud seeding experiments conducted over the period
2005 through to June 2009. Experiments were normally of five hours duration. Of
these, 23 experiments were found not to cover the target area effectively, either
because of a change in wind direction after the experiment commenced or a freezing
level above 1600 meters above sea level came into effect resulting in the experiment
being terminated before completion.
An initial analysis considered all 107 experiments - including all those where the
target area was known not to have been covered effectively. This assessment found:
•   The targeting of seeding material to be "unequivocally positive", with "...a
       probability of 2,000,000 to 1 that the observed differences occur by chance";
       and
   •   "...that seeding yielded an increase of 7% in precipitation across the primary
       target area at a statistical significance of 24%. That is to say, there was a
       24% probability that this outcome could have been due to chance".
When this analysis was then repeated using those experiments where the overall
target was effectively covered, i.e. 84 of the 107 experiments, the outcomes were as
follows:
   •   "...when the analysis is applied to the overall target area the precipitation
       increase is 14% at the 3% significance level".
In other words, there was only a 3% probability that the outcome could have resulted
from chance alone - this is well within the criteria set in advance which prescribed a
10% or lower statistical significance for success.
The evaluation also found that:
   •   "...seeding impacted on virtually all the physical variables examined in a
       manner consistent with the seeding hypothesis",
Potential seeding effects outside of the target area were also investigated:
   •   "Careful analysis of the distribution of silver [seeding agent] and indium
       [tracer agent] in seeded and unseeded EUs finds that the seeding material is
       consistently confined to the target area. Moreover, analysis of the spatial
       patterns of precipitation in seeded and unseeded EUs [experimental units]
       shows no sign of any impact of seeding downwind of the target area."
Furthermore, two independent reviews of the evaluation noted a:
   •   "...careful, rigorous and wide ranging evaluation of an experiment that was
       well designed" and "particularly well executed", and most importantly that
       "...the evaluation can be accepted with confidence."
A comprehensive environmental monitoring program developed in collaboration with
DECCW investigated potential impacts on terrestrial and aquatic environments. This
covered aspects of the operation including the installation, operation and
maintenance of infrastructure, use of cloud seeding agents, and changes to
precipitation.
The assessments found no evidence of any significant adverse environmental impact
associated with the cloud seeding trial.
Does cloud seeding in one area affect precipitation downwind?
This question is based on the idea that increasing precipitation in one area can only
be achieved at the expense of a decrease in another area.
Cloud seeding only targets inefficient systems where the moisture would normally
evaporate on the leeward side of the mountains. To confirm this, the evaluation plan
included an analysis and case studies of downwind sites, including:
Adaminaby, Barry Fire Trail, Bega AWS, Berridale AWS, Braidwood
Racecourse AWS, Bombala AWS, Bullenbong, Cooma Airport AWS, Cooma
North, Dalgety, Eucumbene Dam, Jindabyne, Merimbula AWS, Moruya AWS,
Moonbah, Paupong, Providence and Tuggeranong (Isabella Plains) AWS.
The evaluation found no evidence of any impacts - positive or negative - downwind of
the target area:
“Careful analysis of the distribution of silver and indium in seeded and unseeded EUs
finds that the seeding material is consistently confined to the target area. Moreover,
analysis of the spatial patterns of precipitation in seeded and unseeded EUs shows
no sign of any impact of seeding downwind of the target area.”
The case studies undertaken to assess the meteorological conditions generally
occurring over the downwind area during the winter period are shown below (all the
maps and data used were sourced from the Bureau of Meteorology, BoM),
Historical Precipitation Patterns over the Monaro Region
The Australian rainfall deciles below show the total annual precipitation levels against
the long term average. The 2009 Annual Climate Summary report produced by the
BoM states that for NSW, 2009 was the “9th consecutive year with below average
rainfall”. The rainfall deciles confirm this to be the case for the Snowy Mountains
region (including the Monaro region) for four of the past six years. The 2006 year
was reported as being particularly dry, with 2009 being the next driest year.Australian annual rainfall deciles from 2004 to 2009
It is worth reiterating two key points:
• There is large temporal and spatial variability in precipitation over a year; and
• Cloud seeding operations only take place during winter (notionally between
the period 1 May to 30 September each year),
For these reasons, these case studies examine downwind precipitation patterns:
• Only for the period of potential impact, i.e., only over the months in which
cloud seeding operations may occur (May to September);
• From the commencement of the SPERP (2004 through 2009); and
• Compares these patterns to the long term averages.
Winter Precipitation over the Monaro Region during SPERP
Australian monthly rainfall deciles for the winter period from May to September show
a high level of variability in precipitation amounts:• Temporally: strong shifts can be seen from below average precipitation to
above average precipitation, both from month-to-month and year-to-year; and
• Spatially: there is also large variability across the whole of Australia.
It is important to note that when very wet or very dry periods have occurred over the
Monaro region, the same conditions are often observed over extensive areas of
Australia, indicating that they are widespread events.
The winter rainfall totals for two major regional town centres in the Monaro region,
Bombala and Cooma, were assessed. Due to higher quality output, the BoM
Automatic Weather Stations (AWS) in these regions (Bombala AWS and Cooma
Airport AWS) were selected for this study. However, as the AWS sites have only
been operating for a relatively short period of time, the resulting averages calculated
for these sites may not accurately represent the long term averages (as at least 30
years of data are required to give a more accurate representation). To overcome
this, data were also sourced from the two longest manually recording rainfall stations
in both areas, being the Bombala (Therry St) and Cooma (Kiaora) sites.
The graphs below show the winter (May to September) precipitation totals at the four
sites, plotted against the winter average for that site. Please note that the 2009
winter precipitation totals for Cooma Airport AWS do not include any data from June
to August 2009, as these are not currently available from the BoM website.
The graphs show that precipitation levels at Bombala and Cooma (with the exception
of the Cooma (Kiaora) site) have been close to or above average during the winter
period (May to September) for three out of the six years of the SPERP.
These graphs are in general agreement with the annual rainfall deciles, apart from
2006. During this year, most sites measured close to or above average rainfall from
May to September, however the annual rainfall deciles showed very much below
average for the year. This indicates that the drier periods for the year occurred
outside the winter period.Source of data: Bureau of Meteorology
Bombala AWS
350
300
250
Precipitation (mm)
200
150
100
50
0
1995 1996 1997 1998 1999 2000 2001 2002 2003 2004 2005 2006 2007 2008 2009
Year
Winter precipitation total (May - Sept) 1995-2009 winter average
Winter (May to September) precipitation totals measured at the BoM Bombala Automatic Weather Station
since the start of records at the site
Source of data: Bureau of Meteorology
Cooma Airport AWS
350
300
250
Precpitation (mm)
200
150
100
50
0
1983
1984
1985
1986
1987
1988
1989
1995
1996
1997
1998
1999
2000
2001
2002
2003
2004
2005
2006
2007
2008
2009
Year 2009 has 3 months missing
Winter precipitation total (May - Sept) 1983-2009 winter average
Winter (May to September) precipitation totals measured at the BoM Cooma Automatic Weather Station since
the start of records at the siteSource of data: Bureau of Meteorology
Bombala (Therry St)
700
600
500
Precipitation (mm)
400
300
200
100
0
1885
1887
1889
1891
1893
1895
1897
1899
1901
1903
1905
1907
1909
1911
1913
1915
1917
1919
1921
1923
1925
1927
1929
1931
1933
1935
1937
1939
1941
1943
1945
1947
1949
1951
1953
1955
1957
1959
1961
1963
1965
1967
1969
1971
1973
1975
1977
1979
1981
1983
1985
1987
1989
1991
1993
1995
1997
1999
2001
2003
2005
2007
2009
Year
1999 and 2001 each have 1 month missing
Winter precipitation total (May - Sept) 1885-2009 winter average
Winter (May to September) precipitation totals measured at BoM Bombala (Therry St) since the start of
records at the site
Source of data: Bureau of Meteorology
Cooma (Kiaora)
450
400
350
300
Precipitation (mm)
250
200
150
100
50
0
1904
1907
1910
1913
1916
1919
1922
1925
1928
1931
1934
1937
1940
1943
1946
1949
1952
1955
1958
1961
1964
1967
1970
1973
1976
1979
1982
1985
1988
1991
1994
1997
2000
2003
2006
2009
Year 1904 & 1999 each have 1 month missing
Winter precipitation total (May - Sept) 1904-2009 winter average
Winter (May to September) precipitation totals measured at BoM Cooma (Kiaora) since the start of records at
the siteCase Studies of some Typical Weather Events over the Monaro Region
The Monaro lies in a natural rain shadow as a result of the Snowy Mountains range
to the west of the region.
Since the region experiences prevailing westerly winds during winter, the rain
shadow effect has significant implications for the amount of precipitation that falls
over the region during that period. In this report we present two new case studies.
Case Study 1 shows the effect of the rain shadow as a result of the Snowy
Mountains range, during the passage of a westerly frontal system. This event shows
the large differences in precipitation totals on the windward side of the mountains,
over the mountain ranges and on the leeward side (Monaro/South coast region). It is
important to note that no cloud seeding experiments occurred during this event.
Case Study 2 shows the development of an east coast low, resulting in high
precipitation levels over the Monaro/South coast region. This is somewhat typical for
the Monaro under moist easterly wind regimes. It should be noted that the rain
shadow effect for this event is over the Southwest Slopes region. N.B. This event
occurred outside of the cloud seeding season (i.e., no cloud seeding experiments are
undertaken at this time of year).
Data from the following sites were used for this analysis1:
• Southwest Slopes region– Albury, Wagga Wagga and Khancoban;
• Snowy Mountains – Thredbo and Cabramurra; and
• Monaro/South coast region – Cooma, Bombala and Bega.
Case Study 1: A westerly frontal system
A westerly front moved through South East Australia from 21 to 22 August 2009,
seen in the synoptic charts and satellite images below. This resulted in generally
westerly component winds over the Snowy Mountains region. During this two day
event, precipitation levels measured in each region were:
• Southwest Slopes – 10 to 23 mm;
• Snowy Mountains – 38 to 40 mm; and
• Monaro/South coast – 0 to 3 mm.
1
Please note that with regards to the precipitation levels outlined in the case studies, other sites in the
region may have recorded higher levelsMSLP charts and associated satellite imagery for 21‐22 August 20092 2 MTSAT-1R : Satellite image originally processed by the Bureau of Meteorology from the geostationary satellite MTSAT-1R operated by the Japan Meteorological Agency
21 - 22 August 2009

                             40

                             35

                             30
  Precipitation (mm)

                             25

                             20

                             15

                             10

                              5

                            0
                       21/08/2009 00:00             21/08/2009 12:00       22/08/2009 00:00             22/08/2009 12:00       23/08/2009 00:00
                                                                           Date/Time (UTC)

                           Albury     Wagga Wagga         Khancoban    Cabramurra SMHEA       Thredbo        Cooma Airport   Bombala       Bega

Cumulative Precipitation for 21–22 August 2009 from BoM sites in the Southwest Slopes, Snowy Mountains
and Monaro regions

Case Study 2: An east coast low pressure system
A trough from the north was situated over NSW on 14 February 2010, developing
into an east coast low off Southeast Australia on 15 February 2010, seen in the
synoptic charts and satellite images below. This resulted in generally south-easterly
to easterly winds over the Snowy Mountains region over these two days. During this
event, precipitation levels reached in each region were:
                       •       Southwest Slopes – 0 to 29 mm;
                       •       Snowy Mountains – 11 to 53 mm; and
                       •       Monaro/South Coast – 51 to 185 mm.
MSLP charts and associated satellite imagery for 14‐15 February 2010
14 - 15 February 2010

                            140

                            120

                            100
  Precipitation (mm)

                             80

                             60

                             40

                             20

                            0
                       14/02/2010 0:00             14/02/2010 12:00         15/02/2010 0:00             15/02/2010 12:00        16/02/2010 0:00
                                                                           Date/Time (UTC)

                           Albury    Wagga Wagga         Khancoban     Cabramurra SMHEA       Thredbo        Cooma Airport   Bombala        Bega

Cumulative Precipitation for 14‐15 February 2010 from BoM sites in the Southwest Slopes and Monaro regions
and SHL sites in the Snowy Mountains

Case Studies: Interpretation
The analysis of these case studies supports the following conclusions:
                       •       The Monaro region lies in a natural rain shadow area;
                       •       Different types of weather systems have been shown to have varying spatial
                               effects in precipitation amounts throughout the Snowy Mountains Region; and
                       •       The weather systems that are conducive to high precipitation levels over the
                               Monaro region in almost all instances would not satisfy the suitability criteria
                               for cloud seeding operations.
Monthly Precipitation Totals over the Monaro Region during the SPERP
The monthly rainfall totals over the winter period (May to September) from the
commencement of the SPERP were plotted for Bombala AWS. Cooma Airport AWS
precipitation totals were not re-analysed due to the missing 2009 data, as reported
above.
Large variability in precipitation totals are observed from month-to month.
Source of data: Bureau of Meteorology
Bombala AWS
Monthly Rainfall
250
200
Precipitation (mm)
150
100
50
0
May June July August September
Month
Site Average 2004 2005 2006 2007 2008 2009
Total Monthly Precipitation for Bombala AWS from May to September 2004 to 2009 compared to site monthly
average
For 2009, the lowest monthly precipitation occurred in July, with precipitation totals
reaching only 10 mm at Bombala AWS. In comparison, in July 2005, precipitation
totals reached 133 mm at Bombala AWS.
An assessment was undertaken to compare the weather conditions between the wet
July period in 2005 and the dry July period in 2009.
Accumulation totals for July each year were plotted for Bombala AWS. This shows
that there were two main events which resulted in substantial precipitation in July
2005. The same was not evident in July 2009.Source of data: Bureau of Meteorology
Bombala AWS rainfall accumulation
July 2005 and July 2009
160
140
120
Precipitation (mm)
100
80
60
40
20
0
1 2 3 4 5 6 7 8 9 10 11 12 13 14 15 16 17 18 19 20 21 22 23 24 25 26 27 28 29 30 31
Day
July 2005 July 2009
Bombala AWS Rainfall Accumulations for July 2005 and July 2009
The daily MSLP charts from this period show that the first event at the start of the
month occurred as a result of a high pressure system centred over the Tasman Sea
directing moist easterly winds over the Monaro on 30 June 2005. This, coupled with
an unstable atmosphere from a trough from the north, resulted in moderate
precipitation levels falling overnight, prior to winds turning westerly on 1 July 2005.
The second, and most significant, event in 2005 was associated with a low pressure
system that developed over the east coast, directing moist, unstable air from the
south and east over the Monaro region, resulting in substantial precipitation.
Conversely, the MSLP synoptic charts for July 2009 show that the period was
dominated by high pressure systems over the region (which resulted in dry, stable
conditions), with some westerly frontal events (which, resulted in a natural rain
shadow effect over the Monaro region).
Comparison of the wet July 2005 month and dry July 2009 month show that
significant rainfall can occur over the Monaro region under moist, unstable easterly
and southerly systems, while high pressure systems over the region and westerly
fronts are not conducive to high rainfall events.
Conclusion
A preliminary assessment was undertaken of precipitation and weather systems over
the Monaro region during the winter months (May to September), in particular since
the commencement of the SPERP. This assessment shows:
• The Monaro region lies in a natural rain shadow, which as a result of
prevailing westerly winds during winter, has significant implications with
regards to the amount of precipitation that falls over the region;
• Different types of weather systems can have varying spatial effects in
precipitation amounts throughout the Snowy Mountains Region;• High precipitation over the Monaro region can be associated with low
pressure systems and troughs that develop over the east coast, with direct
moist southerly or easterly winds and an unstable air mass over the region.
These are not conditions suitable for SPERP cloud seeding operations; and
• Precipitation levels at Bombala and Cooma (with the exception of the Cooma
(Kiaora) site) have been close to or above average during the winter period
(May to September) for three out of the six years of the SPERP.
The questions asked at the beginning of the trial have been answered. Why is
Snowy Hydro continuing a research program?
The current Act authorises Snowy Hydro to continue a cloud seeding trial until April
2015, and a change to these arrangements would be required to allow an ongoing
operation to proceed.
Pending a decision by NSW on the future of cloud seeding Snowy Hydro will, for the
time being, continue research over the expanded 2150 km2 target area.
What is the difference between this trial and an ongoing cloud seeding
operation?
The experimental design for the cloud seeding project was similar to a medical trial,
where some patients receive the active treatment and others a placebo. In this case,
some cloud seeding experiments were seeded, and others not.
As long as the trial continues not all experiments will be seeded, resulting in missed
opportunities.
Environmental monitoring (currently a major part of the trial) would continue if the trial
became an ongoing cloud seeding operation.
How much does the SPERP cost and who is paying for it?
The costs for the first six years of the project were more than $20 million. Just over
$16 million was provided by Snowy Hydro.
Early promising results were sufficient for the Federal Government to also provide
$4 million in research funding support.
Is there an independent verification of reports made to government?
All data reported by Snowy Hydro to the government are audited by NATA
Certification Services.
The Natural Resources Commission is responsible under the Act for supervising the
cloud seeding trial and reporting on these operations.You can also read