Dosimetric and radiobiological comparison of treatment plan between CyberKnife and EDGE in stereotactic body radiotherapy for pancreatic cancer ...
←
→
Page content transcription
If your browser does not render page correctly, please read the page content below
www.nature.com/scientificreports
OPEN Dosimetric and radiobiological
comparison of treatment plan
between CyberKnife and EDGE
in stereotactic body radiotherapy
for pancreatic cancer
Zhi‑tao Dai1, Li Ma1, Ting‑ting Cao2, Lian Zhu3, Man Zhao1 & Ning Li1*
To perform a comparison of the different stereotactic body radiotherapy (SBRT) plans between the
Varian EDGE and CyberKnife (CK) systems for locally advanced unresectable pancreatic cancer. Fifteen
patients with pancreatic cancer were selected in this study. The median planning target volume (PTV)
was 28.688 cm3 (5.736–49.246 cm3). The SBRT plans for the EDGE and CK were generated in the
Eclipse and Multiplan systems respectively with the same contouring and dose constrains for PTV
and organs at risk (OARs). Dose distributions in PTV were evaluated in terms of coverage, conformity
index (CI), new conformity index (nCI), homogeneity index (HI), and gradient index (GI). OARs,
including spinal cord, bowel, stomach, duodenum and kidneys were statistically evaluated by different
dose-volume metrics and equivalent uniform dose (EUD). The volume covered by the different isodose
lines (ISDL) ranging from 10 to 100% for normal tissue were also analyzed. All SBRT plans for EDGE
and CK met the dose constraints for PTV and OARs. For the PTV, the dosimetric metrics in EDGE plans
were lower than that in CK, except that D99 and GI were slightly higher. The EDGE plans with lower CI,
nCI and HI were superior to generate more conformal and homogeneous dose distribution for PTV. For
the normal tissue, the CK plans were better at OARs sparing. The radiobiological indices EUD of spinal
cord, duodenum, stomach, and kidneys were lower for CK plans, except that liver were higher. The
volumes of normal tissue covered by medium ISDLs (with range of 20–70%) were lower for CK plans
while that covered by high and low ISDLs were lower for EDGE plans. This study indicated that both
EDGE and CK generated equivalent plan quality, and both systems can be considered as beneficial
techniques for SBRT of pancreatic cancer. EDGE plans offered more conformal and homogeneous dose
distribution for PTV, while the CK plans could minimize the exposure of OARs.
Pancreatic cancer is the fourth leading cause of cancer-related mortality worldwide with a 5-year survival rate
approximately 20%1,2. For localized disease, surgery with complete resection represents the only potential treat-
ment option associated with any substantive chance of cure3,4. However, due to non-specific early symptoms and
aggressive behavior of pancreatic cancer, most patients were diagnosed at relatively late s tages5. Most studies
have demonstrated that chemotherapy combined with radiation therapy is more effective than single-modality
therapy, despite continuous controversies about the role of radiation therapy exist due to conflicting clinical
outcomes6–9. Surrounded by many important and radiosensitive gastrointestinal organs,
such as duodenum and stomach, the conventional radiotherapy for pancreatic cancer seems not to effectively
spare these organs while delivering high dose to target7.
Compared with three dimensional conformal radiotherapy (3DCRT), intensity modulated radiotherapy
(IMRT) can reduce the dose of normal organs surrounding tumor, and also minimize the toxicity of gastro-
intestinal organs10. Goto and C
olbert11,12 had performed IMRT and 3DCRT for local pancreatic cancer, and
compared dosimetry and clinical outcomes. They verified.
1
National Cancer Center/National Clinical Research Center for Cancer/Cancer Hospital and Shenzhen Hospital,
Chinese Academy of Medical Sciences and Peking Union Medical College, Beijing, China. 2Tongji Hospital,
Tongji Medical College, Huazhong University of Science and Technology, Wuhan 430030, China. 3Department of
Radiation Oncology, Shanghai East Hospital, Tongji University, Shanghai 200120, China. *email: lee_ak@163.com
Scientific Reports | (2021) 11:4065 | https://doi.org/10.1038/s41598-021-83648-5 1
Vol.:(0123456789)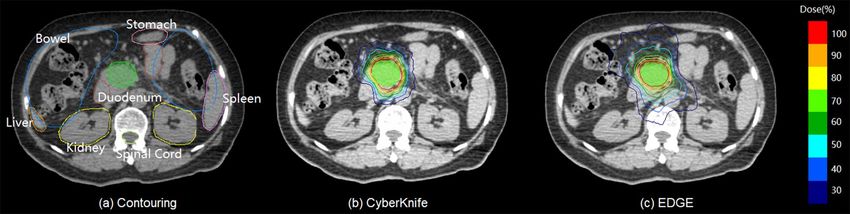
www.nature.com/scientificreports/
that IMRT offered better dose constrains for target and organs at risk (OAR) compared to 3DCRT. Brown
and Coworkers13 also demonstrated that with the technology of IMRT, the prescription dose could be increased
to 64.8 Gy, while maintained dose limits of OARs including spinal cord, liver, kidneys, and small bowel.
Although the IMRT provided a probability of better tumor control for locally pancreatic cancer, the organ
motion and patient set-up errors during the treatment may affect the radiation dose of organs due to the com-
plex site of OAR surrounding tumor14. As a new technique born of the synthesis of all of the above-mentioned
advances, stereotactic body radiotherapy(SBRT) is becoming more widespread, and it is probably known as a
promising method of radiotherapy for pancreatic cancer with greater normal tissue s paring15–18. With higher dose
per fraction, the dose gradient of SBRT plans is steeper than other conventional radiation, and has better spar-
ing of normal s tructures19. Lin et al. demonstrated the SBRT have the advantage of improving the local control
for pancreatic cancer compared to the I MRT20. Kumar et al.21 similarly made a dosimetric analysis of the SBRT
plans with duodenal sparing using volumetric-modulated arc therapy (VMAT) and IMRT in locally advanced
pancreatic cancer. SBRT plans usually applied non-coplanar field arrangement, especially for the CyberKnife
(Accuray, Inc, Sunnyvale) system22. With 6D robotic arm and accurate tracking techniques, the CyberKnife, a 6
MV linear accelerator, has high precision for dose delivery with a large degree of freedom, and the capability of
real-time tumor positioning and correction.
As a culmination in the field of radiosurgery, EDGE (Varian Medical Systems, Palo Alto, CA) has advantages
of safety, noninvasive, comfortable radiosurgery in the treatment of new experience. The general application of
EDGE is the intracranial SRS technique, which can eliminate small lesions of intracranial accurately. Another
application is the SBRT technique of real-time tracking and dynamic irradiation technology, focusing on body
dynamic target area constantly23. This machine is equipped with flattening filter (FF) and flattening filter free
(FFF) beams, and the high resolution multi-leaf collimators (MLC) of 120 leaves with 2.5 mm widths at the iso-
center24–26. Thus it could deliver higher dose rates more effectively and accurately while improving the conformity
of dose distribution to the target s imultaneously25.
Currently, there is no study directly comparing dose distributions of SBRT plans between the CyberKnife(CK)
and EDGE systems. In our study, two series of SBRT plans were generated using CK and EDGE platforms,
respectively. We evaluated the different dosimetric metrics for target and normal tissue, as well as analyzing the
radiobiological indices to reflect the response of radiation therapy.
Materials and methods
Patients data. This study performed a retrospective analysis of patients with pancreatic cancer who had
undergone SBRT. 15 patients with locally advanced unresectable pancreatic cancer were included in this study.
The inclusion criteria were as follows: (1) diagnose confirmed by pathological examinations; (2) locally advanced
pancreatic cancer; (3) unresectable cancer intolerant of surgical resections; (3) age ranging from 18 to 75 years;
(4) receiving the prescription dose of 6.5, 7.0 and 7.5 Gy × F; (5) ≥ 95% of PTV covered by prescription dose. The
following exclusion criteria were used: (1) patients with a history of radiotherapy prior to the SBRT; metastatic
pancreatic cancer.
Fiducial implantation will be done under endoscopic ultrasonography guidance. The number of implanted
fiducials is 3 (at least 1) which is preferable to be close to, but not in the tumor. A time-period of 4–7 days between
implantation and treatment planning CT-scan is applied.CT simulation was performed with head first supine
position on a Brilliance Big Bore 16-slice CT scanner (Philips, Amsterdam, the Netherlands) with a slice thickness
of 1.5 mm. Gross target volume (GTV) and critical structures including spinal cord, bowel, stomach, duode-
num and kidneys were contoured jointly by oncologist and radiologist based on the fusion of CT and magnetic
resonance (MR) images on the MultiPlan system (Accuray Inc., Sunnyvale CA; version 4.02). Planning target
volume (PTV) were defined by expanding the GTV with 2 or 3 mm margin in all directions. The median of GTV
was 18.79 c m3 (ranged from 2.67 to 34.73), and that of the PTV was 28.688 c m3 (ranged from 5.736 to 49.246).
The critical normal tissue include spinal cord, bowel, stomach, duodenum, left kidney, right kidney and spleen
were outlined according the Radiation Therapy Oncology Group (RTOG) for pancreatic c ancer27. All methods
were carried out in accordance with relevant guidelines and regulations. Informed Consent was obtained from
the patients for study participation. Consents for publication of data have been obtained from all patients. All
the patients included in this study are above 18 years old.
SBRT planning. According to the different prescribed dose, fifteen patients were divided into three groups,
and each group consisted of five patients. The prescription dose for the three groups were of 37.5 Gy/5F,
35.0 Gy/5F, 32.5 Gy/5F, respectively. The dose was prescribed to ~ 70% isodose line relative to maximum dose
of PTV. After importing all image data of 15 patients into two systems, CyberKnife (CK) and EDGE, different
SBRT treatment plans were designed by the same medical physicists The dose constrains of targets and normal
tissue were set to meet the criteria of the RTOG 0848 and the report of AAPM Task Group No. 101 (AAPM
TG-101)28–30, as shown in Table 1.
The CK plans were designed for G4 system with Multiplan TPS (version 4.0.2). The 6 MV FFF photon beam
was applied and dose rate was set to 800 MU/min with one or two cones with size of 10–30 mm. Beside the dosi-
metric constraints listed in Table 1, five ‘shells’ expanded isotropically from PTV were used to make steep dose
fall-off gradient. At the end of the optimization, beams and time reduction were used to make the plan clinically
practical. All CK plans were optimized using the sequential process with the ray tracing algorithm. Method of
1 fiducial plus X-sight spine and Synchrony Tracking technique were applied.
The plans for EDGE system were generated with the Varian Eclipse system (Varian Medical Systems, Palo
Alto, CA; version 13.5). A VMAT plan for each case was generated using two 360°arcs with the same iso-centre
at the geometric centre of PTV. The 10 MV FFF photon beam was chosen with a high dose rate of 2400 MU/min.
Scientific Reports | (2021) 11:4065 | https://doi.org/10.1038/s41598-021-83648-5 2
Vol:.(1234567890)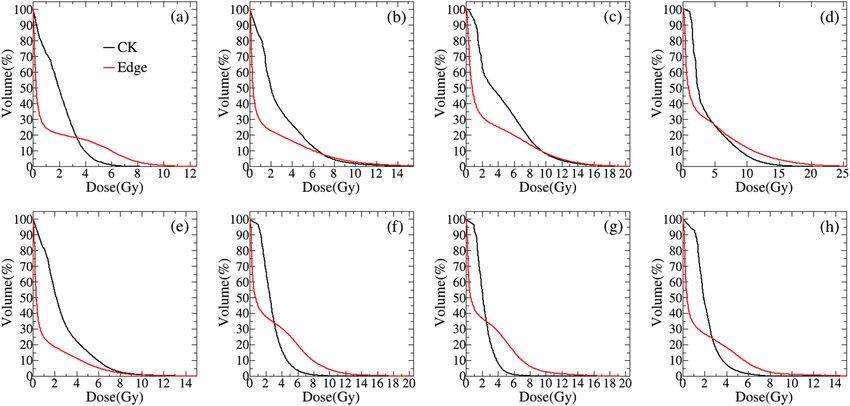
www.nature.com/scientificreports/
Structure Metrics Objective
V100 (%) ≥ 95%
PTV
PIDL ~ 70%
Dmax (Gy) < 27 Gy
Spinal Cord D0.25cc (Gy) < 22.5 Gy
D1.2cc (Gy) 13.5 Gy
Dmax (Gy) 32 Gy
Duodenum D5cc (Gy) < 18 Gy
D10cc (Gy) < 12 Gy
Dmax (Gy) < 35 Gy
Bowel
D5cc (Gy) < 19.5 Gy
Dmax (Gy) < 32 Gy
Stomach
D10cc (Gy) < 18 Gy
Liver V 700 cc
Dmean (Gy) < 12 Gy
Left kidney
V>23Gy (%) < 66.7%
Dmean (Gy) < 12 Gy
Right kidney
V>23Gy (%) < 66.7%
Spleen No constraint
Table 1. Dose constrains of target and normal tissue for SBRT plans.
Metrics CK + SD Edge + SD p
V100 (%) 96.8 ± 10.84 95.04 ± 0.03 0.000
Dmean (%) 123.91 ± 1.97 112.32 ± 3.39 0.000
D99 (%) 93.28 ± 2.53 97.13 ± 0.64 0.000
D95 (%) 102.92 ± 1.40 100.02 ± 0.01 0.000
D5 (%) 137.83 ± 2.30 125.40 ± 7.13 0.000
D1 (%) 139.42 ± 2.04 129.27 ± 7.42 0.000
CI 1.184 ± 0.076 0.986 ± 0.019 0.000
nCI 1.222 ± 0.072 1.037 ± 0.020 0.000
HI 0.416 ± 0.033 0.296 ± 0.077 0.000
GI 3.070 ± 0.222 4.145 ± 0.312 0.000
Table 2. The dosimetric indexes comparison of PTV between Cyberknife and EDGE plans.
All VMAT plans were optimized using the progressive resolution optimizer (PRO) and analytical anisotropic
algorithm (AAA) with a grid size of 1.5 mm were applied in dose calculation. In order to make the plan com-
parisons valid, both CK and EDGE plans were nornalized to ensure ≥ 95% of PTV covered by prescription dose.
Evaluation metrics of PTV. As were listed in Tables 1 and 2, the coverage and mean dose ( Dmean) of PTV,
as well as doses covered 99%, 95%, 5% and 1% of PTV (D99, D95, D5, D1) of PTV were categorized for plan evalua-
tion. Meanwhile, the conformity index (CI), new conformity index (nCI), homogeneity index (HI), and gradient
index (GI) were also used to quatify the plan quality. CI and nCI quatifying the target coverage and healthy tissue
sparing were defined as follow31:
V Rx
CI = Rx (1)
VPTV
Rx
V Rx VPTV
nCI = Rx
/ (2)
VPTV VPTV
where the V Rx is the volume covered by prescription isodose line (PIDL), VPTV is the target volume, and the
Rx
VPTV is the volume of target covered by PIDL. Smaller CI and nCI imply a more conformal plan and the ideal
values for both indices are 1.0.
The homogeneity index which mainly used to evaluate the degree of the dose uniformity inside the target
volume32 was defined as Eq. (3):
Scientific Reports | (2021) 11:4065 | https://doi.org/10.1038/s41598-021-83648-5 3
Vol.:(0123456789)www.nature.com/scientificreports/
D2 − D98
HI = (3)
DP
where the Dx is the dose that covers x percent volume of PTV, and the Dp is the prescription dose of target. Usu-
ally, HI > 0, and HI = 0 means each voxel of target volume receives the same dose.
At the same time, in order to assess the degree of dose fall-off outside the target volume, the gradient index
has been applied, which is calculated according to the following e quation33:
V50%
GI = (4)
V100%
where the V x% is the absolute volumes covered by x% of PIDL. For SBRT plan, smaller value of GI means steeper
dose fall-off and better normal tissue sparing.
Evaluation metrics of OARs. The maximum dose (Dmax) and mean dose (Dmean) of all the contoured
OARs were accessed. Moreover, organ specialized DVH metrics, for instance D 0.25cc and D
1.2cc of spinal cord,
were also evaluated according to AAPM TG-101. The details of OAR evaluation metrics were listed in Table 2.
At the saome time, equivalent uniform dose (EUD) was applied to convert the heterogeneous dose distributions
into homogeneous dose. Based on the phenomenological model introduced by Niemierko, the EUD is defined
as follows34:
1/a
EUD = vi EQDia (5)
i=1
where vi is the percentage of voxels receiving dose Di. The vi and Di values are acquired from the DVHs and the
sum of vi over all voxels equals 1. And parameter ‘a’ denotes the seriality property for different organs, and is
usually set to a positive value for OARs. In reference35 a parameter n = 1/a was used. The EQD is calculated as
follows, which is defined as biologically equivalent dose of 2 Gy per fraction:
α D
β + n
EQD = D ×
(6)
α
β +2
where n denotes the number of fractions, and α/β is a parameter from the issue-specific Linear Quadratic (LQ)
model of the certain organ, determining the fractionation sensitivity. The values of parameters a and a = b were
listed in Table 4 according to r eference35.
Volumes covered by different ISDL. To analyze the details of dose distribution outside PTV, the abso-
lute volumes of normal tissue that covered by x percent of prescription isodose lines (Vx) ranging from 100 to
10% with intervals of 10% were compared between CK and EDGE plans. Ratios between volumes of normal
tissue (Vx) and PTV (VPTV) were also calculated to minimize the effect resulted from different PTV volumes.
Meanwhile, effective distance REff was applied to quantify the dose fall-off details of different ISDL, which is
defined as follow:
x
REff = Riso − RPTV (7)
where Riso
x and R
PTV were the equivalent radius of spheres with volumes of Vx and VPTV, which were calculated
based on sphere volume formula V = 4πR3/3.
Statistical analysis. For those 15 patients with two different SBRT plans in EDGE and CK systems, a paired
t-test statistical analysis were performed using the IBM SPSS statistical software version 21 (SPSS Inc., Armonk,
NY) to determine the difference, and if P value < 0.05, it was consider to have the statistical significance. All datas
were listed in terms of mean value ± standard deviation (SD).
Ethics approval and consent to participate. The study was approved by the institutional review board
of National Cancer Center/National Clinical Research Center for Cancer/Cancer Hospital & Shenzhen Hospital.
We confirm that all methods were carried out in accordance with relevant guidelines and regulations.
Consent for publication. The consents for publication of data have been obtained from patients.
Results
In total, a retrospective analysis of 15 patients with pancreas cancer was performed. The treatment plans of
SBRT were designed in CK and EDGE systems, respectively. Plans generated in both platforms could meet the
clinical criteria of PTV coverage and OAR sparing. The median volume of tumor was 28.688cm3 (5.736–49.246
cm3). All of CK and EDGE plans were normalized to ensure at least 95% of PTV covered by prescription dose.
Evaluation of PTV. The comparison of isodose lines from 30 to 100% of the prescription dose for a selected
case was illustrated in Fig. 1. It reveals that both plans have excellent conformity and adequate coverage for PTV.
Scientific Reports | (2021) 11:4065 | https://doi.org/10.1038/s41598-021-83648-5 4
Vol:.(1234567890)www.nature.com/scientificreports/
Figure 1. Contouring and comparison of planar dose distribution for one selected case. (a) Is contouring of
target and OARs, and (b),(c) are planar dose distribution of CyberKnife and EDGE plans, respectively.
Figure 2. The average DVHs curves of PTV for plans with prescription dose of 37.5 Gy/5F (left column),
35.0 Gy/5F (middle column) and 32.5 Gy/5F (right column). The upper and lower rows represent the integral
and differential DVHs, respectively. The black line is for CK, and the red line is for EDGE.
Besides, we can find that the 100% PIDL (with red color) of EDGE plan is closer to PTV boundary than that of
CK plan.
The average DVHs of PTV for CK and EDGD plans are shown in Fig. 2. From integral DVHs displayed in
the upper row of Fig. 2, we have found that PTV coverage of EDGE plans are a little higher than that of CK in
all the three groups. Further, we have investigated the details of PTV DVHs in the way of differential as were
displayed in the lower row of Fig. 2, from which we may conclude that the voxel dose of EDGE plans are more
closed to prescription dose than the one of CK. It is also indicated that both of the cold and hot point volumes of
CK plans larger than those of EDGE plans. This means that EDGE plans are more conformal and homogeneous.
The dosimetric metrics of PTV including V100, Dmean, D99, D95, D5 and D1 are displayed in Fig. 3 and Table 2.
To ensure cases with different prescription doses are comparible, all of the dose-volume metrics are expressed
with percentage values. It is indicated that PTV coverage ( V100) is slightly higher for CK, which may results from
different normalization methods. Dosimetric metrics including Dmean, D99, D95, D5 and D1 are smaller for EDGE
except that D99 is a little higher compared with those of CK plans. This is consistent with Fig. 2. Other evaluation
Scientific Reports | (2021) 11:4065 | https://doi.org/10.1038/s41598-021-83648-5 5
Vol.:(0123456789)www.nature.com/scientificreports/
Figure 3. Comparison of different dosimetric metrics of PTV. (a)–(f) Is for V
100, Dmean, D99, D95, D5 and D
1,
respectively. The black line is for CK, and the red line is for EDGE.
Figure 4. Comparison different evaluationindexes of PTV for EDGE and CK plans. (a) Conformal index (CI),
(b) new conformal index (nCI), (c) homogeneity index (HI), (d) gradient index (GI). The black color is for CK,
and the red color is for EDGE.
indexes such as CI, nCI, HI and GI are displayed in Fig. 4a–d, and the statistical data is detailed in Table 2. The
CI and nCI of PTV for EDGE plans are 0.986 ± 0.019,1.037 ± 0.020, respectively, which are smaller than those
of CK plans with 1.184 ± 0.076 and 1.222 ± 0.072(as shown in Table 2). And HI of both plans are also compared,
from which the values of 0.296 ± 0.077 and 0.416 ± 0.033 are obtained for EDGE and CK, respectively. It can be
concluded that EDGE plans are superior in terms of conformity and homogeneity. However, GI for CK plans
are more lower than EDGE, which implies the steeper dose fall-off gradient.
Evaluation of OARs. The average DVHs of organs at risk including spinal cord, bowel, stomach, duode-
num, Liner, left kidney, right kidney and spleen are displayed in Fig. 5a–h. And Table 3 shows the results of
dose-volume parameters of normal tissue. All criteria of the dose constrain for normal tissue were achieved in
both systems. Compared with CK plans, the dosimetric metrics of spinal cord including D max, D0.25cc, D1.2cc were
slightly higher for EDGE plans with significant statistical differences, which indicates the decreased sparing of
spinal cord with EDGE. From Table 3, the D5cc of bowel and the mean dose of bowel, stomach, liver, and kidneys
are slightly lower for EDGE plans with statistic difference (p < 0.001), but other dose-volume metrics shows no
difference.
Scientific Reports | (2021) 11:4065 | https://doi.org/10.1038/s41598-021-83648-5 6
Vol:.(1234567890)www.nature.com/scientificreports/
Figure 5. The average DVH curves of normal tissue adjacent to tumor: (a) spinal cord, (b) duodenum, (c)
bowel, (d) stomach, (e) liver, (f) left kidney, (g) right kidney, and (h) spleen. The black line is for CK, and the red
line is for EDGE.
Structure Metrics CK + SD Edge + SD p
Dmax 5.69 ± 1.62 9.22 ± 2.04 0.000
Dmean 1.97 ± 0.53 1.45 ± 0.46 0.000
Spinal Cord
D0.25cc 5.12 ± 1.49 8.39 ± 1.79 0.000
D1.2cc 4.62 ± 1.30 7.60 ± 1.62 0.000
Dmax 16.22 ± 6.36 19.89 ± 5.95 0.140
Dmean 3.61 ± 1.43 3.49 ± 1.64 0.847
Duodenum
D5cc 8.34 ± 3.71 11.15 + 5.59 0.143
D10cc 6.66 ± 3.18 8.58 ± 5.13 0.271
Dmax 19.98 ± 5.25 20.56 ± 2.80 0.516
Bowel Dmean 2.81 ± 0.75 1.63 ± 0.59 0.000
D5cc 13.39 ± 0.91 15.26 ± 2.77 0.001
Dmax 20.68 ± 4.87 21.57 ± 6.52 0.422
Stomach Dmean 4.49 ± 1.73 2.82 ± 1.62 0.000
D10cc 11.82 ± 2.96 11.07 ± 4.32 0.347
Dmean 2.67 ± 1.23 1.23 ± 0.20 0.000
Liver
V23Gy (%) 2.80 ± 0.89 2.75 ± 1.09 0.798
Dmean 1.79 ± 0.49 0.48 ± 0.67 0.000
Right kidney
V>23Gy (%) 2.30 ± 0.62 2.47 ± 1.15 0.337
Dmax 7.56 ± 2.20 8.23 ± 3.60 0.450
Spleen
Dmean 2.16 ± 0.77 1.70 ± 1.19 0.027
Table 3. The dosimetric metrics comparison of OARs between Cyberknife and EDGE plans.
In order to further compare the dosimetric parameters of organ at risk for EDGE and CK, we calculated the
radiobiological parameter EUD by the Eqs. (5)–(6) according the DVHs of spinal cord, bowel, stomach, duode-
num, Liner, left kidney, right kidney and spleen, and the results are showed in Table 4. From the data of Table 4,
the EUD values of spinal cord, duodenum, stomach, left and right kidneys are lower for CK plans, expect the
liver having higher EUD value. And there are significantly statistic difference. But for bowel and spleen, both of
two series plans have the similar value of dose-volume and no statistic difference.
Scientific Reports | (2021) 11:4065 | https://doi.org/10.1038/s41598-021-83648-5 7
Vol.:(0123456789)www.nature.com/scientificreports/
EUD
Structure α/β n CK + SD Edge + SD p
Spinal Cord 3 0.05 3.47 ± 1.27 6.37 ± 1.79 0.000
Duodenum 4 0.15 7.73 ± 2.29 9.12 ± 1.98 0.001
Bowel 4 0.15 10.34 ± 3.30 10.54 ± 3.75 0.722
Stomach 4 0.15 8.47 ± 3.59 12.41 ± 6.08 0.005
Liver 3 0.32 3.64 ± 1.62 2.86 ± 1.62 0.000
Left kidney 3 0.7 2.06 ± 0.73 3.06 ± 1.42 0.001
Right kidney 3 0.7 1.68 ± 0.49 2.50 ± 1.14 0.001
Spleen 3 0.5 1.67 ± 0.58 2.17 ± 1.72 0.159
Table 4. Comparison of the EUD for OARs between CK and EDGE plans.
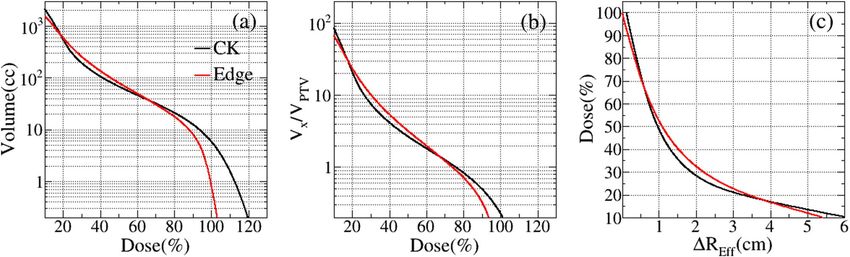
Figure 6. Comparison of normal tissue covered by different prescription isodose lines. (a) Absolute volumes
(Vx); (b) the volume ratios (Vx/VPTV); (c) dose fall-off distance (ΔREff ) for different isodose lines. The black line is
for CK, and the red line is for EDGE.
Volume (cc) Vx/VPTV ΔREff (cm)
Isodose (%) CK ± SD Edge ± SD p CK ± SD Edge ± SD p CK ± SD Edge ± SD p
100 5.81 ± 3.06 0.83 ± 0.45 0.000 0.23 ± 0.06 0.04 ± 0.02 0.000 0.13 ± 0.04 0.02 ± 0.01 0.000
90 12.57 ± 5.32 8.11 ± 3.15 0.000 0.50 ± 0.08 0.33 ± 0.06 0.000 0.26 ± 0.05 0.18 ± 0.02 0.000
80 21.09 ± 8.33 17.83 ± 6.62 0.006 0.84 ± 0.10 0.72 ± 0.11 0.004 0.40 ± 0.06 0.35 ± 0.04 0.004
70 31.75 ± 12.25 30.39 ± 11.31 0.358 1.26 ± 0.13 1.22 ± 0.16 0.490 0.56 ± 0.08 0.54 ± 0.07 0.416
60 46.06 ± 17.62 49.55 ± 18.49 0.112 1.82 ± 0.17 1.98 ± 0.24 0.057 0.74 ± 0.11 0.78 ± 0.10 0.067
50 67.74 ± 25.89 79.79 ± 29.63 0.002 2.67 ± 0.22 3.19 ± 0.35 0.001 0.97 ± 0.15 1.09 ± 0.14 0.000
40 106.21 ± 40.78 135.81 ± 51.41 0.000 4.16 ± 0.30 5.40 ± 0.53 0.000 1.31 ± 0.20 1.53 ± 0.21 0.000
30 193.03 ± 74.99 255.94 ± 97.82 0.000 7.54 ± 0.65 10.16 ± 0.89 0.000 1.88 ± 0.30 2.21 ± 0.30 0.000
20 553.84 ± 264.31 590.73 ± 212.06 0.237 21.21 ± 4.91 23.58 ± 2.03 0.098 3.26 ± 0.67 3.42 ± 0.44 0.098
10 2158.22 ± 921.62 1584.76 ± 427.80 0.002 86.18 ± 16.20 67.59 ± 18.88 0.000 6.14 ± 0.91 5.43 ± 0.50 0.001
Table 5. Volume comparison of normal tissue covered by different isodose lines.
Dosimetric comparison with different ISDL. The average volume of normal tissue covered by differ-
ent prescription isodose lines are displayed in Fig. 6. In the Fig. 6a,b, the EDGE plans have the less volumes of
normal tissue for the lower and higher prescription isodose region than CK plans, which provide the superior-
ity to control the hot spot of tumor. These results are also in consistent with the Figs. 2 and 3. However, for the
intermediate dose region with 20–70% of prescription isodose, it is obvious that the volume of normal tissue
received radiation dose for CK plans are less than EDGE plans, as accordance with the Fig. 5 and Table 3. In the
Fig. 6c, within the radius R of 0–1 cm, the CK plans showed the steeper dose fall-off gradient, as same the shown
in Fig. 4. The average volumes, standard deviation (SD) and p values are listed in Table 5.
Scientific Reports | (2021) 11:4065 | https://doi.org/10.1038/s41598-021-83648-5 8
Vol:.(1234567890)www.nature.com/scientificreports/
Discussion
In this study, we made a plan quality comparison in terms of various dosimetric metrics for pancreatic cancer
SBRT between Varian CyberKnife and EDGE systems. Both of the two techniques had the capability of produc-
ing clinically acceptable plans with adequate PTV coverage and OAR sparing. These results showed that EDGE
plans offered more conformal and homogeneous dose distribution for PTV, while CK plans had slightly better
dose coverage of PTV and the steeper dose fall-off gradient. For OARs, except D5cc of bowel and the mean dose
of bowel, stomach, liver, and kidneys are slightly lower for EDGE plans, the rest dose-volume metrics, as well as
EUD were all lower for CK plans. When investigating the details of dose distribution outside PTV, it was obtained
that the volumes covered by intermediate ISDL (ranging from 20 to 70%) were much lower for CK plans, while
the EDGE plans indicated superior sparing for lower and higher dose region.
Our data indicated that the EDGE plans were more conformal and homogeneous compared to the CK plans.
This may be related to the field arrangement and delivery techniques for different platforms. On the one hand,
hundreds of non-coplanar field were used for CK plans while only two coplaner 360° arcs were applied for EDGE
plans. This results in that the entire dose being deposited within the plane of the arcs for EDGE plans, while the
radiation dose was concentrated in the center of the target area with much bigger degree of freedom for beam
directions. At the same time, the hot spot in CK may be a litter larger than that of EDGE. On the other hand, the
collimators of the two systems are also very different. CK plans only adopted 1–2 circular cones for beam shaping,
but for EDGE system is equiped with high definition HD120 MLCs with spatial resolution of 2.5 mm23, which
may made the better conformity and homogeneity of PTV for EDGE simultaneously, as shown in Figs. 1, 2 and 3.
For the two series of plans, the CK plans used the 6 MV FFF beams, while the EDGE chose the 10 MV FFF
beams. When removing the flattening filter, it can offer increasing dose rate and make the beam profile more
forward at the central axis. At the same time, there are other advantages for FFF beams, such as reduction of the
scattered radiation and treatment head leakage25. With the 10 MV FFF modes, it could result in the relatively
lower radiation dose exposure for OARs, as well as for the integrated body. However, in this study, the EDGE
plans did not show any superiority for OAR sparing. Our previous study regarding to localized prostate cancer
showed that EDGE plans not only provided more conformal and homogeneous dose distribution for PTV, but
also steeper dose fall-off gradient and superior OAR sparing. The inconsistent results may partly due to the dif-
ferent shapes of PTV that affect the dose distributions. The shape of pancreatic cancer had a relatively regular
shape, approximately ellipsoidal, so that both of the two series of plans were made to meet the dose constrains
of PTV easily. In the Multiplan system, five ‘shells’ were applied to limit the dose outside PTV, which may lead
to better normal tissue sparing. The delivery efficiency of beam is one of the most significant differences between
the CK and EDGE systems. The average treatment time of per fraction was 2–3 min approximately for the EDGE,
and 40–50 min approximately for the CK according to our clinical experience. On the one hand, the reduction of
average delivery time can alleviate the discomfort of patients during radiotherapy. On the other hand, the effects
of intra-fractional organs motion would be reduced by decreasing the treatment time for E DGE36–38.
Our results did show that a dose escalation of SBRT for pancreatic cancer in EDGE and CK systems both
could reach the clinical criteria. But there are still some lmitations for this study. This study is a retrospective
analysis and the SBRT plans for EDGE were not applied in clinical practice. Further studies were warranted to
assess the clinical utility and radiobiological responses. Another limitations is that there is no consistent results
for PTV margins and the organs m otion[38, 39]. Whether patient specialized PTV margins could be obtain for
different platforms, and how much the margins would affect the dose distribution for surrounding normal tissue
will be the next tissue for our further study.
Conclusion
A comparative quantitative assessment of the dosimetric and radiobiological indices of SBRT plans for 15 patients
with pancreatic cancer between CK and EDGE systems.We confirm that radiotherapy systems with different
characteristics should be investigated and utilized to help radiation oncologists choose a proper SBRT method
for each individual patient to get better therapeutic effects. Although the CK system indicate better OAR sparing,
the EDGE system can be regarded as an alternative option for SBRT of pancreatic cancer, especially for patients
who cannot remain lying in bed for a long time.
Data availabilty
Not applicable.
Received: 13 May 2020; Accepted: 3 February 2021
References
1. Siegel, R., Ma, J., Zou, Z. & Jemal, A. Cancer statistics, 2014. CA: A Cancer J. Clin. 64, 9–29. https://doi.org/10.3322/caac.21208
(2014).
2. Willett, C. G., Czito, B. G., Bendell, J. C. & Ryan, D. P. Locally advanced pancreatic cancer. J. Clin. Oncol. 23, 4538–4544. https://
doi.org/10.1200/JCO.2005.23.911 (2005).
3. Sabater, L. et al. Borderline resectable pancreatic cancer.Challenges and controversies. Cancer Treat. Rev. 68, 124–135. https://doi.
org/10.1016/j.ctrv.2018.06.006 (2018).
4. Lin, Q.-J., Yang, F. & Fu, D.-L. Current status and progress of pancreatic cancer in china. World J. Gastroenterol. 21, 7988–8003.
https://doi.org/10.3748/wjg.v21.i26.7988 (2015).
5. Krishnan, S. et al. Induction chemotherapy selects patients with locally advanced, unresectable pancreatic cancer for optimal
benefit from consolidative chemoradiation therapy. Cancer 110, 47–55. https://doi.org/10.1002/cncr.22735 (2007).
Scientific Reports | (2021) 11:4065 | https://doi.org/10.1038/s41598-021-83648-5 9
Vol.:(0123456789)www.nature.com/scientificreports/
6. Hammel, P. et al. Effect of chemoradiotherapy vs chemotherapy on survival in patients with locally advanced pancreatic cancer
controlled after 4 months of gemcitabine with or without erlotinib: the LAP07 randomized clinical trial. JAMA 315, 1844–1853.
https://doi.org/10.1001/jama.2016.4324 (2016).
7. Nakamura, A. et al. Analysis of dosimetric parameters associated with acute gastrointestinal toxicity and upper gastrointestinal
bleeding in locally advanced pancreatic cancer patients treated with gemcitabine-based concurrent chemoradiotherapy. Int. J.
Radiat. Oncol. 84, 369–375. https://doi.org/10.1016/j.ijrobp.2011.12.026 (2012).
8. Ben-Josef, E. et al. A phase i/ii trial of intensity modulated radiation (IMRT) dose escalation with concurrent fixed-dose rate
gemcitabine (FDR-G) in patients with unresectable pancreatic cancer. Int. J. Radiat. Oncol. Biol. Phys. 84, 1166–1171. https://doi.
org/10.1016/j.ijrobp.2012.02.051 (2012).
9. Wild, A. et al. A phase 2 multi-institutional study to evaluate gemcitabine and fractionated stereotactic radiotherapy for unresect-
able, locally advanced pancreatic adenocarcinoma. Pract. Radiat. Oncol. 3, S4-5. https: //doi.org/10.1016/j.prro.2013.01.016 (2013).
10. Yovino, S. et al. Intensity-modulated radiation therapy significantly improves acute gastrointestinal toxicity in pancreatic and
ampullary cancers. Int. J. Radiat. Oncol. Biol. Phys. 79, 158–62. https://doi.org/10.1016/j.ijrobp2009.10.043 (2011).
11. Goto, Y. et al. Clinical evaluation of intensity-modulated radiotherapy for locally advanced pancreatic cancer. Radiat. Oncol. 13,
118. https://doi.org/10.1186/s13014-018-1063-5 (2018).
12. Colbert, L. et al. Dose escalation with an imrt technique in 15 to 28 fractions is better tolerated than standard doses of 3dcrt for
lapc. Adv. Radiat. Oncol. 2, 403–415. https://doi.org/10.1016/j.adro.2017.02.004 (2017).
13. Brown, M. W. et al. A dosimetric analysis of dose escalation using two intensity-modulated radiation therapy techniques in locally
advanced pancreatic carcinoma. Int. J. Radiat. Oncol. 65, 274–283. https://doi.org/10.1016/j.ijrobp.2006.01.003 (2006).
14. Jones, A. O. & Kleiman, M. T. Patient setup and verification for intensity-modulated radiation therapy (imrt). Med. Dosim. 28,
175–183. https://doi.org/10.1016/S0958-3947(03)00069-4 (2003).
15. Dagoglu, N. et al. Stereotactic body radiotherapy (sbrt) reirradiation for recurrent pancreas cancer. J. Cancer 7, 283–288. https://
doi.org/10.7150/jca.13295(2016).
16. Hajj, C. & Goodman, K. A. Role of radiotherapy and newer techniques in the treatment of gi cancers. J. Clin. Oncol. 33, 1737–1744.
https://doi.org/10.1200/JCO.2014.59.9787 (2015).
17. Kim, S., Wu, C.-C. & Horowitz, D. Stereotactic body radiotherapy for the pancreas: a critical review for the medical oncologist. J.
Gastrointest. Oncol. 7, 479–486. https://doi.org/10.21037/jgo.2015.10.01 (2016).
18. Moningi, S. et al. The role of stereotactic body radiation therapy for pancreatic cancer: a single-institution experience. Ann. Surg.
Oncol. https://doi.org/10.1245/s10434-014-4274-5 (2015).
19. Milano, M., Constine, L. & Okunieff, P. Normal tissue toxicity after small field hypofractionated stereotactic body radiation. Radiat.
Oncol. (London, England) 3, 36. https://doi.org/10.1186/1748-717X-3-36 (2008).
20. Lin, J.-C., Jen, Y.-M., Li, M.-H., Chao, H.-L. & Tsai, J. T. Comparing outcomes of stereotactic body radiotherapy with intensity-
modulated radiotherapy for patients with locally advanced unresectable pancreatic cancer. Eur. J. Gastroenterol. Hepatol. 27,
259–264. https://doi.org/10.1097/MEG.0000000000000283 (2015).
21. Kumar, R. et al. Stereotactic body radiation therapy planning with duodenal sparing using volumetric-modulated arc therapy vs
intensity-modulated radiation therapy in locally advanced pancreatic cancer: a dosimetric analysis. Med. Dosim. Off. J. Am. Assoc.
Med. Dosim. 38, 243–25. https://doi.org/10.1016/j.meddos.2013.02.003 (2013).
22. Antypas, C. & Pantelis, E. Performance evaluation of a cyberknife g4 image-guided robotic stereotactic radiosurgery system. Phys.
Med. Biol. 53, 4697–4718. https://doi.org/10.1088/0031-9155/53/17/016 (2008).
23. Wen, N. et al. Characteristics of a novel treatment system for linear accelerator-based stereotactic radiosurgery. J. Appl. Clin. Med.
Phys. 16, 5313. https://doi.org/10.1120/jacmp.v16i4.5313 (2015).
24. Yin, F.-F. et al. Dosimetric characteristics of novalis shaped beam surgery unit. Med. Phys. 29, 1729–1738. https://doi.
org/10.1118/1.1494830 (2002).
25. Georg, D., Knöos, T. & Mcclean, B. Current status and future perspective of flattening filter free photon beams. Med. Phys. 38,
1280–1293. https://doi.org/10.1118/1.3554643 (2011).
26. Chang, Z. et al. Dosimetric characteristics of novalis tx system with high definition multileaf collimator. Med. Phys. 35, 4460–4463.
https://doi.org/10.1118/1.2977668 (2008).
27. Goodman, K. A. et al. Radiation therapy oncology group consensus panel guidelines for the delineation of the clinical target volume
in the postoperative treatment of pancreatic head cancer. Int. J. Radiat. Oncol. Biol. Phys. 83, 901–908. https://doi.org/10.1016/j.
ijrobp.2012.01.022 (2012).
28. Regine, W., Lowy, A. & Haustermans, K. Radiation therapy oncology group rtog 0848 a phase iii trial evaluating both erlotinib
and chemoradiation as adjuvant treatment for patients with resected head of pancreas adenocarcinoma. RTOG (2020).
29. Ling, T. C. et al. Evaluation of normal tissue exposure in patients receiving radiotherapy for pancreatic cancer based on RTOG
0848. J. Gastrointest. Oncol. 6, 108–14. https://doi.org/10.3978/j.issn.2078-6891.2014.094 (2015).
30. Benedict, S. et al. Stereotactic body radiation therapy: the report of aapm task group 101. Med. Phys. 37, 4078–4101. https://doi.
org/10.1118/1.3438081 (2010).
31. Feuvret, L., Noël, G., Mazeron, J.-J. & Pierre, B. Conformity index: a review. Int. J. Radiat. Oncol. Biol. Phys. 64, 333–42. https://
doi.org/10.1016/j.ijrobp.2005.09.028 (2006).
32. Kataria, T., Sharma, K., Subramani, V., Karrthick, K. P. & Bisht, S. S. Homogeneity index: an objective tool for assessment of con-
formal radiation treatments. J. medical physics 37, 207–213. https://doi.org/10.4103/0971-6203.103606 (2012).
33. Paddick, I. & Lippitz, B. A simple dose gradient measurement tool to complement the conformity index. J. Neurosurg. 105(Suppl),
194–201. https://doi.org/10.3171/sup.2006.105.7.194 (2006).
34. Niemierko, A. A generalized concept of equivalent uniform dose (EUD). Med. Phys. 26, 1100 (1999).
35. Luxton, G., Keall, P. & King, C. A new formula for normal tissue complication probability (ntcp) as a function of equivalent uniform
dose (eud). Phys. Med. Biol. 53, 23–36. https://doi.org/10.1088/0031-9155/53/1/002 (2008).
36. Li, Y. et al. Su-e-j-133: evaluation of inter- and intra-fractional pancreas tumor residual motions with abdominal compression.
Med. Phys. 41, 186–186. https://doi.org/10.1118/1.4888186 (2014).
37. Taniguchi, C. M. et al. Dosimetric analysis of organs at risk during expiratory gating in stereotactic body radiation therapy for
pancreatic cancer. Int. J. Radiat. Oncol. 85, 1090–1095. https://doi.org/10.1016/j.ijrobp.2012.07.2366 (2013).
38. Fukada, J. et al. Quantification of interfraction and intrafraction pancreas motion using pancreatic stent. Int. J. Radiat. Oncol. 93,
E178–E179. https://doi.org/10.1016/j.ijrobp.2015.07.1005 (2015).
39. Scobie, S., Adamson, S., Malik, J., Law, A. & Mclaren, D. Intrafraction prostate motion during radical radiotherapy: evaluation of
current clinical tolerance. Clin. Oncol. https://doi.org/10.1016/j.clon.2014.11.014 (2015).
Acknowledgements
No acknowledgement.
Scientific Reports | (2021) 11:4065 | https://doi.org/10.1038/s41598-021-83648-5 10
Vol:.(1234567890)www.nature.com/scientificreports/
Author contributions
Conception and design: Z.T.D., N.L. Acquisition of data: Z.T.D., T.T.C., L.Z., M.Z. Analysis of data: Z.T.D., M.Z.
Writing, review and/or revision of the manuscript: Z.T.D., L.M., T.T.C., N.L. All authors reviewed the manuscript.
Funding
This work is supported by the National Natural Science Foundation of China (Grant No. 81871509), and China
Postdoctoral Science Foundation (Grant No. 2018M640725).
Competing interests
The authors declare no competing interests.
Additional information
Correspondence and requests for materials should be addressed to N.L.
Reprints and permissions information is available at www.nature.com/reprints.
Publisher’s note Springer Nature remains neutral with regard to jurisdictional claims in published maps and
institutional affiliations.
Open Access This article is licensed under a Creative Commons Attribution 4.0 International
License, which permits use, sharing, adaptation, distribution and reproduction in any medium or
format, as long as you give appropriate credit to the original author(s) and the source, provide a link to the
Creative Commons licence, and indicate if changes were made. The images or other third party material in this
article are included in the article’s Creative Commons licence, unless indicated otherwise in a credit line to the
material. If material is not included in the article’s Creative Commons licence and your intended use is not
permitted by statutory regulation or exceeds the permitted use, you will need to obtain permission directly from
the copyright holder. To view a copy of this licence, visit http://creativecommons.org/licenses/by/4.0/.
© The Author(s) 2021
Scientific Reports | (2021) 11:4065 | https://doi.org/10.1038/s41598-021-83648-5 11
Vol.:(0123456789)You can also read