HYPERION GROWTH EQUITIES - Disruption, growth and value in the new economic framework
←
→
Page content transcription
If your browser does not render page correctly, please read the page content below

Title

                      HYPERION GROWTH
                      EQUITIES
                      Disruption, growth and value in the
                      new economic framework

                      Webinar Presentation
                      6 August 2020

Webinar 2020_08                                             0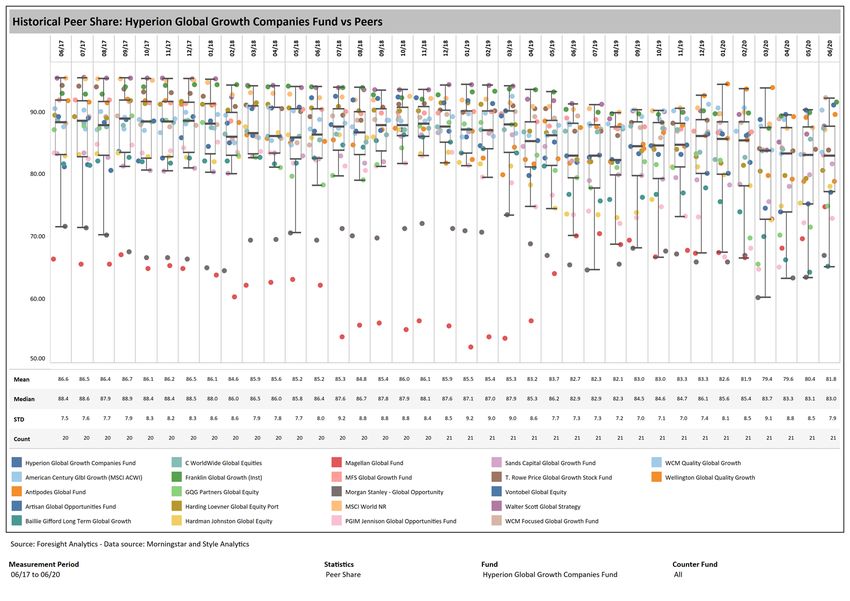
Title
GENERAL DISCLAIMER

This presentation has been prepared by Hyperion Asset Management Limited (‘Hyperion’) ABN 80 080 135 897 AFSL 238380.

The information is not intended for general distribution or publication and must be retained in a confidential manner. Information contained herein consists of confidential
proprietary information constituting the sole property of Hyperion and its investment activities; its use is restricted accordingly. All such information should be maintained in a
strictly confidential manner.

This is for general informational purposes only and is only intended to provide a summary of the subject matter covered. It does not purport to be comprehensive or to give
advice. The views expressed are the views of the writer at the time of preparation and presenting and may change over time. This is not an offer document and does not
constitute an offer or invitation of investment recommendation to distribute or purchase securities, shares, units or other interests to enter into an investment agreement. No
person should rely on the content and/or act on the basis of any material contained in this document.

                                                                                                                                                                                 1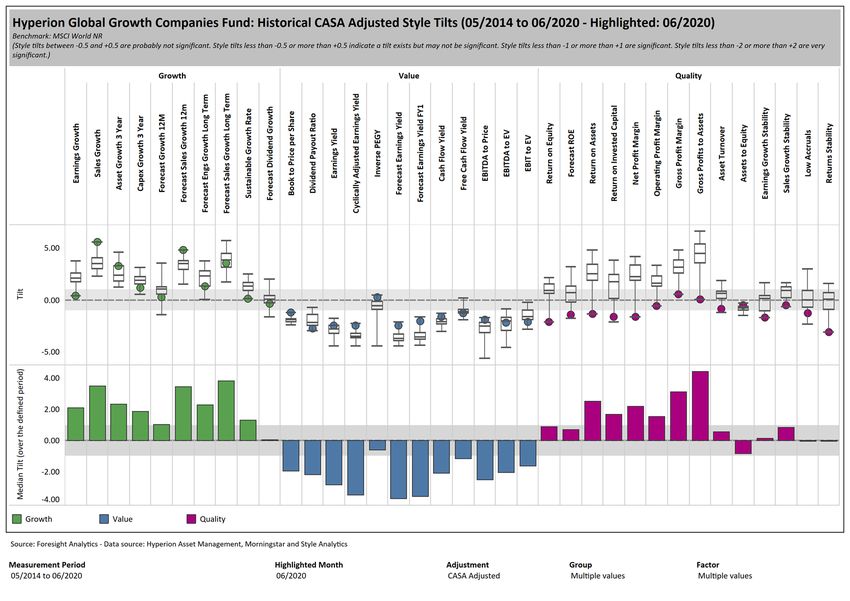
Title
                    Lead Portfolio Manager Biographies

    MARK ARNOLD – LEAD PORTFOLIO MANAGER, CHIEF INVESTMENT OFFICER & MANAGING DIRECTOR
    CFA, B.Com, LLB, CA, SF Fin
    Mark has been a key contributor to the investment returns Hyperion has achieved since its inception in 1996. He has played an integral role in the design of
    Hyperion’s investment process and was instrumental in establishing the organisational culture that has underpinned Hyperion’s long-term success.

    Mark is Lead Portfolio Manager, Chief Investment Officer and Managing Director of Hyperion. Mark is the most senior and experienced Portfolio Manager in the
    investment team and has the most influence over Hyperion’s investment decision making. He has portfolio management responsibilities across all of Hyperion’s
    equity strategies. He is also the Chair of Hyperion’s Investment Committee.

    Mark has been professionally analysing listed companies since 1991. He originally worked as a research analyst at Stockbroker Lance Jones Limited and then at
    Wilsons. Wilsons was the creator and original 100% equity owner of Hyperion. Mark is a qualified chartered accountant. Prior to establishing himself in the
    investment industry, Mark worked for KPMG. He holds undergraduate qualifications in Commerce and Law. Mark is a CFA Charterholder and a substantial shareholder
    in Hyperion.

    JASON ORTHMAN – LEAD PORTFOLIO MANAGER & DEPUTY CHIEF INVESTMENT OFFICER
    CFA, B.Eng (Chemical), B.Bus.
    Jason was promoted to Deputy Chief Investment Officer in 2017 in recognition of his contribution to Hyperion’s alpha and strong communication skills within the
    broader team. Jason is also an Executive Board member of Hyperion Asset Management and serves as Deputy Chair of the Hyperion Executive Committee.
    He continues to serve as a lead portfolio manager across its three equity strategies (Australian Equities, Small Cap and Global Equities). The two lead portfolio
    managers have the majority of the influence in setting stock weights and are responsible for what stocks enter and exit the portfolios.

    Jason joined Hyperion in 2008 as an Investment Analyst and was promoted to Portfolio Manager in 2009. Jason continues to be responsible for the research of
4   equities in support of the team’s investment decisions across Hyperion’s product range. Jason gained 6 years industry experience as a Senior Research Analyst with a
    stock broker, Wilsons, prior to joining Hyperion. He joined Wilsons in 2002 and spent most of his time at the firm in Research as a small to mid-cap Equity Analyst. He
    has covered a wide range of sectors including mining services, retail, manufacturing and waste.

    Jason has a Bachelor of Chemical Engineering (1st Class Honours) and a Bachelor of Business Management from the University of Queensland. He also completed a
    Graduate Diploma of Applied Finance and Investment from the Australian professional body (now called FINSIA). Jason is a CFA Charterholder and significant
    shareholder of Hyperion.

    “Investing is an intellectual challenge that includes unpacking different companies, business models and trends. It’s a thrill to find new opportunities that create value
    over time.”
Title Values & Beliefs
                                    Hyperion’s Mission,

      Hyperion’s mission is to protect and grow our clients’ capital sustainably over the long term.

Our values are:
      1. Research driven, not marketing driven
      2. Evidence based and merit based
      3. Alpha focused
      4. Think long term
      5. Business owners, not share traders
      6. Collective first

Hyperion’s total FUM is predominantly from investment performance, not client inflows. The table below shows that
alpha generation related FUM is currently approximately $2.8 billion (35% of total FUM), this compares to
approximately $1.2 billion (17% of total FUM) that is from net client contributions.

                                    FUM Generation                         $B (AUD)

                                    Net Flows from Clients   17%             1.2

                                    Market Return            48%             3.8

                                    Alpha                    35%             2.8

                                    Total FUM*               100%            7.8

  *Total FUM as of 30th June 2020
                                                                                                                    3
Titlethat Drive Progress
             Modern Businesses

Hyperion has identified a new economic framework – comprising
       a low growth, disrupted, internet-enabled world

  Hyperion backs progress rather than betting against change

    Invest in modern businesses that drive structural change

   A narrow group of structural winners lead markets higher

                                                                44
Winners & Losers in theTitle
                                 new economic framework?

1.   What does the new economic framework look like going forward?

2.   What investment styles are going to work when many will fail?

3.   Who are the disruptive companies of the future?

4.   What does the market misunderstand in assessing valuations for structural

     growth businesses?

5.   Which sectors can drive EPS growth irrespective of GDP growth?

6.   Portfolio and market update.

                                                                                 5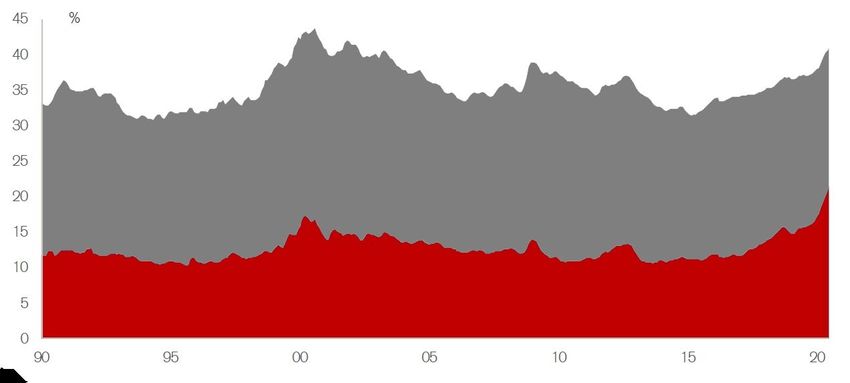
1. New economic frameworkTitle
                               - significant headwinds post-GFC

  Ageing population           High debt levels         Rising wealth inequality

   Natural resource        Plus technology – greater      Declining monetary
constraints & disruption   automation, AI & sharing            tailwinds

                                                                             6    6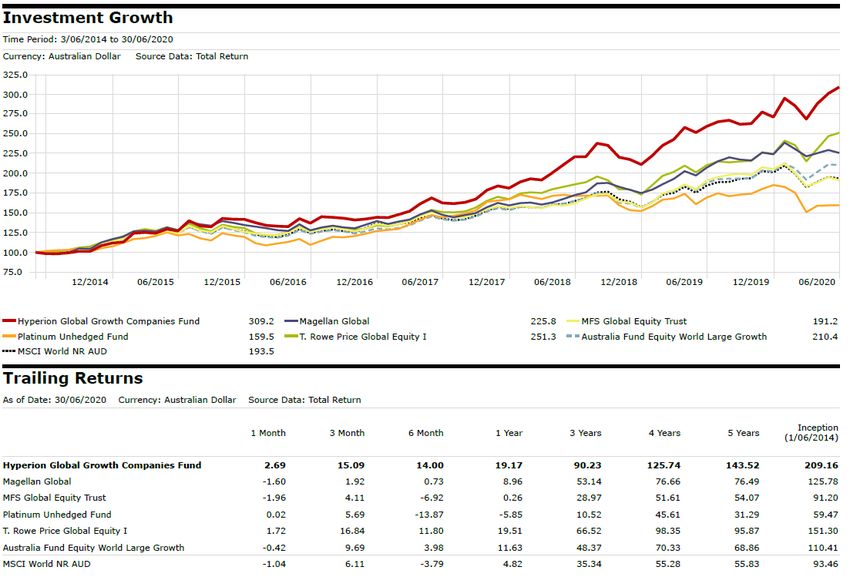
Title
          1. New economic framework – low growth world

Hyperion has identified a new economic framework since 2008…

1.   Low growth, low inflation, low interest rate world.

2.   Competitive, disrupted, internet-enabled business environment.

3.   Technology has moved from edges to core of society and business.

4.   Only sustainable source of revenue growth is from market share gains.

5.   Mean reversion has been replaced with dispersion as it’s become a winner

     takes all environment in a globalised, digital world.

                                                                                7
2. What investment stylesTitle
will work while many will fail?
Hyperion believes most incumbent investment styles may fail in a new economic
framework…
1. Traditional value needs another “economic growth bubble”
2. Common benchmark aware, active strategies are less effective when large, old world
businesses dominate an index
3. Tailwinds behind passive investing have ended with interest rates near zero and many
benchmark stocks being disrupted
4. Historical results suggest shorting is a marketing gimmick that reduces long-term
returns
8The value
2. Theanomaly performs
Title
Value Anomaly poorly
– Updated forin difficult low
COVID-19
growth and low inflation environments
Sources: Hyperion, Kenneth French 99Titlefuture - narrow set of winners
3. Disruptive companies of the
• Equity markets have always been driven higher by a narrow range of huge winners.
Normal distributions are not relevant in investing in equities.
• The excess returns (relative to treasury bills) produced by US equities from 1926 to
2016 is extremely narrow. This is replicated in markets including Australia, NZ and UK.
• The best-performing 4% of US listed companies explain the entire net gain for the US
stock market since 1926.
Characteristic Bell Curve Cumulative percent of wealth creation, top 1,100
0.025
100%
0.020
80%
0.015
60%
0.010
40%
0.005 20%
0.000 0%
0 25 50 75 100 0 200 400 600 800 1000
Number of firms
Source: Bessembinder, H. 2018. Do stocks outperform Treasury bills?. Journal of Financial Economics, 129(3): 440-457. 10Titlefuture - narrow set of winners
3. Disruptive companies of the
• Equity markets have always been driven higher by a narrow range of huge winners.
• Earnings have increased significantly more than market cap for winners
% of Market Cap – Top 5 vs. Top 25 Companies % of Market Cap - Top 5
21.9%
Mkt Cap +22%
18.0%
13.9%
Earnings +49%
9.3%
March '00 Current
Top 5 Companies S&P 500
Source: Credit Suisse (2020), Golub, J., Palfrey, P., Manish, B., Coates, M., & Erica, C. 2020. Market Concentration Not a Problem. 11Title
3. Disruptive companies of the future – Hyperion stocks
• Future returns will be concentrated in a small number of stocks with the
potential to outperform & with the following attributes:
• Structural tailwinds
• Large addressable markets
• Sustainable competitive advantages
• Capital light, proven business models
• Low debt levels
3 - Interest rates lower for longer – who benefits?
• Management with long-term focus
Global Growth Australian Growth Small Growth
Amazon Afterpay Dominos
Tesla Dominos Nanosonics
Square Fisher & Paykel Pro Medicus
ServiceNow WiseTech Pushpay
PayPal Xero Technology One
12 12Title structural growth
4. Difficulty in valuing
Market inefficiencies in valuing structural growth (VSG) companies…
1. Market can’t distinguish between above average businesses and a few
exceptional, persistent compounders.
2. Market does not take a long-term view in order to value a business in 10
years time – its focussed on short-term results.
3. Market is focused on linear results and does not understand exponential
growth – as it occurs so rarely.
13Title
4. Amazon – Global example of structural growth
Amazon.com Inc. (AMZN-US) - Share Price Index vs. Sales Per Share and Benchmark Index
1,000,000
AVERAGE HISTORICAL PE RATIO SINCE IPO^:
- AMZN-US: 195.5x*
- MSCI World Index: 16.3x
TOTAL PRICE APPRECIATION SINCE IPO:
100,000 - AMZN-US: 123,089%
- MSCI World Index Return: 209%
AMZN-US SALES PER SHARE CHANGE SINCE IPO:
Price Index (log-scale)
- Sales per Share: 97,575%
10,000
CAGR SINCE IPO:
- AMZN-US: 37.0%
- MSCI World: 5.1%
1,000
100
1997 1998 1999 2000 2001 2002 2003 2004 2005 2006 2007 2008 2009 2010 2011 2012 2013 2014 2015 2016 2017 2018 2019
AMZN Share Price Index MSCI World Index Sales Per Share
*Negative historical PE ratios have been excluded. ^AMZN-US IPO date: May 1997.
Source: FactSet. 14 14Title
4. Xero – Domestic example of structural growth
Xero Limited (XRO-AU) - Share Price Index vs. Sales Per Share and Benchmark Index
1,600 2,000
AVERAGE HISTORICAL PE RATIO SINCE IPO^:
- XRO-AU: N/A* 1,800
1,400 - All Ordinaries: 16.3x
1,600
TOTAL PRICE APPRECIATION SINCE IPO:
1,200 - XRO-AU: 1,355%
- ASX300 Market Return: 101% 1,400
1,000 XRO-AU EPS & SALES PER SHARE CHANGE SINCE IPO:
Sales Per Share Index
1,200
- Sales per Share: 1,708%
Price Index
800 CAGR SINCE IPO: 1,000
- XRO-AU: 46.6%
- ASX300: 10.5% 800
600
600
400
400
200
200
0 0
2012 2013 2014 2015 2016 2017 2018 2019
XRO Share Price Index S&P/ASX300 Price Index Sales Per Share
*Negative historical PE and EPS ratios have been excluded. ^XRO-AU IPO date: November 2012.
Source: FactSet. 15 15Title
5. Growth sectors - COVID-19 provides a glimpse
• COVID-19 provided a glimpse into the future where technology is relied upon
and modern business models dominate.
• Insight into how we consume, transact, pay and operate remotely and
digitally.
• Clarity has emerged around the winning and losing sectors (and companies).
• Hyperion’s key structural themes have accelerated.
16 16Title– new payments
5. Growth sectors
• $100T global payments industry is undergoing a structural shift as consumer
habits of the next generations shift.*
• Millennials and Gen Z have no loyalty to traditional banks and don’t like credit
cards.
• We estimate 70% of those under 30 years old in the US don’t have a credit
card.
Source: *Paypal Holdings, Inc. Bernstein Strategic Decisions Virtual Conference Transcript (2020)
Source: Logos sourced from Company Websites (Square, Inc. and Afterpay Ltd.) 17 175. Growth sectorsTitle
– new payments cont.
• Structural shift in payments will create exponential growth for the new
disruptive, market leaders.
Square, Inc. - Seller & consumer usage Afterpay Ltd - Merchant & consumer usage
Monthly Transacting Cash App Users & Seller Gross Payment Global Merchants & Global Active Members
Volume 10 60
50 120
9
45
50
100 8
40
Active Members (millions)
7
Merchants (thousands)
35 40
80
6
Billions ($USD)
30
Millions
25 60 5 30
20 4
40 20
15 3
10 2
20 10
5 1
0 0 0 0
2012 2013 2014 2015 2016 2017 2018 2019 2020e 2015 2016 2017 2018 2019 2020
Monthly Transacting Cash App Users (LHS) Seller Gross Payment Volume (RHS) Global Active Members (LHS) Global Active Merchants (RHS)
Source: Hyperion, Square, Inc. and Afterpay Ltd.
Any projections contained are estimates only and may not be realised in the future.
18 18Title
5. Growth sectors – new auto, ridesharing & energy
• Traditional industries that have NOT
innovated will be disrupted.
• Externalising costs is NOT sustainable.
• Natural resource constraints and
environmental disruption risks are
NOT being evaluated appropriately.
• Distributed energy generation and
storage combined with autonomous
transportation will significantly lower
household energy and transport
costs.
Source: Tesla Inc. 19 19Title ridesharing & energy cont.
5. Growth sectors – new auto,
• Transition to sustainable energy and transport will create exponential growth for the
new disruptive, market leaders.
$19.9 Trillion Worth Of Industries To Be Disrupted* The Decline in Battery Prices^
Traditional Auto $1,200
Ride-sharing Market Market
$5,700,000,000,000 $3,100,000,000,000 $1,100
$1,000
$900
$800
$700
$/kWh
$600
$500
$400
Energy Market
$11,100,000,000,000 $300
$200
$100
$0
2010 2011 2012 2013 2014 2015 2016 2017 2018 2019
Battery Price
Source: *IBIS World, JP Morgan, Enerdata.net 2019 Yearbook, Hyperion
Source: ^BloombergNEF, Hyperion
Any projections contained are estimates only and may not be realised in the future.
20 20
.Title ridesharing & energy cont.
5. Growth sectors – new auto,
• Hyperion believes in the transition to a low carbon world and constructs
portfolios appropriately.
• Hyperion’s strategies have very low carbon intensity compared with the
relevant benchmark.
Portfolio Carbon Intensity (Scope 1 & 2)
Emissions (Tonnes) per U.S. Dollar of Revenue
250 t
200 t
150 t
100 t
50 t
0t
Hyperion Global MSCI World Index Hyperion Australian S&P/ASX 300 Index Hyperion Australian S&P/ASX Small
Growth Companies Growth Companies Small Growth Ordinaries Index
Fund Fund Companies Fund
Source: Hyperion, FactSet 21 215. Growth sectors – Title
align to structural themes
• Shift from traditional media to online/digital
• Shift from traditional retail to E-commerce
• Structural growth in demand for ultra luxury goods
• Ageing population
• Technology advancement and innovation
• Shift from cash to electronic payments
• Software moving from edge to core (of society and business)
• Digital transformation of the workplace (productivity)
• Serving the value conscious consumer
• Transition to sustainable energy and transport
22 225. EPS growth irrespective
Title of low GDP growth
• Lessons from GFC : Hyperion Small Growth strategy
• “Dotted green line” no meaningful fall from 2007 peak
900 • “Dotted blue line” well below 2007 peak after 13 years
Implied Hyperion Small Cap Composite EPS Index (rolling 3 months)
800
Hyperion Small Cap Capital Growth Index (rolling 3 months)
Small Ords Indexed to 100 in Oct-03 (rolling 3 months)
700
Small Ords EPS Index - Indexed to 100 in Oct-03 (rolling 3 months)
600
500
400
300
200
100
0
Sep 04
Feb 05
Jul 05
Jul 20
Sep 09
Feb 10
Jul 10
Sep 14
Feb 15
Jul 15
May 06
Sep 19
Feb 20
Dec 05
May 11
Apr 04
Dec 10
May 16
Apr 09
Dec 15
Oct 06
Mar 07
Aug 07
Jun 08
Apr 14
Nov 03
Jan 08
Oct 11
Mar 12
Aug 12
Jun 13
Nov 08
Jan 13
Oct 16
Mar 17
Aug 17
Jun 18
Apr 19
Nov 13
Jan 18
Nov 18
Source: Hyperion 235. EPS growth irrespective
Title of low GDP growth
• Early lessons : Hyperion Global Growth strategy
• “Dotted green line” compounding at high rates
• “Dotted blue line” rising but not at the same rates
330
Hyperion Global Growth Fund EPS Index (Forward) - Indexed from 100 in May-14 (rolling 3 months)
290 Hyperion Global Growth Composite Index (rolling 3 months)
MSCI World (Gross) AUD Index - Index to 100 in May-14 (rolling 3 months)
250 MSCI World (Gross) AUD Index EPS Index - Indexed to 100 in May-14 (rolling 3 months)
210
170
130
90
Jul 14
Sep 14
Jul 15
Sep 15
Jul 16
Sep 16
Jul 17
Sep 17
Jul 18
Sep 18
Jul 19
Sep 19
May 14
May 15
May 16
May 17
May 18
May 19
May 20
Mar 15
Mar 16
Mar 17
Mar 18
Mar 19
Mar 20
Nov 14
Jan 15
Nov 15
Jan 16
Nov 16
Jan 17
Nov 17
Jan 18
Nov 18
Jan 19
Nov 19
Jan 20
Source: Hyperion 246. Portfolio update – Global
Title VSG Attribution Analysis
Five years to 30 June 2020
Amazon.com, Inc.
PayPal Holdings Inc
Alphabet Inc. Class A
Facebook, Inc. Class A
Mastercard Incorporated Class A
REA Group Ltd
Visa Inc. Class A
Intuit Inc.
Domino's Pizza, Inc.
Costco Wholesale Corporation
Tesla Inc
Microsoft Corporation
Moncler SpA
Hermes International SCA
MarketAxess Holdings Inc.
Seek Limited
Booking Holdings Inc.
Cochlear Limited
Ramsay Health Care Limited
Wayfair, Inc. Class A
Pendal Group Limited
salesforce.com, inc.
ServiceNow, Inc.
Rightmove plc
Ferrari NV
eBay Inc.
Medidata Solutions, Inc.
Square, Inc. Class A
Kering SA
Domino's Pizza Group plc
Walt Disney Company
Christian Dior SE
U.S. Dollar
LVMH Moet Hennessy Louis Vuitton SE
Henderson Group PLC Shs Chess Depository Interests repr 1 Shs
Intuitive Surgical, Inc.
Domino's Pizza Enterprises Limited
Discovery, Inc. Class C
Discovery, Inc. Class A
Alibaba Group Holding Ltd. Sponsored ADR
CSL Limited
Starbucks Corporation
Compagnie Financiere Richemont SA
Burberry Group plc
Workday, Inc. Class A
Twenty-First Century Fox, Inc. Class B
Yum! Brands, Inc.
Tiffany & Co.
TripAdvisor, Inc.
Australian Dollar
Source: FactSet
-7.50 -5.00 -2.50 0.00 2.50 5.00 7.50 10.00 12.50 15.00
256. Portfolio update - Hyperion
Title Global VSG – 30 June 2020
Hyperion 5-year upside
capture: 136%
(outperforming in ~64%
of up markets)
Hyperion 5-year
downside capture: 76%
(outperforming in ~67%
of down markets)
Source: eVestment Alliance, Hyperion. Past performance is not a reliable indicator of future performance. Data as at 30th June 2020.
Benchmark: MSCI World Index DTR (Net) (USD). Source: Hyperion, MSCI. Inception date: 1st June 2014 – the date the composite strategy was first implemented. Refer
to pages 42-44 for Important Disclaimers.
26Title
6. Portfolio outlook in COVID-19 world?
Strong forecast EPS growth underpins the forecast 10 year IRR.
Hyperion Global
Hyperion Australian Hyperion Small Growth
Growth Companies
Growth Companies Fund Companies Fund
Fund
10-year projected EPS
29% p.a. 24% p.a. 28% p.a.
Growth
PE expansion (10 year) -14% p.a. -8% p.a. -8% p.a.
Dividend Return 1% p.a. 2% p.a. 0% p.a.
10-year projected IRR 16% p.a. 18% p.a. 20% p.a.
As at 30th June 2020. Forecasts are before fees.
Source: Hyperion.
Forecasts reflect the judgment and assumptions of Hyperion and its representatives on the basis of information at the date of publication and may later change without notice. 27Title
6. Portfolio update - Hyperion Net Fund Performance – 30 June 2020
$AUD Net Performance (%) Inception*
Inception* p.a. 5 Year p.a. 3 Year p.a. 1 Year
Total Return
Hyperion Global Growth Companies Fund
(Class B) 210.2% 20.4% 20.4% 23.9% 19.2%
MSCI World Index 101.5% 12.2% 9.9% 11.2% 5.4%
Excess Performance 108.7% 8.2% 10.5% 12.7% 13.8%
$AUD Net Performance (%) Inception^
Inception^ p.a. 10 Year p.a. 5 Year p.a. 3 Year p.a. 1 Year
Total Return
Hyperion Australian Growth
Companies Fund 622.4% 11.8% 11.3% 11.8% 12.7% 17.5%
S&P/ASX 300 Accumulation Index 322.9% 8.5% 7.7% 6.0% 5.2% -7.6%
Excess Performance 299.5% 3.3% 3.6% 5.8% 7.5% 25.1%
$AUD Net Performance (%) Inception^
Inception^ p.a. 10 Year p.a. 5 Year p.a. 3 Year p.a. 1 Year
Total Return
Hyperion Small Growth Companies
Fund 1124.5% 15.1% 14.0% 12.2% 13.0% 13.5%
S&P/ASX Small Ordinaries
Accumulation Index 212.0% 6.6% 4.6% 7.9% 6.1% -5.7%
Excess Performance 912.6% 8.5% 9.4% 4.4% 6.9% 19.2%
Past performance is not a reliable indicator of future performance.
*Hyperion Global Growth Companies Fund Inception Date: 1st June 2014
^Hyperion Australian Growth Companies Fund and Hyperion Small Growth Companies Fund Inception Date: 30th September 2002.
Source: Hyperion, FactSet. Data as at 30th June 2020. 28
Due to rounding, excess performance may not equate perfectly to the difference between the Hyperion fund and the respective index.QUESTIONS
29Research & Platform
Title
Availability
Hyperion Global Growth Hyperion Australian Growth Hyperion Small Growth
Companies Fund Companies Fund Companies Fund
Lonsec Highly Recommended Lonsec Highly Recommended Lonsec Highly Recommended
Research Morningstar Bronze Morningstar Silver Morningstar Silver
Zenith Recommended Zenith Recommended Zenith Recommended
AMP
ANZ
Asgard
Aegis
Ausmaq
Asgard
BT Panorama
Ausmaq
BT Wrap
BT Panorama AMP
CFS FirstWrap
BT Wrap Asgard
FNZ Group
CFS FirstWrap Ausmaq
Hillross
FNZ Group BT Wrap
HUB24
Platforms HUB24
IOOF
CFS First Wrap
Macquarie Wrap HUB 24
Linear Managed Accounts
M-funds Macquarie Wrap
Macquarie Wrap
MLC Navigator Netwealth
Mentor (Oasis Badge)
MLC Wrap PowerWrap
MLC Navigator
Netwealth
MLC Wrap
Praemium
Netwealth
Premium Choice
Praemium
Premium Choice
SimpleWrap
30 3
0APPENDIX
31Title
The Global Economy will be Soft for Years to Come
“The world faces a low-growth, low-inflation, low-
interest rate environment with headwinds
including ageing populations, high debt levels and a
disappearing middle class in Western economies.”
Mark Arnold, CIO
Hyperion Asset Management
32 3
2Lessons fromTitle
GFC and COVID-19
• Its all about earnings
Avoid recapitalisations
Avoid permanent loss of capital
Reduce earnings cyclicality
Carry higher cash levels as appropriate
Quality earnings return more quickly
Have a portfolio of modern businesses with low sensitivity to economic
conditions
33 33Global fee structureTitle
aligns with your clients
5 Year Total Return
Management Fee Performance Fee
Net Performance
Hyperion Global Growth Companies Fund
(Class B) 0.70% p.a. 20% p.a. 143.5%
Magellan Global Fund 1.35% p.a. 10% p.a. 76.5%
MFS Global Equity Trust 0.80% p.a. -- 54.1%
Platinum Unhedged Fund 1.35% p.a. -- 31.3%
T.Rowe Price Global Equity Fund 1.18% p.a. -- 95.9%
Hyperion backs its ability to produce outperformance
Returns are net of fees. Past performance is not a reliable indicator of future performance.
As at 30th June 2020. Source: Morningstar. 34Title
Hyperion Global Growth has strongly outperformed its “growth-style” peers since inception
Past performance is illustrative only and not a reliable indicator of future performance.
Source: Morningstar Direct.Title
Aggregate Ownership over time
170%
160%
150%
140%
Total Aggregate Ownership (%)
130%
120%
110%
100%
90%
80%
70%
Jul 12
Jul 13
Jul 14
Jul 15
Jul 16
Jul 17
Jul 18
Jul 19
Jul 20
Apr 12
Apr 13
Apr 14
Apr 15
Apr 16
Apr 17
Apr 18
Apr 19
Apr 20
Jan 12
Oct 12
Jan 13
Oct 13
Jan 14
Oct 14
Jan 15
Oct 15
Jan 16
Oct 16
Jan 17
Oct 17
Jan 18
Oct 18
Jan 19
Oct 19
Jan 20
• Portfolio Aggregate ownership has been steadily decreasing over the past 5 years and is at the lowest range since March 2013.
• Currently 5 substantial holdings, less than half the peak of 14 between May to Aug 2016 and below the 5-year average of 11.
As at 31st July 2020. 36
36Foresight Analytics
Title

Hyperion has a decisive and secular Growth and Quality bias which aligns with
                         our investment philosophy.                             38
Title
The Hyperion average monthly out-performance is much higher than average
monthly under performance during both up- and down-market environments.
39Title
It is important to add value from stock picking. Hyperion’s idiosyncratic
return is in the first decile of peer group over 3- and 5-year periods. In
addition, Asset Growth factor has helped performance. 40Title
On average, Hyperion’s active share relative to this group of managers is about 85%.
Such a high level of active share between Hyperion and its peers means our
investment approach is highly differentiated in the growth universe. 41Important Disclaimers
Title
Foresight Analytics- Unlocking your evidence-based investment advantage.
Foresight Analytics is a data-driven investment research, Analytics and consulting firm. Using its innovative 360-degree framework and factor-based technology, Foresight provides analytical,
predictive and market intelligence solutions to leading investment management companies, superannuation funds and wealth groups.
For asset owners, Foresight solutions include quality and risk based manager appraisal, forensic validation of manager skill, portfolio risk aggregation and factor based portfolio optimisation.
Foresight’s 360 degree analytical framework integrates financial and extra-financial considerations and across equity and bond asset classes.
Disclaimer
The material contained in this document is for general information purposes only. It is not intended as an offer or a solicitation for the purchase and/or sale of any security, derivative, index, or
financial instrument, nor is it an advice or a recommendation to enter into any transaction. No allowance has been made for transaction costs or management fees, which would reduce
investment performance. Actual results may differ from reported performance. Past performance is no guarantee for future performance.
This material is based on information that is considered to be reliable, but Foresight Analytics make this information available on an “as is” basis without a duty to update, make warranties,
express or implied, regarding the accuracy of the information contained herein. The information contained in this material should not be acted upon without obtaining advice from a licensed
professional. Errors may exist in data acquired from third party vendors, the construction of model portfolios, and in coding related to statistical tests.
Foresight Analytics disclaims any and all express or implied warranties, including, but not limited to, any warranties of merchantability, suitability or fitness for a particular purpose or use. This
communication reflects our analysts’ opinions as of the date of this communication and will not necessarily be updated as views or information change. All opinions expressed herein are subject
to change without notice.
42Title Disclaimers
Lonsec & Zenith
Zenith
The Zenith Investment Partners (‘Zenith’) Australian Financial Services License No. 226872 rating (Hyperion Global Growth
Companies Fund rating issued November 2018) referred to in this document is limited to “General Advice” (as defined by the
Corporations Act 2001) for wholesale clients only. This advice has been prepared without taking into account the objectives,
financial situation or needs of any individual. It is not a specific recommendation to purchase, sell or hold the relevant
product(s). Investors should seek independent financial advice before making an investment decision and should consider the
appropriateness of this advice in light of their own objectives, financial situation and needs. Investors should obtain a copy of,
and consider, the PDS or offer document before making any decision and refer to the full Zenith Product Assessment available
on the Zenith website. Zenith usually charges the product issuer, fund manager or a related party to conduct Product
Assessments. Full details regarding Zenith’s methodology, ratings definitions and regulatory compliance are available on
Zenith’s Product Assessments and at http://www.zenithpartners.com.au/RegulatoryGuidelines.
Lonsec
The Lonsec Ratings (assigned as follows: Hyperion Global Growth Companies Fund, October 2019) presented in this
document are published by Lonsec Research Pty Ltd ABN 11 151 658 561 AFSL 421445. The Ratings are limited to “General
Advice” (as defined in the Corporations Act 2001 (Cth)) and based solely on consideration of the investment merits of the
financial products. Past performance information is for illustrative purposes only and is not indicative of future performance.
They are not a recommendation to purchase, sell or hold Hyperion Asset Management products, and you should seek
independent financial advice before investing in these products. The Ratings are subject to change without notice and Lonsec
assumes no obligation to update the relevant documents following publication. Lonsec receives a fee from the Fund Manager
for researching the products using comprehensive and objective criteria.
For further information regarding Lonsec’s Ratings methodology, please refer to Lonsec’s website at:
https://www.lonsecresearch.com.au/research-solutions/our-ratings.
43MORE INFORMATION Title
Client Services 1 300 497 374
clientservices@hyperion.com.au
www.hyperion.com.au
DISCLAIMER:
This communication is not a securities recommendation. Any person considering action on the basis of this communication must seek individual advice relevant to their particular
circumstances and investment objectives. Past performance is no guide to future performance.
This communication was prepared for financial advisors and wholesale investor only. Retail investors should not rely on any information in this document without first seeking advice from
their financial adviser.
This presentation has been prepared by Hyperion Asset Management Limited (‘Hyperion’), ABN 80 080 135 897, AFSL 238380.
This presentation is for general information purposes only. It has been prepared without taking account of any person’s objectives, financial situation or needs. Any persons relying on this
information should obtain professional advice before doing so. The information is not intended as a securities recommendation or statement of opinion intended to influence a person or
persons in making a decision in relation to investment.
Interests in the Hyperion Global Growth Fund (ARSN 611 084 229) , the Hyperion Australian Growth Companies Fund (ARSN 089 548 443) and the Hyperion Small Growth Companies fund
(ARSN 089 548 943) (‘Funds’) are issued by Pinnacle Fund Services Limited (Pinnacle) AFSL 238371 ABN 29 082 494 as Responsible Entity of the Funds. Pinnacle is not licensed to provide
financial product advice. Please consult your financial adviser before making a decision. Please read the recent Product Disclosure Statement available
at http://www.hyperion.com.au/app-products for each Fund in its entirety before making an investment decision.
Hyperion and Pinnacle believes the information contained in this presentation is reliable, however no warranty is given as to its accuracy and persons relying on this information do so at
their own risk. Any opinions or forecasts reflect the judgment and assumptions of Hyperion and its representatives on the basis of information at the date of publication and may later
change without notice. Any projections contained in this presentation are estimates only and may not be realised in the future. Returns from investments may fluctuate and that past
performance is not a reliable indicator of future performance. To the extent permitted by law, Hyperion and Pinnacle disclaim all liability to any person relying on the information in respect
of any loss or damage (including consequential loss or damage) however caused, which may be suffered or arise directly or indirectly in respect of such information contained in this
presentation
The information contained in this presentation is not to be disclosed in whole or part or used by any other party without the prior written consent of Hyperion. Unauthorised use, copying,
distribution, replication, posting, transmitting, publication, display, or reproduction in whole or in part of the information contained in this presentation is prohibited without obtaining
prior written permission from Hyperion. This presentation may contain the trade names or trademarks of various third parties, and if so, any such use is solely for illustrative purposes only.
All product and company names are trademarks™ or registered® trademarks of their respective holders. Use of them does not imply any affiliation with, endorsement by, or association of
any kind between them and Hyperion
© 2020 Morningstar, Inc. All rights reserved. Neither Morningstar, its affiliates, nor the content providers guarantee the data or content contained herein to be accurate, complete or
timely nor will they have any liability for its use or distribution. Any general advice or ‘class service’ have been prepared by Morningstar Australasia Pty Ltd (ABN: 95 090 665 544, AFSL:
240892) and/or Morningstar Research Ltd, subsidiaries of Morningstar, Inc, without reference to your objectives, financial situation or needs. Refer to Morningstar Financial Services Guide
(FSG) for more information at www.morningstar.com.au/s/fsg.pdf. You should consider the advice in light of these matters and if applicable, the relevant Product Disclosure Statement
(Australian products) or Investment Statement (New Zealand products) before making any decision to invest. Morningstar publications, ratings and products should be viewed as an
additional investment resource, not as your sole source of information. Past performance is for illustrative purposes only and is not indicative of future performance. To obtain advice
tailored to your situation, contact a professional financial adviser. Some material is copyright and published under licence from ASX Operations Pty Ltd ACN 004 523 782 ("ASXO")
44You can also read