GIS DATA DICTIONNARY Level of information: Layer and attribute table - VERSION 5.0 - Cirad
←
→
Page content transcription
If your browser does not render page correctly, please read the page content below
Paracou Forest Research Station
               French Guiana

                                  GIS DATA DICTIONNARY
                                        VERSION 5.0

                                    Level of information:
                                  Layer and attribute table

A.Dourdain (UMR EcoFoG - CIRAD)                         March 2020
Geographic platform of Paracou
Summary
Paracou research station is a large scale forest disturbance experiment set up by Cirad in 1984 that has become over time a unique research site for the international
scientific community in tropical forest ecology. This geographical online portal provides access to a broad collection of environmental and biodiversity datasets on Paracou.
This data dictionary covers all information in our possession. Here you will find an overview of metadata on spatial data related to:
- data sources and contacts (see Appendix 4);
- access rights;
- data description;
- geometric accuracy;
Some spatial layers are downloadable online (GeoJson format) and can be used with QuantumGIS1;
Paracou is part of Guyafor network: permanent plots dedicated to long term studies about forest dynamics and biodiversity.
Scientific coordinator: Dr Géraldine Derroire
Cirad – Unité Mixte de Recherche Ecologie des Forêts de Guyane
Geraldine.Derroire@cirad.fr
Technical coordinator, project manager and GIS specialist: Aurélie Dourdain
Cirad – Unité Mixte de Recherche Ecologie des Forêts de Guyane
Aurelie.Dourdain@ecofog.gf
Data manager: Dr Gaëlle Jaouen
AgroParisTech - Unité Mixte de Recherche Ecologie des Forêts de Guyane
Gaelle.Jaouen@ecofog.gf
Web developer: Elie guedj
Cirad – Unité Mixte de Recherche Ecologie des Forêts de Guyane
Paracou research station: https://paracou.cirad.fr/
Unité Mixte de Recherche Ecologie des Forêts de Guyane: http://www.ecofog.gf/
Cirad: https://www.cirad.fr/en/home-page
Projection: EPSG: 3857
Spatial extent: -5900718.8495098, 584319.5880102, -5883349.0348307, 593614.25165248
1
https://qgis.org
A.Dourdain (UMR EcoFoG - CIRAD) March 2020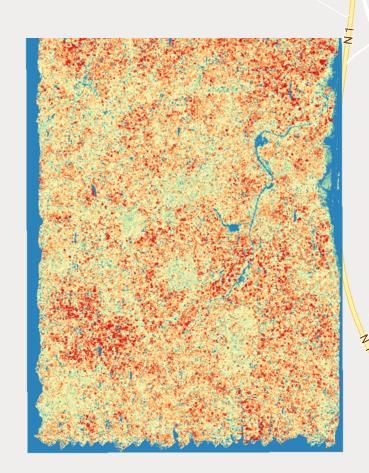
TOPIC: GEO units
Source: CIRAD, team “Forest” - Dourdain, A., 2017 Projection: EPSG: 32622 – WGS 1984 UTM 22N
Right to use: Open data Reference contact: Dourdain, A. – CIRAD, UMR EcoFoG
Geographical Entity
Name Summary Spatial Illustration
Quantity
format
This spatial layer shows the
boundaries of the CIRAD concession
on Guyanese Space Center land in
Sinnamary. The station is located in
the coastal part of French Guiana,
approximately 50 km NW of the
taCIRADConcession.shp European Space Center of Kourou.
POLYGON 1
The site is part of a private domain of
about 40,000ha, owned by the Centre
National d'Etudes Spatiales, granted
to Cirad.
➢ Attribute Table
Variable name Type Description Attributes of the variable
idConc Integer Unique identifier object 1
NameConc Varchar Name of the concession CIRADConcession
Geom Geometry Geometry of the object POLYGON
A.Dourdain (UMR EcoFoG - CIRAD) March 2020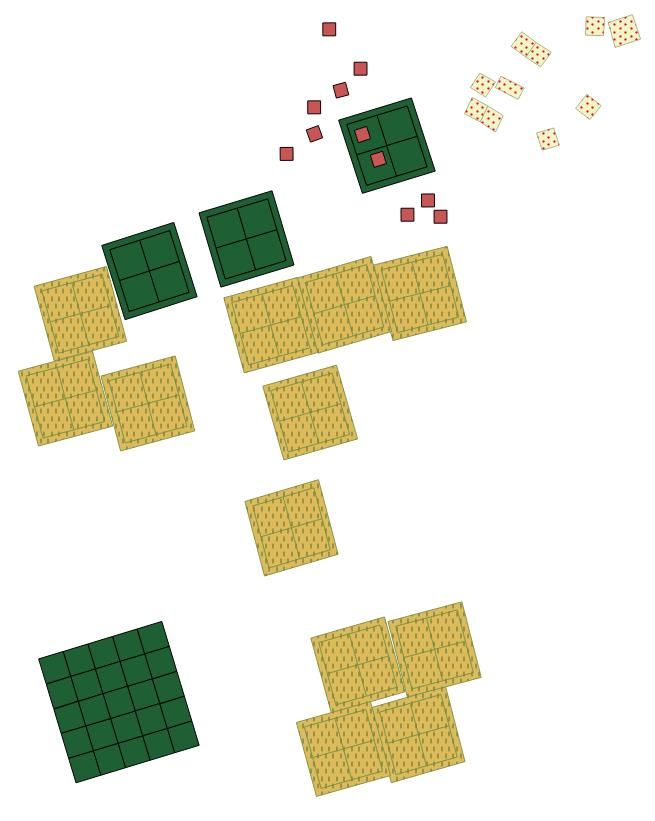
Source: INRA Monpied, P., 1992- Jounieaux, M., 2016 Projection: EPSG: 32622 – WGS 1984 UTM 22N
Right to use: Under conditions Referent contact: Traissac, S. – AgroParisTech, UMR EcoFoG
Geographical Entity
Name Summary Spatial Illustration
Quantity
format
This spatial layer shows the natural
regeneration plots for trees < 10cm DBH2 at
Paracou experimental station. Inside each of
the 12 plots of 6.25ha, 64 circular plots of 4m
radius were delineated. Distance between
circular plots is 20 m, and there is a distance of
55m between outer circular plots and the
edges of the 6.25ha. Eight censuses of 25 tree
species have been carried out in these circular
plots since 1992: 1992, 1993, 1995, 2002,
2005, 2008, 2013 and 2016. The 25 selected
species correspond to a set of tropical tree
species of interest for both potential
exploitation and impact on overall ecosystem
taRegenerationPlots.shp dynamics: Dicorynia guianensis (Fabaceae),
POINT 1535
Bocoa prouacensis (Fabaceae), Carapa
surinamensis (Meliaceae), Tachigali melinonii
(Fabaceae), Eperua falcata (Fabaceae), Eperua
grandiflora (Fabaceae), Goupia glabra
(Goupiaceae), Qualea rosea (Vochysiaceae),
Sextonia rubra (Lauraceae), Jacaranda copaia
(Bignoniaceae), Pradosia cochlearia
(Sapotaceae), Sterculia pruriens (Malvaceae),
Sterculia multiovula (Malvaceae), Moronobea
coccinea (Clusiaceae), Platonia insignis
(Clusiaceae), Schefflera decaphylla
(Araliaceae), Symphonia globulifera
(Clusiaceae), Andira coriacea (Fabaceae),
2
DBH= Diameter at Breast Height, 1.30m
A.Dourdain (UMR EcoFoG - CIRAD) March 2020
Symphonia sp. 1 (Clusiaceae), Iryanthera
                               hostmannii (Myristicaceae), Iryanthera
                              sagotiana (Myristicaceae), Vouacapoua
                                americana (Fabaceae), Recordoxylon
                                speciosum (Fabaceae), Virola michelii
                                 (Myristicaceae), Virola surinamensis
                                            (Myristicaceae).
                           This spatial layer gives the choice between the
                           representation of absolute coordinates (taken
                            using GIS software) and relative coordinates
                            (taken using GPS) of the center of the plots.

➢ Attribute Table

Variable name                Type                                  Description          Attributes of the variable
    idReg                   Integer          Unique identifier object                              1-1535
                                                                                        absolute coordinates and
   TypeReg                  Varchar          Type of visualization
                                                                                           relative coordinates
     Plot                   Integer          Number or name of plot                                    -
    idPlot                  Integer          Unique plot identifier (Guyafor network)                  -
   Column                   Integer          Plot column number                           0, 3, 4, 5, 6, 7, 8, 9, 10
     Line                   Integer          Plot line number                             0, 3, 4, 5, 6, 7, 8, 9, 10
    Geom                   Geometry          Geometry object                                       POINT

A.Dourdain (UMR EcoFoG - CIRAD)                                                                                        March 2020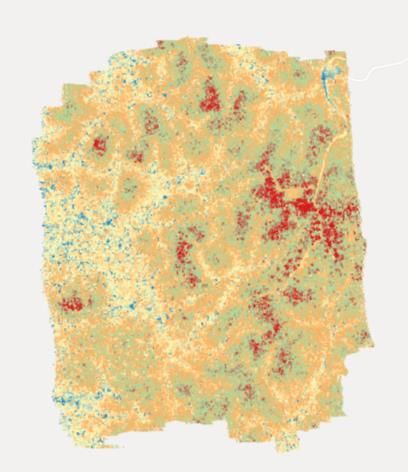
Source: CIRAD, team “Forest” - Petronelli, P., 19XX Projection: EPSG: 32622 – WGS 1984 UTM 22N
Right to use: Open data Referent contact: Petronelli, P. – CIRAD, UMR EcoFoG
Geographical Entity
Name Summary Spatial Illustration
Number
format
This spatial layer shows the boundaries of the
plots, subplots and buffer zones (25m) at
Paracou research station.
The boundaries of plots have been positioned
with topographical survey instruments
(compass, clinometer, measuring tape).
There are different experiments/plots:
Disturbance experiment: In 1984, the Cirad
team set up 12 square 9ha plots, among
which 9 were subjected to logging induced
disturbances in 1986-1988.
Guyaflux plots: Guyaflux tower and plots
have been generating data since 2003 to
determine the ecosystem CO2 source or
sink strengths.
taOverallPlots.shp The eddy covariance system is used to POLYGON 122
measure gas fluxes in real time in situ.
Continuing monitoring has been carried out
since 2003 to analyze the impact of
changing climate to ecosystem carbon
balance. Guyaflux is managed by INRA.
Biodiversity plots: In 1990-1992, four new
plots (3 * 6.25ha + 1 * 25ha) were set up
for biodiversity monitoring. No destructive
samplings have been authorized at all in
these plots.
Fertilization plots: In 2015, 12 new 50*50m
plots were set up to test the effect of
nutrient enrichment on ecosystem
processes.
A.Dourdain (UMR EcoFoG - CIRAD) March 2020
➢ Attribute Table

Variable name             Type                                 Description                                           Attributes of the variable
  idAllPlot              Integer   Unique identifier object                                                                     1-122
     Plot                varchar   Number or name of plot                                                                1 - 16 ImbXX, GfxX
    idPlot               Integer   Unique plot identifier (Guyafor network)                                                        -
                                                                                                               BiodiversityPlots, DisturbancesPlots,
  TypePlot               varchar   Type of plot (4 attributes)
                                                                                                                    FertilizationPlots, Guyaflux
                                                                                                           Bottom, Slope, Top, T0: control, T1: selective
                                   Applied silvicultural treatment or type of topography (7 modalities)    logging, T2: selective logging + Timber Stand
 Treatment               varchar
                                   See Appendix 2                                                         Improvement (TSI), T3: selective logging + TSI +
                                                                                                                              fuelwood
   Subplot               Integer   Subplot number or name                                                                          -
  idSubplot              Integer   Unique subplot identifier (Guyafor network)                                                     -
                                                                                                                SubplotsP16, Subplots, PlotsImbP,
  TypeSub                varchar   Type of polygon (5 attributes)
                                                                                                                     PlotsGuyaflux, Buffer25m
   Geom                 Geometry   Geometry object                                                                           POLYGONE

A.Dourdain (UMR EcoFoG - CIRAD)                                                                                                             March 2020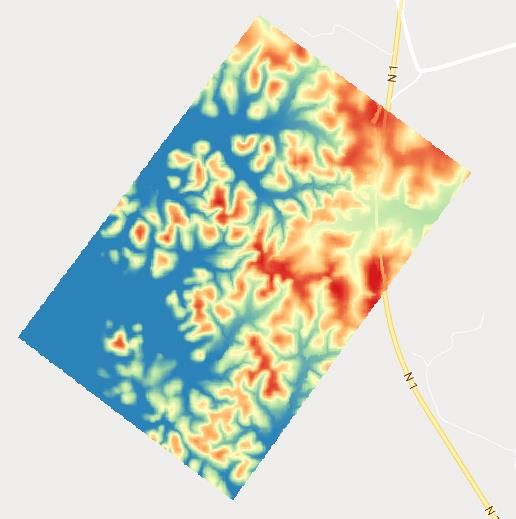
TOPIC: INFRASTRUCTURES
Source: CIRAD forest team - Dourdain, A., 2016 Projection: EPSG: 32622 – WGS 1984 UTM 22N
Right to use: Open data Referent contact: Dourdain, A. – CIRAD, UMR EcoFoG
Geographical Entity
Name Summary Illustration
Spatial format Number
This spatial layer shows the
points locating the
infrastructure (open
taFacilities.shp shelter, Guyaflux tower,
POINT 3
weather station) at
Paracou.
➢ Attribute Table
Variable name Type Description Attributes of the variable
idFacility Integer Unique identifier object 3
NameFacility varchar Name object (3 attributes) BaseCamp, GuyafluxTower, Agroclim
Geom Geometry Geometry object POINT
A.Dourdain (UMR EcoFoG - CIRAD) March 2020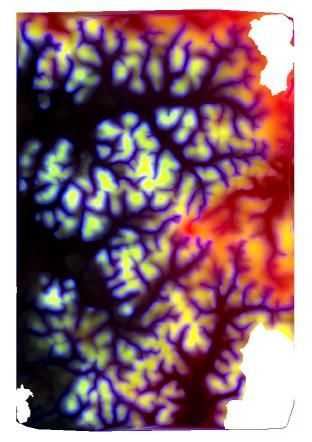
Source: CIRAD forest team - Petronelli, P., 19XX Projection: EPSG: 32622 – WGS 1984 UTM 22N
Right to use: Open data Referent contact: Petronelli, P. – CIRAD, UMR EcoFoG
Geographical Entity
Name Summary Illustration
Spatial format Number
This spatial layer illustrates
the main access road to
the station, and the tracks
around the entire
perimeters of the plots.
The tracks around plots
taRoadPaths.shp were positioned with
LINESTRING 49
topographical survey
instruments (compass,
clinometer, measuring
tape) in 1996 by a
surveyor.
Attribute Table
Variable name Type Description Attributes of the variable
idRoad Integer Unique identifier object 49
TypeRoad varchar Name object Main road, Plot Path, Forest path
Geom Geometry Geometry object LINESTRING
A.Dourdain (UMR EcoFoG - CIRAD) March 2020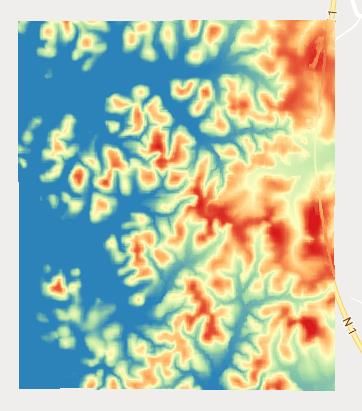
TOPIC: Inventory
All publications using Paracou tree census data must cite the database as follow: “Guyafor, DataBase of the French Guyana Permanent Plot Network, Cirad-CNRS-ONF,
http://www.ecofog.gf/spip.php?article364”
Source: UMR EcoFog, 2017 Projection: EPSG: 32622 – WGS 1984 UTM 22N
Right to use: Under Conditions Referent contact: Jaouen, G. – AgroParisTech, UMR EcoFoG
Geographical Entity
Name Summary Illustration
Spatial format Number
This spatial layer shows
the latest tree
circumference inventory
talastinventory.shp conducted at Paracou in POINT 84 199
2018. Either relative or
absolute coordinates can
be selected.
➢ Attribute Table
Variable Name on the Variable Name (in Attributes of the
Type Description
Website the exported file) variable
Forest Forest Text Forest name Paracou
Plot Plot Numeric Plot number (see Appendix 1) 1 to 16
1 to 4 (except plot 16: 1
Subplot Subplot Numeric Subplot number (see Appendix 1)
to 25)
Tree Field number TreeFieldNum Numeric Tree number within the subplot (matching the tag number in the field). NB: -
A.Dourdain (UMR EcoFoG - CIRAD) March 2020Several trees from different plots can have the same TreeFieldNum.
Plot area PlotArea Numeric Plot area (hectare) -
Tree id idTree Numeric Unique tree identifier from the database -
Euclidean position (X in m) of the tree relative to the Southwestern corner of the 0 to 250m (except in plot
X field Xfield Numeric
subplot 16, 0 to 100m)
Euclidean position (Y in m) of the tree relative to the Southwestern corner of the 0 to 250m (except in plot
Y field Yfield Numeric
subplot 16, 0 to 100m)
X UTM (Zone 22) Xutm Numeric Coordinate X for the tree in UTM 22 N (EPSG : 32 622) -
Y UTM (Zone 22) Yutm Numeric Coordinate Y for the tree in UTM 22 N (EPSG : 32 622) -
Latitude Lat Numeric Tree latitude (WGS 84, EPSG : 4326) -
Longitude Lon Numeric Tree longitude (WGS 84, EPSG : 4326) -
Vern id idVern Numeric Unique vernacular identifier from the database -
Text
Vern name VernName Vernacular name -
Circumference (cm) of the tree at 1.30m above ground (DBH3 level)
Circumference Circ Numeric -
Corrected Corrected circumference (cm)
CircCorr Numeric See table 2
Circumference (mathematical correction of abnormal circumferences)
Information on the reason why and how the circumference has been corrected,
Corrected Code CorrCode Text 0 to 6 (see Table 2)
multiple values are possible
Status CodeAlive Logical Is the tree alive (1) or dead (0)? 1/0
Information on the method for measuring the circumference or on the state of
Measure code MeasCode Numeric 0 to 12 (see Table 1)
the tree
Year of census CensusYear Numeric Census year 1984 to last census
Census date CensusDate Date Census Day (when available) -
Is the CensusDate precise (1) or not (0)? If 0, this information must not be
Census date certainty CensusDateCertainty Logical 1/0
considered for calculation
Text
Family Family Botanical family -
Text
Genus Genus Botanical genus -
Text
Species Species Botanical species -
Botanical source BotaSource Text Source of botanical name Vern / Bota (see table 3)
3
DBH= Diameter at Breast Height, 1.30m
A.Dourdain (UMR EcoFoG - CIRAD) March 2020Safety index BotaCertainty Numeric Level of certainty for the botanical identification 1 to 4 (see table 3)
Is the tree considered as a commercial species according to the list of species
Commercial Species CommercialSp Logical 1/0
that were logged during the sylvicultural treatment in Paracou (1) or not (0) ?
Inventory – Table 1 - Tree Status
CodeAlive MeasCode Description
1 (alive) 0 Circumference (cm) of the tree measured at 1.30m (DBH) or above buttresses
1 (alive) 1 Height of circumference measurement elevated by 0.5m from the last measurement
1 (alive) 2 Height of circumference measurement elevated by 1m from the last measurement
1 (alive) 3 Height of circumference measurement elevated by 1.5m or more from the last measurement
1 (alive) 4 Tree with irregular trunk for which the circumference is estimated
1 (alive) 7 Tree damaged by logging (see Appendix 1)
1 (alive) 9 Poisoned tree as part of the stand improvement treatment (see Appendix 1)
1 (alive) 10 Circumference measured with a ladder
1 (alive) 11 Natural damage
1 (alive) 12 Tree lying but alive
CodeAlive MeasCode Description
0 (dead) 0 Standing dead tree (natural death)
0 (dead) 1 Standing dead tree following forest treatment (see Appendix 1)
0 (dead) 4 Tree logged and commercially exploited (see Appendix 1)
0 (dead) 5 Destroyed tree by forest work (forest tracks, skidding…)
0 (dead) 6 Natural death: fallen (primary treefall)
0 (dead) 7 Natural death: fallen because of another tree (secondary treefall)
0 (dead) 8 Destroyed tree by logging, breakage or poisoning but not commercially exploited
0 (dead) 9 Death following poisoning (see Appendix 1)
0 (dead) 11 Death following natural damage
A.Dourdain (UMR EcoFoG - CIRAD) March 2020 Inventory – Table 2 – Corrected circumferences
CorrCode Description
0 No correction (Circ=CircCorr)
Annual growth (in diameter) > 5cm, anomaly observed for only one or a few censuses, followed to the normal
1
growth trajectory: circumference realigned by linear regression
Annual growth (in diameter) > 5cm, abrupt change in the growth trajectories without return to the previous
2
trajectory: the shortest (or more recent if equal length) serie is realigned with the longest
Annual decrease in diamater > 2cm, anomaly observed for only one or a few censuses, followed to the
3
normal growth trajectory: circumference realigned by linear regression
Annual decrease > 2cm, , abrupt change in the growth trajectories without return to the previous trajectory:
4
the shortest (or more recent if equal length) serie is realigned with the longest
Correction of Nogueira for Cathedral wood (Fabaceae swartzia polyphylla) : dbh x 0.53. Correction applied on
5 the already corrected circumference (CodeCorr is then x + 5, where x is the CodeCorr corresponding to the
first correction) (Nogueira (2005) 4)
Very large trees that have not been measured: the empirical maximum circumference is used:
80 * pi() : for kimboto, maho cigare, diagidia, buguni, yayamadou marécage, supun udu ;
6
50 * pi() : for weti udu, lebi koko, yayamadou montagne, wapa rivière, weti koko, ;
55 * pi() : for patawa ;
Inventory – Table 3 – Botanical determination
Code Attributes Description
BotaSource Bota Tree identified by a botanist
BotaSource Vern Botanical name of tree obtained from the vernacular name5
BotaCertainty -1 No attempt of determination by a botanist
BotaCertainty 0 Indeterminate botanical family (after attempt of determination by a botanist)
BotaCertainty 1 Indeterminate botanical genus (after attempt of determination by a botanist)
BotaCertainty 2 Indeterminate botanical species (after attempt of determination by a botanist)
BotaCertainty 3 Temporary identification (the botanist is waiting for a confirmation of the name)
BotaCertainty 4 Confirmed identification
4
Nogueira, E.M., Nelson, B.W., Fearnside, P.M., 2005, «Wood density in dense forest in Central Amazonia, Brazil », For. Ecol. Manag. 208, 261–286.
5
A matrix of correspondences has been established between vernacular names and the most likely scientific names, according to different studies and sources.
A.Dourdain (UMR EcoFoG - CIRAD) March 2020TOPIC: Hydrography / Topography
Source: Unknown, 1983-1984 Projection: EPSG: 32622 – WGS 1984 UTM 22N
Right to use: Open data Referent contact: Petronelli, P. – CIRAD, UMR EcoFoG
Geographical Entity
Name Summary Illustration
Spatial format Number
This spatial layer shows the
taCreek.shp various creeks for plot 1 to 12 LINESTRING 46
in Paracou.
➢ Attribute Table
Variable name Type Description Attributes of the variable
idCreek Integer A unique identifier object 1 - 46
idPlot Integer Unique plot identifier (Guyafor network) -
Plot Integer Number or name of plot -
Geom Geometry Geometry object LINESTRING
A.Dourdain (UMR EcoFoG - CIRAD) March 2020 Source: F.Morneau (2007) + Ferry, B., Morneau, F., Bontemps, J.D., Projection: EPSG: 32622 – WGS 1984 UTM 22N
Blanc, L. & Freycon, V., 2010. “Higher treefall rates on slopes and
waterlogged soils.
Right to use: Open data Referent contact: Ferry, B. - AgroParisTech
Geographical Entity
Name Summary Spatial Number Illustration
format
This spatial layer shows a topographic
survey of Paracou that was carried
out at its inception. Three general
terrain types were established
according to altitude and slope.
taTopographicLevels.shp Plateau: highest relative altitude and
POLYGON 52
low to 0 incline. Slope: medium to
strong incline. Low zone: low altitude,
generally less than 10m, and low to
zero slope.
➢ Attribute Table
Variable name Type Description Attributes of the variable
idTopo Integer Unique identifier object 1 - 52
Plot Integer Number or name of plot -
idPlot Integer Unique plot identifier (Guyafor network) -
TypeTopo Varchar Topographic type in french (3 attributes) Bas-fond, Pente, Plateau
TypeTopoEN Varchar Topographic type in english (3 attributes) Bottomland, Slope, Plateau
Geom Geometry Geometry object POLYGONE
A.Dourdain (UMR EcoFoG - CIRAD) March 2020 Source: CIRAD team “Forest” - Petronelli, P., 1983-84 Projection: EPSG: 32622 – WGS 1984 UTM 22N
Right to use: Open data Referent contact: Petronelli, P. – CIRAD, UMR EcoFoG
Geographical Entity
Name Summary Spatial Illustration
Number
format
This cartographic layer includes curves of levels,
equidistant of 2,5 m, which have been calculated from
sides points at 1 per are. Each curve is characterized by
its relative altitude with respect to the lowest point of
the plot. The topographical survey was made to install
the device and was based on: a survey of the perimeter
taAltitude.shp of the plots; installing strips of 10 m wide, limited to the POINT 1026
cords and oriented NS. The strips were subdivided into
squares every 10 m, which create a mesh of 10*10 m;
readings at clinometer, measure stalled in the NE corner
of each mesh. The cartographic support used is the GIS
base map of Paracou (CIRAD -Forest) at a scale of about
1/500.
➢ Attribute Table
Attributes of the
Variable name Type Description
variable
idAltitude Integer A unique identifier object 1 - 1026
Xutm Double Longitude: geographic and projected coordinates (in meters) ( projection : WGS84, UTM22N ) 28 5015 - 28 7606
Yutm Double Latitude: geographic and projected coordinates (in meters) ( projection : WGS84, UTM22N ) 581 174 – 584 074
Altitude Double Elevation 2.60 – 39 m
Geom Geometry Geometry object POINT
A.Dourdain (UMR EcoFoG - CIRAD) March 2020TOPIC: Pedology
Since the creation of Paracou, ecologists have regularly expressed the need for a soil map of the site. Soils are known to have a role in forest dynamics and / or
species distribution (Paoli et al., 2006, Baribault et al., 2012). The soil map was begun in 1991 and completed in 2012 (Appendix 3). However, to date, no synthesis or
reference article has been written on this soil mapping, unlike other tropical forest systems of French Guiana (the Piste de St Elie (Sabatier et al., 1997)).
There were several internships about the creation of the Paracou soil map: (i) soil mapping in the field to delineate soil units according to the type of drainage; (ii) soil
sampling for physio-chemical analysis; (iii) digitization of this soil mapping within the Paracou Geographic Information System (GIS).
Source: Soucemarianadin, L., 2004, Weigel, J., 2006, Projection: EPSG: 32622 – WGS 1984 UTM 22N
2009, Roelens, J.B., 2007
Right to use: Open data Referent contact: Freycon, V. - CIRAD
Geographical Entity
Name Summary Spatial Illustration
Number
format
This spatial layer shows the
different types of drainage
according to IRD
taDrainages.shp classification (Sabatier et al.
POLYGON 195
1997) for plots 1 to 15. This
map is the third version.
A.Dourdain (UMR EcoFoG - CIRAD) March 2020➢ Attribute Table
Attributes of the
Variable name Type Description
variable
idDrainage Integer Unique identifier object 1 - 195
Type of drainage : 6 attributes Alt, DhS, DVD,
TypeDrainage Varchar
Alt : Slow vertical drainage ; SH, SLD, UhS
SLD: Superficial Lateral Drainage ;
DVD: Deep Vertical drainage ;
TypeDrainageEN Varchar UhS: Uphill System ;
DhS: Downhill System ;
SH: hydromorph soil
idPlot Integer Unique plot identifier (Guyafor network) -
Plot Integer Number or name of plot -
Geom Geometry Geometry object POLYGON
Alt: Slow vertical drainage: the appearance of this soil is characterized by a silty red alloterite to a depth greater than 1.2m. This is a transitional soil between DVD
and SLD soil types. Water circulation is slow and always vertical. It can be found at the top of low slopes.
DLS or SLD: Superficial Lateral Drainage: the appearance of this soil is characterized by silty alloterite to a depth of less than 1.2m. The alloterite characteristically
seems ‘dry to the touch’. Water circulation is lateral.
DVL or DVD: Deep Vertical Drainage: This soil is characterized by a thick horizon (greater than 2 m) by red clay, with microaggregated structure, ensuring good
infiltration and water retention. Rainwater seeps vertically and deeply; This soil corresponds to the initial ferralitic cover.
SAm or UhS: Uphill hydromorphic system: in these soils, the dark red horizon of the alloterite becomes pale red. This system has a perched water table that
generally corresponds to a top layer that promotes the accumulation of water, inducing hydromorphic conditions.
SAv or DhS: Downhill hydromorphic system: this soil is characterized by the appearance of a mottled horizon less than 1.2 m deep. It is a ‘à battement’ water table
system found at the bases of slopes, near the permanent water table of lowlands.
SH or HS: Lowland Hydromorphic Soils: this soil is characterized by a gray and often sandy surface horizon. It corresponds more or less to lowlands.
A.Dourdain (UMR EcoFoG - CIRAD) March 2020 Source: Soucemarianadin, L., 2004, Weigel, J., 2006, Projection: EPSG: 32622 – WGS 1984 UTM 22N
2009, Roelens, J.B., 2007
Right to use: Open data Referent contact: Freycon, V. - CIRAD
Geographical Entity
Name Summary Spatial Illustration
Number
format
This spatial layer shows the
spatial distribution of coarse
taCoarseElements
material (duricrust, remnant POLYGON 59
.shp of rock,pegmatite) and
saprolite.
➢ Attribute Table
Variable name Type Description Attributes of the variable
idElement Integer A unique identifier object 1-59
Lithorelique
TypeElement varchar Type of coarse elements in French: 3 attributes Pegmatite
Saprolite
duricrust / Remnant of rock
TypeElementEN varchar Type of coarse elements in English: 3 attributes Pegmatite
Saprolite
idPlot Integer Unique plot identifier (Guyafor network) -
plot Integer Number or name of plot -
Geom Geometry Geometry object POLYGONE
A.Dourdain (UMR EcoFoG - CIRAD) March 2020 Source: Soucemarianadin, L., 2004, Weigel, J., 2006, 2009, Roelens, J.B., 2007 Projection: EPSG: 32622 – WGS 1984 UTM 22N
Right to use: Open data Referent contact: Freycon, V. - CIRAD
Geographical Entity
Name Summary Spatial Illustration
Number
format
This spatial layer shows
thalwegs and Djougoungs-Pétés
(Extension of small circular
taThalwegs.shp depressions and temporarily
POLYGONE 18
waterlogged), (Blancaneaux
1973).
➢ Attribute Table
Variable name Type Description Attributes of the variable
idThalweg Integer Unique identifier object 1-18
varchar Topographic type (2 attributes and no English translation for Djougoung Pété Thalweg
TypeThalweg
(Saramaka language) Djougoung Pété
idPlot Integer Unique plot identifier (Guyafor network) -
Plot Integer Number or name of plot -
Geom Geometry Geometry object POLYGONE
A.Dourdain (UMR EcoFoG - CIRAD) March 2020 Source: Soucemarianadin, L., 2004, Weigel, J., 2006, Projection: EPSG: 32622 – WGS 1984 UTM 22N
2009, Roelens, J.B., 2007
Right to use: Open data Referent contact: Freycon, V. - CIRAD
Geographical Entity
Name Summary Illustration
Spatial format Number
This spatial layer
represents specific soils:
taSpecificSoils.shp Colluviosol orSoil with
POLYGON 18
quartz
➢ Attribute Table
Variable name Type Description Attributes of the variable
idSpecSoil Integer Unique identifier object 1-18
Soil contribution,
TypeSpecSoil varchar Type of specific soil in French: 2 attributes
Soil quartz
Colluviosol,
TypeSpecSoilEN varchar Type of specific soil in English: 2 attributes
Soil with quartz
idPlot Integer Unique plot identifier (Guyafor network) -
plot Integer Number or name of plot -
Geom Geometry Geometry object POLYGON
A.Dourdain (UMR EcoFoG - CIRAD) March 2020 Source: Soucemarianadin, L., 2004, Weigel, J., 2006, Projection: EPSG: 32622 – WGS 1984 UTM 22N
2009, Roelens, J.B., 2007
Right to use: Under conditions Referent contact: Freycon, V. - CIRAD
Geographical Entity
Name Summary Spatial Illustration
Number
format
This spatial layer shows the
auger survey, which
taSoilSurvey.shp identified soils, their POINT 1094
position,and their
characteristics
➢ Attribute Table
Variable name Type Description Attributes of the variable
idSoilSurvey Integer A unique identifier object 1 - 419
idPlot Integer Unique plot identifier (Guyafor network) -
Plot Integer Number or name of plot -
0-10 Integer Charcoal, Depth = 0-100 cm 0=absence ; 1=presence
10-20 Integer Charcoal, Depth = 10-20 cm 0=no presence ; 1=presence
20-40 Integer Charcoal, Depth = 20-40 cm 0=no presence ; 1=presence
40-60 Integer Charcoal, Depth = 40-60 cm 0=no presence ; 1=presence
60-80 Integer Charcoal, Depth = 60-80 cm 0=no presence ; 1=presence
80-100 Integer Charcoal, Depth = 80-100 cm 0=no presence ; 1=presence
Coal Integer Charcoal, Depth = 0-100 cm 0=no presence ; 1=presence
A.Dourdain (UMR EcoFoG - CIRAD) March 2020NumSurvey Varchar Number of the auger survey as: PLOT-N° auger survey Ex. 8-28
Unique sampling identifier from fieldwork. This variable matches NUM_SONDAG -
idFieldWk Varchar NumSurvey? in order to understand the link between the spatial data and the
attribute table of the chemical analyses.
Refus Float Coarse element (%) 0 – 9.54
MO Float Organic matter (%) 0.62 – 7.84
C Float Organic Carbon (%) 0.36 – 4.55
N Float Nitrogen (‰) 0.24 – 3.22
C_N Float C/N ratio 12.02 – 20.44
Polsen Float Phosphorus (mg/kg) extracted using Olsen method 1.06 – 11.4
PBray2 Float Phosphorus (mg/kg) extracted using Bray2 method 0.66 – 25.78
Al_KCl Float Al exchangeable in KCl (cmol+/kg) 0.04 - 2.79
H_KCl Float H exchangeable in KCl (cmol+/kg) 0
Ca_ech Float Ca exchangeable by Metson method (cmol+/kg) 0.03 - 4.66
Mg_ech Float Mg exchangeable by Metson method (cmol+ / kg) 0.04 – 0.89
K_ech Float K exchangeable by Metson method (cmol+/ kg) 0.02 - 0.37
Na_ech Float Na exchangeable by Metson method (cmol+ / kg) 0.01 – 0.18
S Float Sum of exchangeable bases by Metson method (cmol+/ kg) 0.14 - 5
CEC Float cation exchange capacity by method Metson (cmol+/ kg) 1.52 – 12.65
TS Float Saturation rate (%) 2.16 – 93.4
Geom Geometry Geometry object POINT
A.Dourdain (UMR EcoFoG - CIRAD) March 2020TOPIC: Logging
Source: Forest CIRAD team - Petronelli, P., 1987 Projection: EPSG: 32622 – WGS 1984 UTM 22N
Right to use: Open data Referent contact: Petronelli, P. – CIRAD, UMR EcoFoG
Geographical Entity
Name Summary Illustration
Spatial format Number
This spatial layer shows the
1987 disturbed areas
taDisturbedAreas.shp (logging) at Paracou.
POLYGON 405
➢ Attribute Table
Variable name Type Description Attributes of the variable
idDist integer Unique identifier object 1-405
TypeDist varchar Type of object DisturbedAreas
idPlot integer Unique plot identifier (Guyafor network)
plot Integer Number or name of plot
Geom Geometry Geometry object POLYGON
A.Dourdain (UMR EcoFoG - CIRAD) March 2020 Source: : CIRAD team “Forest” - Petronelli, P., 1987 Projection: EPSG: 32622 – WGS 1984 UTM 22N
Right to use: Open data Referent contact: Petronelli, P. – CIRAD, UMR EcoFoG
Geographical Entity
Name Summary Illustration
Spatial format Number
This spatial layer shows
the logging direction on
taLoggingDirection.shp plot 9 during the 1987 LINESTRING 59
logging operation at
Paracou.
➢ Attribute Table
Variable name Type Description Attributes of the variable
idDirection Integer Unique direction identifier 1 - 59
idTree Integer Unique tree identifier -
Tree Integer Number of the fallen tree 0 - 2004
idPlot Integer Unique plot identifier (Guyafor network) 99
plot Integer Number or name of plot 9
Geom Geometry Geometry object LINESTRING
A.Dourdain (UMR EcoFoG - CIRAD) March 2020 Source: Forest CIRAD team - Petronelli, P., 1987 Projection: EPSG: 32622 – WGS 1984 UTM 22N
Right to use: Open data Referent contact: Petronelli, P. – CIRAD, UMR EcoFoG
Geographical Entity
Name Summary Illustration
Spatial format Number
This spatial layer shows the
skid trails created during
taSkidTrails.shp the 1987 logging operation
POLYGON 42
at Paracou
➢ Attribute Table
Variable name Type Description Attributes of the variable
idSkid Integer Unique identifier object 1-42
type varchar Type of object SkidTrails
idPlot Integer Unique plot identifier (Guyafor network) -
Plot Integer Number or name of plot -
Geom Geometry Geometry object POLYGONE
A.Dourdain (UMR EcoFoG - CIRAD) March 2020 Source: CIRAD forest Team - Petronelli, P., 1987 Projection: EPSG: 32622 – WGS 1984 UTM 22N
Right to use: Open data Referent contact: Petronelli, P. – CIRAD, UMR EcoFoG
Geographical Entity
Name Summary Illustration
Spatial format Number
This spatial layer shows the
gaps created during the
taGaps.shp 1987 logging operation at
POLYGON 412
Paracou
➢ Attribute Table
Variable name Type Description Attributes of the variable
idGap Integer Unique identifier object 1-42
TypeGap varchar Type of object Gaps
idPlot Integer Unique plot identifier (Guyafor network) -
Plot Integer Number or name of plot -
Geom Geometry Geometry object POLYGON
A.Dourdain (UMR EcoFoG - CIRAD) March 2020TOPIC: LIDAR (Raster)
Projection: EPSG: 32622 – WGS 1984 UTM 22N
Referent
Name Summary Provider Date Right of use Miscellaneous
contact
Pixel size: 1 -1 m
Dimension X: 2339, Y: 2809
DEM, DSM and DCM of Paracou in 2004 Vincent, G. -
DEM2004.tif Sabatier, D. 2005 Open data Band: 1
The aerial laser scanning (ALS) dataset, acquired in IRD
Min value: 6.25
October 2004, covers the Paracou experimental station
Max value: 39.7
in French Guiana. More precisely, the dataset covers all
Pixel size: 1-1 m
the whole Paracou plots, except plot 15 that is only
Dimension: X: 2339;Y: 2809
covered partially. The area includes logged and Vincent, G. -
DSM2004.tif Sabatier, D. 2005 Open data Band: 1
unlogged forest and Pinot palm. Ground echoes are IRD
Min value: 19.16
available as well as a digital terrain model (DTM), a
Max value: 66.80
digital surface model (DSM), and a digital canopy model
Pixel size: 1-1 m
(DCM) with a 1 meter resolution. These lidar data were
Dimension: X: 2339;Y: 2809
acquired as part of the program CAREFOR (ERDF) under Vincent, G. -
DCM2004.tif Sabatier, D. 2005 Open data Band: 1
the aegis of Daniel Sabatier. IRD
Min value : 3.45
Max value: 36.4
Pixel size: 5-5 m
Dimension: X: 591 ; Y: 875
Vincent, G. -
DEM2009.tif Altoa 2009 Open data Band: 1
IRD
Min value: 0
DEM, DSM and DCM of Paracou in 2009
Max value: 36.56
The aerial laser scanning (ALS) dataset, acquired on
Pixel size: 1 -1 m
September 11th, 2009, covers the Paracou experimental
Dimension: X: 2996; Y:4384
station in French Guiana. The area includes logged-over Vincent, G. -
DSM2009.tif Altoa 2009 Open data Band: 1
and unlogged forest, various forest heights and Pinot IRD
Min value: 0
palm swamp forest.
Max value: 69.06
Pixel size: 1 -1 m
Vincent, G. -
DCM2009.tif Altoa 2009 Open data Dimension: X: 2996; Y:4384
IRD
Band: 1
A.Dourdain (UMR EcoFoG - CIRAD) March 2020Min value: 0.057
Max value: 40.52
Pixel size: 1-1 m
Dimension: X: 4313; Y:4577
Vincent, G. -
DEM2013.tif Altoa 2013 Open data Band: 1
IRD
Valeur min : 2.42
DEM, DSM and DCM of Paracou in 2013 Valeur max : 36.77
The aerial laser scanning (ALS) dataset acquired on Pixel size: 1-1 m
September 23rd 2013 covers the Paracou experimental Dimension: X: 4313; Y:4577
Vincent, G. -
DSM2013.tif station in French Guiana. The coverage includes all Altoa 2013 Open data Band: 1
IRD
Guyafor and Guyaflux plots completely with logged- Min value: 20.73
over, unlogged and swamp forests ("Pinot" or "Açai"). Max value: 69.84
Pixel size: 1 -1 m
Dimension: X: 4313; Y:4577
Vincent, G. -
DCM2013.tif Altoa 2013 Open data Band: 1
IRD
Min value: 3.59
Max value : 40.77
Pixel size: 1-1 m
Dimension:X:3008;Y:3499
Vincent, G. -
DEM2015.tif Altoa 2015 Open data Band: 1
IRD
Min value: 2.68
DEM, DSM and DCM of Paracou in 2015
Max value: 37.01
The aerial laser scanning (ALS) dataset acquired on
Pixel size: 1-1 m
October 20th 2015 covers the Paracou experimental
Dimension: X:3008 ; Y:3499
station in French Guiana. The coverage includes all Vincent, G. -
DSM2015.tif Altoa 2015 Open data Band: 1
Guyafor and Guyaflux plots completely with logged- IRD
Min value: 21.32
over, unlogged and swamp forests ("Pinot" or "Açai").
Max value : 69.54
Pixel size: 1-1 m
Dimension: X:3008 ; Y:3499
Vincent, G. -
DCM2015.tif Altoa 2015 Open data Band: 1
IRD
Min value: 2.93
Max value: 40.37
LIDAR: Remote sensing by laser or LIDAR (LIght Detection And Ranging or Laser Detection And Ranging) is a long distance, active remote sensing technique based on the
analysis of a coherent laser beam reflected back towards its emittor. Lidar has applications in topography (geomorphology, altimetry and bathymetry), geosciences (seismic
risk, meteorology, atmospheric physics) and environmental sciences (atmospheric pollution studies, agronomy and forestry), not to mention in archaeology, meteorology,
air traffic control, automatic guidance of terrestrial or aerial vehicles, road safety, or defense.
A.Dourdain (UMR EcoFoG - CIRAD) March 2020Digital Terrain Model (DTM): A DTM is a 3D representation of the topography of a terrain, not including surface objects such as plants and buildings, created using
altitude data.
Uses of DTMs: Topography: A 3D layout of the ground surface, without construction or vegetation, is a very precise topographic reference tool. Hydrology : DTMs are a
reliable tool for understanding hydrological forms and movements. They can be used to identify watercourses, wetlands,... They can also be used to create Flood Risk
Management Plans (FRMP), by identifying watersheds, the direction of water flows, hydraulic modeling, and flood simulations. Geology : DTMs can be used to characterize
open-pit geological zones such as quarries, mining and gold-bearing areas, etc. Topographic data analysis allows operators to calculate extraction volumes and create
development strategies for these areas. Archeology: DTMs can highlight microreliefs related to ancient human activities (old roads, walls, remains of buildings ...)
Digital Surface Model (DSM): A DSM is a 3D representation of a terrain and its supersurface, namely vegetation and buildings.
Uses of DSM: Forest management: DSMs enable precise characterization of the surface of canopies. Using both DTM and DSM a digital canopy model (DCM) can be created
(DCM = DSM-DTM). DCMs allow calculations of forest populations and biomass volumes. These tools are becoming more and more central for the work of environmental
and agroforestry professionals. Urban planning: DSMs can equally be used to identify anthropogenic features of a landscape. The creation of models of urban landscapes
and their surrounding environments can be useful to urban planners for analyzing the existing urban fabric and planning future developments (e.g. road building, town
planning). Telecommunications: DSMs are used in the management of aerial networks (electric pylons, antennas ...). By identifying physical or aesthetic obstacles, DSMs
are a suitable tool in the planning and development of networks.
Formats and resolution: DTMs and DSMs can have many file extensions. Vectorial, e.g. .xyz, .dwg, .dxf, .shp, .las. Or raster, e.g. ASCII Grid, Mapinfo Grid, .tif, .kmz, .png.
DSM 2004 DCM 2009 DEM 2013 DEM 2015
A.Dourdain (UMR EcoFoG - CIRAD) March 2020Right of Referent Miscellaneou
Name Summary Provider Date
use contact s
Maps_of_topography.tif
Raster maps of topography are stored in a multi-layers raster that contains:
(i) a raster layer of absolute elevation corresponding to the Digital terrain
model (DTM) derived from LIDAR (Light Detection And Ranging : data acquired
across the Paracou site in October 2009 from the provider Altoa) data (in m);
Pixel size: 5-5
(ii) a raster layer of relative elevation corresponding to the relative altitude
m
above the nearest stream (in m);
Open Dimension X:
(iii) a raster layer of local slope angle corresponding to the estimation of slope Allié, E. 2015 Allié, E.
data 576, Y: 873
angle deviation from the horizontal plane (in degrees).
Band: 3
To download the raster and for detailed methods:
https://doi.org/10.1371/journal.pone.0141488.s001
To download the scientific article :
https://journals.plos.org/plosone/article?id=10.1371/journal.pone.0141488
#sec016
Raster maps of soil hydrology are stored in a multi-layers raster that contains:
Maps_soil_hydrology.tif (i) a layer of wetness index corresponding to the estimation of soil moisture;
(ii) a layer of flow accumulation corresponding to the estimation of surface
runoff.
Pixel size: 5-5
This raster derived from LIDAR (Light Detection And Ranging : data acquired m
across the Paracou site in October 2009 from the provider Altoa) data (in m). Open Dimension: X:
Allié, E. 2015 Allié, E.
data 576, Y: 873
To download the raster and for detailed methods: Band: 2
https://doi.org/10.1371/journal.pone.0141488.s002
To download the scientific article :
https://journals.plos.org/plosone/article?id=10.1371/journal.pone.0141488
#sec016
A.Dourdain (UMR EcoFoG - CIRAD) March 2020Raster maps of soil fertility are stored in a multi-layers raster that contains: (i)
a layer of total C content (in g.kg-1);
(ii) a layer of available P content (in mg.kg-1);
Maps_soil_fertility.tif (iii) a layer of Al exchangeable (in cmolc.kg-1); (iv) a layer of H exchangeable
(in cmolc.kg-1); (v) a layer of exchange bases soil-saturation (BS in %).
Pixel size: 5-5
m
This raster derived from LIDAR (Light Detection And Ranging : data acquired Open
Allié, E. 2015 Allié, E. Dimension: X:
across the Paracou site in October 2009 from the provider Altoa) data (in m) data
592, Y: 876
Band: 5
To download the raster and for detailed methods:
https://doi.org/10.1371/journal.pone.0141488.s003
To download the scientific article :
https://journals.plos.org/plosone/article?id=10.1371/journal.pone.0141488
#sec016
A.Dourdain (UMR EcoFoG - CIRAD) March 2020APPENDICES
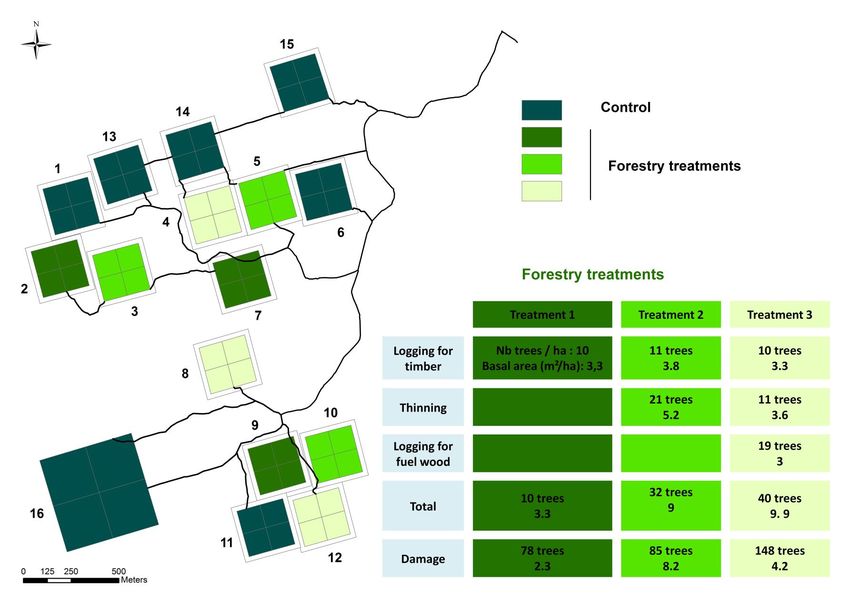
Appendix 1: Organization of the database
A.Dourdain (UMR EcoFoG - CIRAD) March 2020Appendix 2: Forest treatments in Paracou A.Dourdain (UMR EcoFoG - CIRAD) March 2020
Appendix 3: Inventory of soil mapping studies in Paracou and related studies (geomorphology ...)
                                           (adapted from Weigel 2006, simplified and completed)

                          Study              Referent               Plot                                 Comments
                   Boulet & Brunet 1983                                                    Soil sampling to implement the site map
                      Barthes 1991                               P1, P6, P11                            Soils mapping
                      Lhériteau 1994          B. Ferry               P16                                Soils mapping
                    Ferry 1998 à 2001                                All              Map of bottomlands according to water table depth
                       Le Fol 2002           V. Freycon              All                          Geomorphological survey
                     Malherbe 2002           V. Freycon                                   Geomorphological survey (toposequences)
                  Soucémarianadin 20046      V. Freycon                                      Description of 15 reference profiles
                  Soucémarianadin 2004       V. Freycon            P1, P6                               Soils mapping
                                                                Control plots
                       Cantet 2004            B. Ferry                                       Map of water logging, based on color
                                                             (P1, P6, P11 à P15)
                    Weigel 2005-2006         V. Freycon      P11, P13, P14, P15                         Soils mapping
                    Roelens 2006-2007        V. Freycon    P4, P5, P7, P9, P10, P12                     Soils mapping
                       Weigel 2009           V. Freycon          P2, P3, P8                             Soils mapping
                  Weigel & Freycon 2010                              All                  A printed synthesis report on soil mapping

6
    Pers. comm.
          A.Dourdain (UMR EcoFoG - CIRAD)                                                                                                 March 2020
Appendix 4: List of contacts
Firstname Name Institute eMail
Elodie Allié - elodie.allie@gmail.com
Aurélie Dourdain CIRAD – UMR EcoFoG Aurelie.Dourdain@ecofog.gf
Bruno Ferry AgroParisTech – UFR FAM bruno.ferry@agroparistech.fr
CIRAD - UPR Forêts et
Vincent Freycon vincent.freycon@cirad.fr
Sociétés
AgroParisTech – UMR
Gaëlle Jaouen Gaelle.Jaouen@ecofog.gf
EcoFoG
Pascal Petronelli CIRAD – UMR EcoFoG pascal.petronelli@cirad.fr
AgroParisTech – UMR
Stéphane Traissac Stephane.Traissac@ecofog.gf
EcoFoG
Grégoire Vincent IRD-UMR AMAP gregoire.vincent@ird.fr
A.Dourdain (UMR EcoFoG - CIRAD) March 2020Bibliography
Allié, E., 2016, « Assemblage Des Communautés d’arbres à Une Échelle Locale En Forêt Tropicale - Apport d’une Approche Intégrative », Sciences agricoles. Doctorat
Université de Guyane.
Baribault, T.W., Kobe, R.K., & Finley, A.O., 2012, « Tropical tree growth is correlated with soil phosphorus, potassium, and calcium, though not for legumes», Ecological
Monographs 82, 189-203.
Barthes, B., 1991, « Caractérisation pédologique de parcelles du dispositif "Forêt naturelle" du C.T.F.T. à Paracou (Sinnamary, Guyane) », Cayenne, Guyane Française,
Rapport interne ORSTOM/CTFT; 14p.
Bergonzini, J.C., Schmitt, L., 1985, « Constitution des blocs du dispositif "Forêt naturelle" du C.T.F.T. à Paracou (Sinnamary, Guyane) », Cayenne, Guyane Française,
Rapport interne CTFT; 39p
Boulet, R., Brunet, D., 1983, « Prospection pédologique en vue de l’implantation des blocs de l’operation C.T.F.T. "Forêt naturelle" », Cayenne, Guyane Française,
Rapport interne ORSTOM; 7p.
Cantet, L., 2004, « Prédiction de l'engorgement hydrique de surface par les cortèges floristiques en forêt tropicale humide (Guyane française) », Kourou, Guyane
Française - Nancy : Université Henri Poincaré, ENGREF: 22p.
Cantet, L., Delattre, M., et Guerin, G., 2003, « Engorgement hydrique et hydromorphie des sols », ENGREF, Kourou, Guyane Française.
Gourlet-Fleury S., Guehl, J.M., Laroussinie, O., 2004, « Ecology and Management of a Neotropical Rainforest. Lessons drawn from Paracou, a long-term experimental
research site in French Guiana», Elsevier, Paris, 3-60.
Ferry, B., Morneau, F., Bontemps, J.D., Blanc, L. & Freycon, V., 2010,«Higher treefall rates on slopes and waterlogged soils result in lower stand biomass and
productivity in a tropical rain forest», Journal of Ecology, 98: 106-116.
Jounieaux, M., 2016, «The effect of light micro-environment on growth and survival for saplings in French Guiana tropical rain forest: Utilisation of LiDAR data to
conceptualise light indexes», Biodiversity, Ecology and Evolution Master Degree of Montpellier University, France, co-accredited with AgroParisTech.
Le Fol, J., 2002, «Etude géomorphologique des sites de Paracou, Crique Plomb, Piste de St Elie», Université Toulouse II Le Mirail, Toulouse.
Lhériteau, F., 1994, « Etude de la relation sol-végétation en forêt dense humide de Guyane sur schistes de Bonidoro : cas d'une parcelle de 25 ha », Ecole Nationale
Supérieure Agronomique de Rennes, Rennes pp 56.
Malherbe, M., 2002, « Etude géomorphologique et pédologique du site de Paracou », Kourou, Guyane Française, CIRAD.
Montpied, P., 1992, « La régénération naturelle en forêt tropicale humide, effet de traitements sylvicoles d'intensité variable : bilan des inventaires INRA à Paracou»,
Kourou, Guyane Française, 1986 - 1992.
A.Dourdain (UMR EcoFoG - CIRAD) March 2020 Morneau, F., 2007, « Effects of a hydrological gradient on the structure and dynamic of a tropical rain forest (Paracou, French Guiana) », Thèse, Kourou, Guyane
Française, ENGREF.
Nogueira, E.M., Nelson, B.W., Fearnside, P.M., 2005, «Wood density in dense forest in Central Amazonia, Brazil », For. Ecol. Manag. 208, 261–286.
Paoli, G.D., Curran L.M., Zak D.R., 2006 « Soil nutrients and beta diversity in the Bornean Dipterocarpaceae: evidence for niche partitioning by tropical rain forest trees
», Journal of Ecology 94, 157-170.
Roelens, J.B., 2007, « Cartographie pédologique de six parcelles exploitées sur le dispositif expérimental de Paracou », Rapport d'activités, CIRAD/UMR ECOFOG,
Kourou, Guyane française, 25p.
Sabatier, D., Grimaldi, M., Prévost, M.F., Guillaume, J., Godron, M., Dosso, M., Curmi, P., 1997 « The influence of soil cover organization on the floristic and structural
heterogeneity of a Guianan rain forest», Plant Ecology 131, 81-108.
Soucémarianadin, L., 2004, « Recherche de critères du sol influençant la structure et la composition floristique d'une forêt tropicale humide (Paracou, Guyane
française) », Ecole Nationale Supérieure Agronomique de Rennes.
Weigel, J., 2006, « Cartographie pédologique de quatre parcelles témoins. Dispositif de Paracou, Guyane française », », Kourou, Guyane Française, ENGREF/UMR
ECOFOG, 31 p.
Weigel, J., 2009, « Compte-rendu de mission en Guyane du 7 au 25 juin 2009 : encadrement de M. Desprez (Montagne Plomb, Laussat) et de J. Weigel (Cartographie des
sols Paracou). Aperçu d'anciens sites amérindiens (Montagne couronnée, Eperon barré), V. Freycon » Kourou, Guyane Française, CIRAD, 34 p.
A.Dourdain (UMR EcoFoG - CIRAD) March 2020You can also read